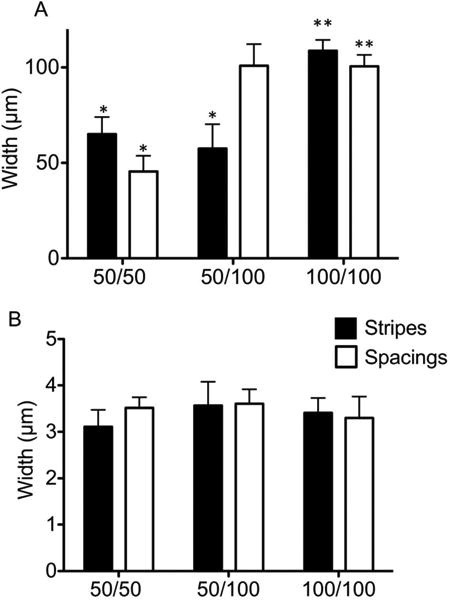
Figure 2.

Histograms of (A) patterned PNIPAM microgels within 50 μm stripes/50 μm spacings, 50 μm stripes/100 μm spacings, and 100 μm stripes/100 μm spacings patterned samples and (B) stripe-width and spacings of spontaneously-formed patterns within stripe regions on substrates with 50 μm stripes/50 μm spacings, 50 μm stripes/100 μm spacings, and 100 μm stripes/100 μm spacings. * p<0.05 vs hypothetical value 50.0 calculated using one-sample t-test and ** p<0.05 vs hypothetical value 100.0 calculated using one-sample t-test. n=19, error bars represent standard deviation.
