Abstract
The two–component flavoprotein styrene monooxygenase (SMO) from Pseudomonas putida S12 catalyzes the NADH– and FAD–dependent epoxidation of styrene to styrene oxide. In this study we investigate the mechanism of flavin reduction and transfer from the reductase (SMOB) to epoxidase (NSMOA) component and report our findings in light of the 2.2–Å crystal structure of SMOB.
Upon rapidly mixing with NADH, SMOB forms an NADH→FADox charge–transfer intermediate and catalyzes a hydride–transfer reaction from NADH to FAD, with a rate constant of 49.1 ± 1.4 s−1, in a step that is coupled to the rapid dissociation of NAD+. Electrochemical and equilibrium–binding studies indicate that NSMOA binds FADhq ~13–times more tightly than SMOB, which supports a vectoral transfer of FADhq from the reductase to the epoxidase. After binding to NSMOA, FADhq rapidly reacts with molecular oxygen to form a stable C(4a)–hydroperoxide intermediate. The half–life of apoSMOB generated in the FAD–transfer reaction is increased ~21–fold, supporting the model of a protein–protein interaction between apoSMOB and NSMOA with the peroxide intermediate.
The mechanisms of FAD–dissociation and transport from SMOB to NSMOA were probed by monitoring the competitive reduction of cytochrome c in the presence and absence of pyridine nucleotides. Based on these studies, we propose a model in which reduced FAD binds to SMOB in equilibrium between an unreactive, sequestered state (S–state) and more reactive, transfer state (T–state). Dissociation of NAD+ after the hydride transfer–reaction transiently populates the T–state, promoting the transfer of FADhq to NSMOA. The binding of pyridine nucleotides to SMOB–FADhq shifts the FADhq–binding equilibrium from the T–state to the S–state. Additionally, the 2.2–Å crystal structure of SMOB–FADox reported in this work is discussed in light of the pyridine nucleotide–gated flavin–transfer and electron–transfer reactions.
Introduction
Styrene occurs naturally in the environment as a petroleum component and as an enzymatic metabolite of cinnamic acid decarboxylation.1, 2 Due to the large–scale worldwide production of styrene for use in synthetic plastic and rubber industries and an increasing reliance on fossil fuels as a source of energy, environmental contamination by styrene has reached unprecedented levels, primarily from industrial accidents and effluent, as well as the incomplete combustion of fossil fuels and other organic materials.3–5
Though styrene represents an essential commodity, its large–scale synthesis and distribution pose significant human and environmental health concerns, as it can disrupt biological membranes and act as a potential carcinogen in higher organisms.6,7 Exposure to styrene induces eukaryotic isoforms of cytochrome P450, which oxygenate the styrene aromatic ring and vinyl group to yield carcinogenic metabolites like styrene–7,8–oxide, a neurotoxin and alkylating agent, and 4–vinylphenol, a pulmonary toxin.6,8–10 This downstream toxicity categorizes styrene as a metabolic “Trojan Horse.” Despite these cytotoxic effects in higher organisms, fungi and bacteria have evolved pathways allowing them to detect, transport, and catabolize styrene as a sole source of carbon and energy.11–14
The catabolic genes of Pseudomonas putida (S12) include a two–component E–class FAD– dependent styrene monooxygenase (SMO), which catalyzes the enantioselective epoxidation of styrene to (S)–7,8–styrene oxide through the concerted actions of an NADH–specific reductase (SMOB) and an FAD–specific epoxidase (SMOA).15,16 The delivery of reduced FAD (FAD hydroquinone, FADhq) from the reductase to the monooxygenase poses a mechanistic challenge for all members belonging to this class of two–component flavin monooxygenase. If the rate of flavin reduction exceeds the rate of the substrate oxygenation reaction, excess reduced flavin will accumulate and react with dissolved cytosolic oxygen to generate reactive oxygen species such as hydrogen peroxide and superoxide.17
Various biological strategies have evolved to accommodate the efficient exchange of flavin between the reductase and epoxidase active sites of two–component flavin monooxygenases, including direct flavin–transfer via the formation of a protein–protein complex, as observed in alkanesulfonate monooxygenase, allosterically activated dissociation of flavin from the reductase component of 4–hydroxyphenylacetate–3–hydroxylase, and NAD+–gated transfer of FMN from the reductase to the hydroxylase components of ActV in actinorhodin biosynthesis.18–20 In addition, redox–linked flavin–binding equilibria have been shown to thermodynamically favor the binding of reduced flavin by the monooxygenase components of ActV and SMO, where it reacts rapidly with oxygen to form a stable flavin hydroperoxide intermediate that is poised to catalyze substrate oxygenation.21,22 The hydroxyflavin product of the styrene epoxidation reaction eliminates water to regenerate oxidized FAD, which binds weakly to N–terminally tagged SMOA (NSMOA), thus favoring flavin dissociation and return of flavin back to SMOB.23
No evidence for a ternary complex formed between oxidized FAD, the epoxidase, and the reductase has been detected under equilibrium conditions for either SMO or the closely related 4–hydroxyphenylacetate–3–monooxygenase.24–29 However, the efficiency of coupling NADH oxidation by SMOB to styrene oxide synthesis by NSMOA is higher than would be expected for a purely diffusive reaction.26 This disparity prompted us to investigate the possibility that transient epoxidase–reductase interactions at other intermediate points in the oxidative or reductive half reactions of SMO could be responsible for the increased reaction efficiency.
In the present work we investigate the reductive half reaction of SMOB and the mechanism of transport of reduced flavin from SMOB to NSMOA. By using a combination of steady–state and rapid–reaction kinetic techniques, we find new evidence supporting a model of flavin–transfer that incorporates transient protein–protein interactions in the reaction mechanism of SMO. In addition, we report the crystal structure of SMOB with oxidized FAD bound solved at 2.2–Å resolution, and discuss the binding configurations of FAD as they relate to the mechanism of SMO and the homologous structures of the reductase comonents of phenol hydroxylase and 4–hydroxyphenylacetate–3–monooxygenase.30,31
Experimental
Expression and Purification
Native SMOB (SMOB) and N–terminally histidine–tagged NSMOA (NSMOA) were expressed from pET–29SMOB and pET–28NSMOA in E. coli BL21 (DE3)26. NSMOA was purified by nickel–affinity chromatography as previously described (22). SMOB was recovered by a method similar to that previously reported.26 Cell pellets recovered from a 6 L expression of native SMOB were harvested by centrifugation and washed in Buffer A (50 mM Tris, 0.5% Triton X–100, 10 mM EDTA, pH 7.5) to eliminate contamination from the expression medium and stored at −80 °C. Cell pellets were then thawed in 50 mL of Buffer A containing 1 mM PMSF and disrupted by sonication. The resulting suspension was pelleted by centrifugation at 2000 × g and resuspended in Buffer B (50 mM Tris, 2.0 M urea, pH 7.5). Insoluble inclusion bodies were recovered by centrifugation at 2000 x g and dissolved in 1 L of Buffer C (50 mM Tris, 8.0 M urea, 5 mM DTT, pH 7.5). 250 mL of this solution was transferred to a 13,000 molecular weight cut off dialysis tube and dialyzed overnight against 4 L of Buffer D (50 mM Tris, 1 mM DTT, 100 μM FAD, pH 7.5) and concentrated by ultrafiltration to 1 mM. The concentrated enzyme was stored as 50% glycerol stocks at −20 °C. To establish the molar absorptivity of SMOB, a sample was denatured by heating to 90 °C for 5 minutes to release all bound FAD and the insoluble denatured protein was removed by centrifugation. The absorbance of released FAD in this process was measured spectrophotometrically and the concentration was computed by using the molar extinction coefficient at 450 nm (11,300 M−1 cm−1). A molar extinction coefficient for FAD bound to SMOB of 10,800 M−1 cm−1 at 456 nm was computed by dividing the absorbance of the FAD–bound protein by the concentration of FAD released in the heat denaturation (Figure S1).
Stabilizing Effect of FAD and NSMOA on SMOB
The stabilizing effect of FAD was evaluated by comparing the half–lives of apoSMOB and holoSMOB preparations. ApoSMOB was prepared by diluting a 50% glycerol stock to 10 μM, mixing with 90 mg activated carbon, then immediately filtering through a 0.22 μm Spin–X centrifuge filter. The apoSMOB was then incubated at 15 °C on the stopped–flow instrument. In order to determine the role NSMOA plays in apoSMOB stabilization, apoSMOB was also generated via NSMOA. By mixing 600 nM SMOB with 15 μM NSMOA and 100 μM NADH, the high Kd of NSMOA for reduced FAD (0.2 μM at 15 °C) and the 25–fold excess of NSMOA over SMOB ensures that a majority of the available FAD is reduced and bound to NSMOA in a stable peroxide intermediate. The activity of apoSMOB generated by these two methods was assayed at regular time intervals (over a 70 minute period) by mixing apoSMOB with 20 μM FAD and 200 μM NADH and observing the kinetics at 340 nm. Slopes were measured during the linear steady–state phase of each assay and plotted against incubation time.
Steady–State Fluorescence Measurements
SMOB was exchanged into 20 mM MOPSO, pH 7.0, with 5% glycerol by gel filtration to remove excess FAD, then diluted to 200 nM in a 3 mL quartz cuvette containing 1.5 mL of the same buffer. All studies were conducted with a Horiba Jobin Yvon Fluorolog–3 spectrofluorometer. Fluorescence excitation and emission spectra were recorded with 1 nm spectral resolution at temperatures ranging from 4–30 °C while stirring the sample with a 5 mm Teflon–coated stir bar. Fluorescence was excited at 456 nm and emission monitored at 563 nm. Data points used for fitting represent averages of 100 independent determinations. The data were fit using the quadratic Equation 1 (23, 30).
| (1) |
Measurement of Redox Potential
SMOB with oxidized FAD bound was exchanged into a 20 mM MOPSO, pH 7.0, buffer with 5% glycerol, transferred to an anaerobic quartz cuvette and titrated with sodium dithionite in the presence and absence of anthroquinone(–1,5)–disulfonate (AQ15DS), and anthroquinone–2–sulfonate (AQ2S) at 22 °C. The reduction potential of FAD bound to SMOB was estimated by fitting spectral data representative of the redox equilibria obtained after each incremental addition of dithionite. The fractions of oxidized and reduced species present were computed using the oxidized and reduced basis spectra of the redox indicators and SMOB–bound FAD. The table function built into the Kaleidagraph software was used to find the best fitting linear combination of oxidized and reduced dye and SMOB basis spectra to describe each intermediate spectrum in the equilibrium titration. The highly over–determined system of equations solved in this process is represented by Equation 2.
| (2) |
The best fitting equilibrium values of oxidized dye and SMOB concentration computed from each spectrum were substituted into the Nernst equation, given by Equation 3.
| (3) |
Stopped–flow Spectroscopy
Rapid kinetic data were recorded at a single wavelength using an Applied Photophysics SX–17 stopped–flow instrument equipped with absorbance and fluorescence photomultiplier tubes and diode array detection, as previously described (22, 23). Preparations and equipment for running experiments under anaerobic conditions were similar to those described previously (22, 26). In these studies SMOB was exchanged into 20 mM MOPSO, pH 7, buffer containing 5% glycerol by gel filtration; all kinetic studies were performed at 15 °C. Time resolved absorption spectra with a 5 ms integration time were recorded with an Ocean Optics USB2000+ spectrophotometer interfaced with the stopped–flow flow cell through a 400–μm fiber optic cable. This instrument was controlled by SpectraSuite operating software and triggered externally by the stop syringe. Typically between 500 and 1000 spectra were recorded per shot. Software was developed using MATLAB to transform intensity data output by the diode array into absorbance data, correct the stopped–flow data for instrument dead–time (3 ms), and logarithmically time–average the data to reduce the data set to a more manageable size of ~50 logarithmically spaced spectra. Kinetic traces were fit with sums of exponential equations using Kaleidagraph software, giving rate constants describing the kinetic change.
During the observation of the epoxidation reaction, fluorescence was induced by excitation at 410 nm (2–nm excitation slit–width), corresponding to the hydroxyflavin peak; emission was monitored at ~520 nm by placing a VG–6 filter (420–620 nm transmission band) in front of the emission photomultiplier, as previously described.23
Cytochrome c reacts rapidly to accept electrons from free reduced flavin in solution and thus serves as a valuable reagent to help establish the mode of FAD–transfer from the reductase to the oxygenase component of two–component flavoenzymes.19,32,37 It was observed that the reduction of cytochrome c by dithionite–reduced FAD was unaffected by the presence of oxygen; for this reason, all cytochrome c experiments were performed aerobically. In our studies, the reduction of bovine heart cytochrome c with flavin–derived reducing equivalents was monitored by observation of the α–band at 550 nm using rapid scanning diode array or photomultiplier detection. In these studies we used a molar extinction of 8,400 M−1cm−1 for oxidized cytochrome c at 550 nm. Due to the limited spectral resolution of our stopped–flow instrument at 550 nm, we used empirically determined apparent molar extinction coefficients of the cytochrome c α–band (21,600 M−1cm−1 for photomultiplier–based detection and 24,808 M−1cm−1 for diode array–based detection) to compute the concentration of reduced cytochrome c and the extent of cytochrome c reduction.
Reduced cytochrome c reacts with FADhq primarily in the dead–time of the stopped–flow instrument, due to the large second order rate constants for the reaction of the hydroquinone (3 × 10⁷ M−1s−1) and semiquinone (7 × 10⁷ M−1s−1) forms of reduced flavins.37 In our studies we found that that in reactions of SMOB–FADhq or pyridine nucleotide complexes of the reduced reductase cytochrome c, reduction proceeded with first–order kinetics, even when reacted under second– order conditions with respect to the concentration of SMOB–FADhq. This feature is useful for characterizing the kinetics of slower upstream processes that gate the subsequent rapid reactions of free FADhq with cytochrome c. In our studies we found that reactions of oxidized cytochrome c with SMOB–FADhq are gated by slower upstream kinetic processes associated with the dissociation of FADhq from SMOB–FADhq. For this reason, the observed first order rate constants coupled to the cytochrome c reduction reactions represent the rate–limiting kinetics of the reaction steps preceding cytochrome c reduction in the studies presented here.
Crystallization and Structure Determination
SMOB was exchanged into a 25 mM Tris, pH 7.5, buffer containing excess FAD, and concentrated to ~6–7 mg/mL. The protein was crystallized in buffer containing 100 mM Tris, pH 8.5, 1.7–1.9 M (NH4)2SO4, and 200–300 mM NH4NO3 by using the sitting drop vapor diffusion method at room temperature and combining equal volumes of protein and mother liquor. Small yellow rods of 0.05 μm × 0.05 μm × 0.2 μm grew within a week and were flash frozen in a cryo solution containing 50 mM Tris, pH 8.5, 1.6 M (NH4)2SO4, and 200 mM NH4NO3, and 25% glycerol before data collection on NE–CAT beam line 24–IDE at 100 K. The crystals belonged to the space group P32 and had unit dimensions a = b = 130.0 Å and c = 92.3 Å. The reflections were indexed and scaled using HKL2000.34 The scaling and refinement statistics are summarized in Table 1. Analysis of the data in Phenix revealed the asymmetric unit contained six dimers and that the crystals had 47% pseudo–merohedral twinning. Molecular replacement was performed with Phaser using the Geobacillus thermoglucosidasius flavin reductase PheA2 structure (1RZ0) as a starting model.30,35 Model building and subsequent refinements were carried out in Coot and Refmac5. The r.m.s. deviation between all backbone atoms in the 6 molecules comprising the asymmetric unit ranged between 0.13–0.25 Å2. Analysis of the final structure by Procheck indicated 92.7%, 6.6% and 0.7% of residues were in favorable, allowed and unfavorable regions of the Ramachandran plot, respectively. Those residues lying in unfavorable regions (12 total) localized to disordered loops with weak electron density.
Table 1.
X-ray data collection, scaling, and refinement statistics.
| Data Collection | |
|---|---|
| Beamline | NE-CAT 24IDE |
| Wavelength (Å) | 0.979 |
| Space Group | P3sub2 |
| Unit cell dimensions (Å) | 130.0 × 130.0 × 92.3 |
| Resolution range (Å) | 50–2.23 |
| Total Reflections | 531349 |
| Unique Reflections | Ccp4i 76065 scalepack87338 |
| Completeness (%) | 99.99 (99.0) |
| I/σ(I)2 | 13.4 (6.9) |
| Rsym (%)a,b | 10.5 (35.5) |
|
| |
|
Refinement
| |
| Rcrystal (%)c | 16.0 |
| Rfree (%)d | 21.9 |
| Average B-value (Å2) | 16.0 |
| r.m.s. deviation bond length (Å) | 0.023 |
| r.m.s. deviation bond angles (°) | 2.11 |
| Dimers per ASU | 6 |
| No. Protein Atoms | 15301 tot. |
| No. Non-Protein Atoms | 164 |
| Water Molecules | 152 |
| PDB Code | 4F07 |
Values in parentheses are for the highest resolution shell.
Rsym = ΣiΣhkl |Ii(hkl) - < I(hkl) > |/Σhkl < I(hkl) >, where Ii(hkl) is the ith measured diffraction intensity and < I(hkl) > is the mean intensity for the Miller index (hkl).
Rcrystal = Σhkl ||Fo(hkl)| - |Fc(hkl)||/Σhkl |Fo(hkl)|.
Rfree = Rcrystal for a test set of reflections (5% in each case.)
Results
Role of FAD and NSMOA in the Stability of SMOB
The stability of apo– and holo–SMOB was investigated by monitoring steady–state activity of the reductase at regular time points of incubation. SMOB–FADox incubated at 15 °C showed a steady drop in activity over an 80–minute period, with a half–life of 22.2 ± 0.8 minutes (Figure S2). When apoSMOB was generated by activated carbon treatment, however, the protein was significantly destabilized, showing a half–life of 9.2 ± 0.2 minutes under similar conditions. This is in agreement with the finding that the addition of FAD during the refolding step of the SMOB purification greatly increases the yield of active protein, as well as the observation that apoSMOB is less soluble and less stable than the FAD–bound form.
It was also observed that the stability of SMOB is markedly enhanced when it is co–incubated with 25–fold excess of NSMOA under aerobic conditions. In this reaction, FAD is reduced and transferred from SMOB to NSMOA, where it reacts with oxygen to form a stable C(4a)–FAD–hydroperoxide intermediate. The reaction is characterized by an initial 34% decrease in activity (t1/2 = 1.6 ± 0.2 minutes), after which the reductase activity stabilizes and remains constant for the remainder of the 80–minute incubation period. This observation suggests that NSMOA with the bound FAD–peroxide intermediate interacts with apoSMOB in a way that significantly prolongs SMOB stability and reductase activity.
FAD–Binding and Redox Equilibria
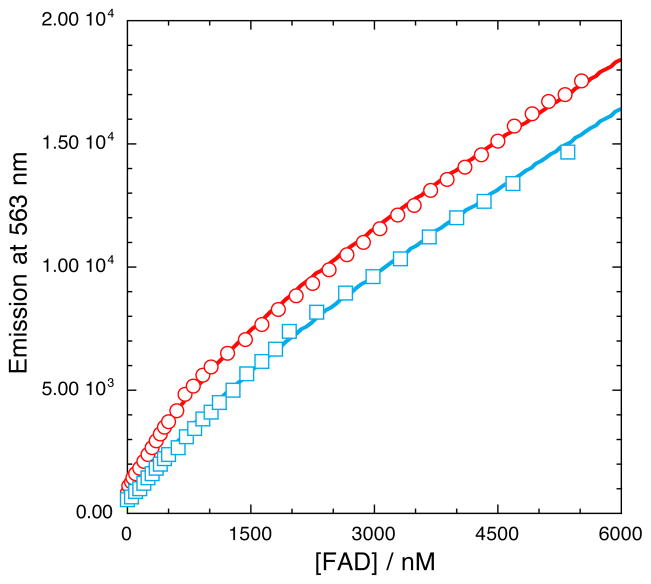
The equilibrium dissociation constant of oxidized FAD for SMOB was established by a series of fluorescence titration experiments. Each titration was accompanied by a hyperbolic increase in fluorescence emission intensity associated with FAD binding to SMOB and a subsequent linear increase as free FAD accumulated in solution (Figure 1). The best fitting Kd values were observed to increase with temperature from Kd = 356 ± 30 nM at 4 °C to Kd = 1.15 ± 0.14 μM at 25°C, according to the van’t Hoff relationship. These values are in good agreement with a Kd value estimated previously by equilibrium ultrafiltration methods in this temperature range.24
Figure 1.
Fluorescence titration monitoring the binding of FAD to SMOB (200 nM) at 4°C (red) and 25 °C (blue). Fluorescence was excited at 456 nm and emission monitored at 563 nm. Quadratic fits through the data according to Equation 1 yield Kd estimates of 0.36 ± 0.03 μM and 1.15 ± 0.14 μM at 4 °C and 25 °C, respectively.
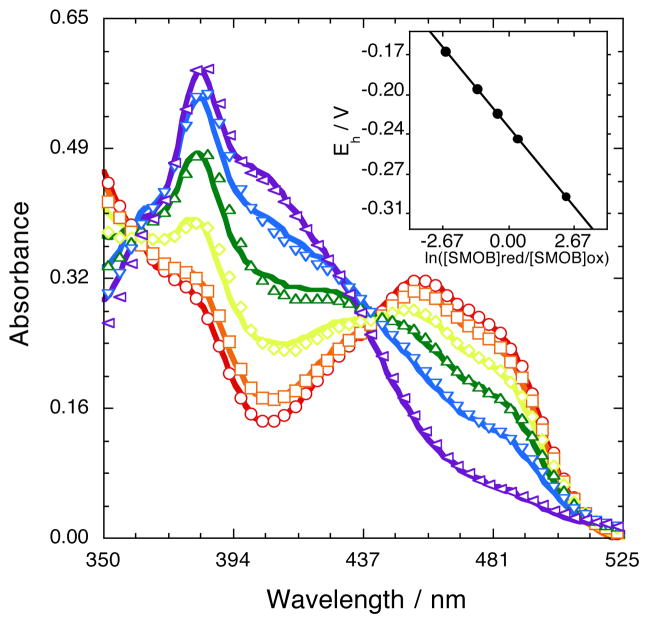
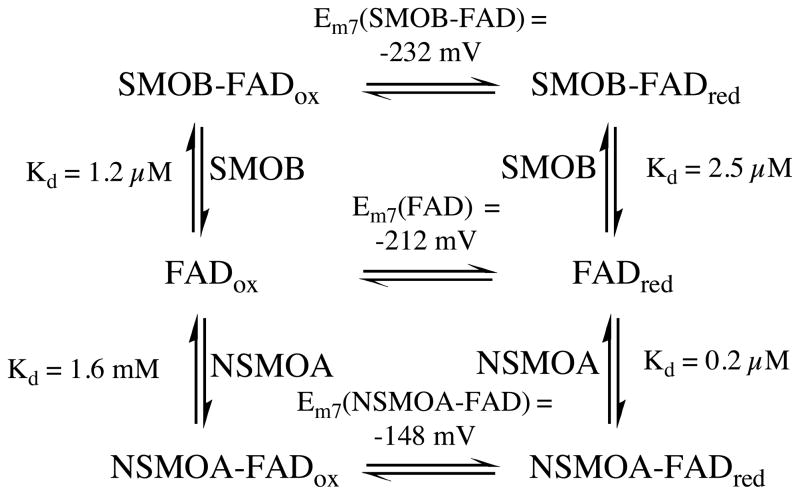
The equilibrium midpoint potential of SMOB was established to be −232 ± 9 mV and −232 ± 6 mV by using AQ15DS and AQ2S as reference indicators, respectively. These data represent a 20 mV decrease in midpoint potential below that of free FAD.26 Fits through the AQ2S raw titration data, and an inset plot of the solution potential as a function of the extent of SMOB reduction computed from the Nernst equation, are shown in Figure 2. Oxidized FAD was calculated to bind 2.2–fold more tightly to SMOB than reduced FAD. This is a relatively slight increase in FAD binding affinity, and is consistent with the observation that reduced FAD remains tightly associated with SMOB after gel filtration under both oxidizing and reducing (buffer containing 5 mM dithionite) conditions. A general scheme describing the binding equilibria of reduced and oxidized FAD to SMOB and NSMOA is shown in Scheme 1.
Figure 2.
Reductive titration to determine the oxidation–reduction potential of FAD bound to SMOB. SMOB (32 μM) and AQ2S (60 μM) were titrated incrementally with dithionite at 22 °C and pH 7. Spectra were recorded after each addition, with the observed absorbance decreases at 456 nm corresponding to the increasing extent of reduction. Lines passing through data points represent best fitting linear combinations of oxidized and reduced dye and SMOB basis spectra obtained using Kaleidagraph’s table function (Equation 2). Concentrations returned from these fits were used to construct the Nernst plot shown and to compute the equilibrium midpoint potential for reduced SMOB as −232 ± 6 mV (Equation 3).
Scheme 1.
Redox-linked binding equilibria of FAD, SMOB, and NSMOA.
Kinetics of the FAD–Reduction Reaction
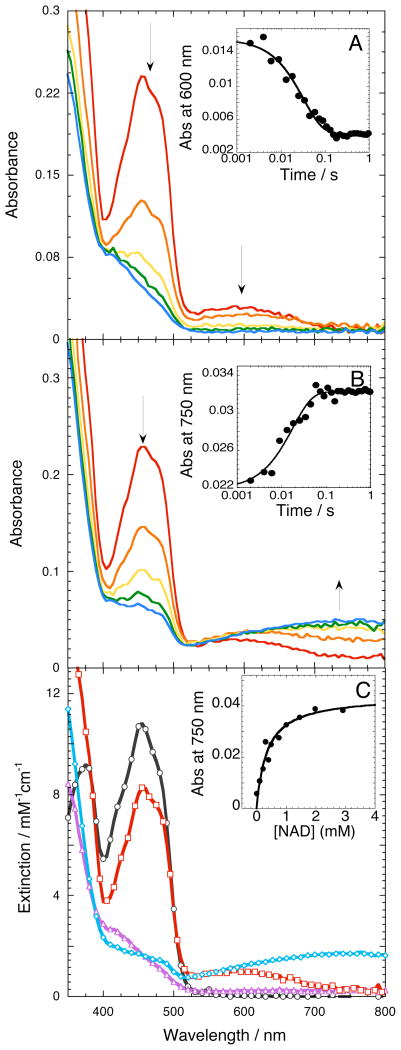
The reaction of SMOB with NADH was evaluated by stopped–flow absorbance spectroscopy. Time–resolved absorbance spectra recorded with a 5 ms exposure time are presented in Figure 3. Spectra documenting the reaction of SMOB with NADH (Figure 3A) indicate the presence of an NADH→FADox charge transfer complex (CT–1) during the first 5 milliseconds after mixing.36 The formation of this intermediate is followed by a hydride–transfer reaction from NADH to FAD at a rate of 48.7 ± 1.1 s−1 at 15 °C. The temperature dependence of this rate constant yields a linear Eyring plot.
Figure 3.
SMOB reduction kinetics and intermediate spectra recorded by stopped-flow diode array absorbance spectroscopy. (A) Time-resolved reduction spectra monitoring the conversion of the NADH→FADox charge-transfer complex (CT–1) to SMOB–FADhq. CT–1 formed in the mixing time of the stopped flow as 29 μM SMOB reacted with 36 μM NADH. Inset: kinetics of CT–1 reduction monitored at 600 nm. (B) Conversion of CT–1 to the NAD+→FADH− charge-transfer complex (CT–2). Data obtained from the reaction of SMOB (28 μM), NADH (36 μM) and NAD+ (2.4 mM). Inset: CT–2 formation at 750 nm. (C) Plot showing representative spectra of each species, with oxidized SMOB (black), NADH→FADox charge-transfer complex (CT–1) (red), NAD+→FADH− charge-transfer complex (CT–2) (blue) and reduced SMOB (purple). The CT–2 spectrum was corrected for the contribution of oxidized FAD absorbance by subtracting a spectrum corresponding to 1.4 μM SMOB-FADox from the final spectrum recorded at 1 second (B). Inset: Equilibrium titration of SMOB–FADhq with NAD+. Line represents the best hyperbolic fit through the CT–2 absorbance data recorded at 750 nm as a function of titrating SMOB–FADhq with increasing concentrations of NAD+ at 15 °C; fitting gives Kd of 356.3 ± 71 μM.
In the single–turnover reduction reaction of SMOB, no NAD+→FADH− charge–transfer complex (CT–2) accumulated, suggesting that NAD+ rapidly dissociates from the enzyme in a reaction that is fast compared to the preceding hydride–transfer step. For this reason, the CT–2 complex does not accumulate in the SMO flavin–transfer reaction. To observe CT–2, the chemically reduced SMOB–FADhq complex was titrated with NAD+ under anaerobic conditions (Figure 3C, inset). Fitting these spectra yielded an NAD+ Kd of 356 ± 71 μM for reduced SMOB. The kinetics describing the formation of CT–2 were studied by rapidly mixing oxidized SMOB with stoichiometric NADH and varied amounts of NAD+ (Figure 3B, inset). The rate of hydride transfer is only modestly affected by the presence of NAD+ (k = 43 ± 1.7 s−1), compared to rates observed without NAD+ present (k = 48.7 ± 1.1 s−1). The apparent lack of competition indicates NAD+ binding must be significantly weaker than NADH to SMOB–FADox. Spectra of SMOB corresponding to the CT–1 kinetic intermediate and CT–2 state are presented in Figure 3C.
Reduction and Oxygen Reactions of SMO Monitored at 340 nm
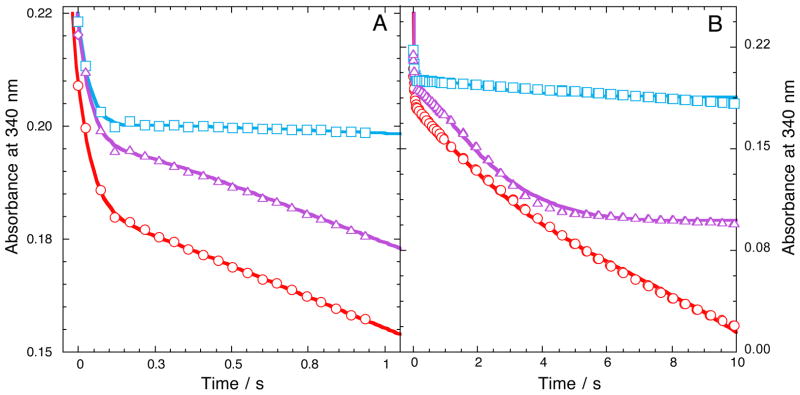
Kinetics of SMOB–FADox reacting with NADH in the presence and absence of equimolar NSMOA monitored at 340 nm are shown in Figure 4. At this wavelength, oxidized and reduced spectra of FAD bound to SMOB are nearly isosbestic, but the oxidation of NADH to NAD+ occurs with a decrease in molar absorptivity (ε340nm = 6220 M−1 cm−1) (Figure S1). In the reaction of SMOB–FADox with NADH and O2 (Figure 4A), the initial exponential drop in absorbance at 340 nm corresponds to the oxidation of NADH in the first turnover. The observed rate of this reaction matches that of the transformation of SMOB–FADox to SMOB–FADhq by hydride–transfer monitored at 450 nm (Figure 3C, Inset), and is not dependent on NSMOA or styrene. The single–turnover reaction is followed by a subsequent period of steady–state NADH oxidation. For the steady–state reaction of SMOB–FADox with NADH and O2, the initial rate of NADH oxidation proceeds with an observed rate constant of 0.997 ± 0.002 s−1, corresponding to the rate–limiting kinetics of reoxidation of the reduced FAD by molecular oxygen. When equimolar SMOB–FADhq and NSMOA are reacted with NADH and O2, the result is markedly different. Under these conditions, the single–turnover kinetics of the SMOB reduction reaction are immediately followed by a much slower steady–state oxidation of NADH with an observed rate constant of 0.0763 ± 0.001 s−1, corresponding to the rate–limiting decomposition of the NSMOA peroxide intermediate in the absence of styrene.22 For reactions including NSMOA and styrene, the SMOB–catalyzed hydride transfer reaction is followed by the steady–state epoxidation reaction limited by the rate constant for hydroxy–FAD dehydration (0.819 ± 0.001 s−1).22 This reaction continues until the limiting–reagent, styrene, is consumed, then enters a final steady–state phase with a reaction rate that closely parallels the kinetics observed in the rate–limiting decomposition of the NSMOA peroxide intermediate in the absence of styrene.22
Figure 4.
Reduction and oxygen reactions of SMO components monitored at 340 nm. NADH oxidation monitored at 340 nm along 0.1 cm pathlength at 15 °C for 1 second (A) and 10 seconds (B) of 45 μM SMOB with 250 μM NADH (red), in the presence of 48 μM NSMOA (blue) and in the presence of 48 μM NSMOA and 125 μM styrene (purple).
Single–Turnover Kinetics of the Epoxidation Reaction
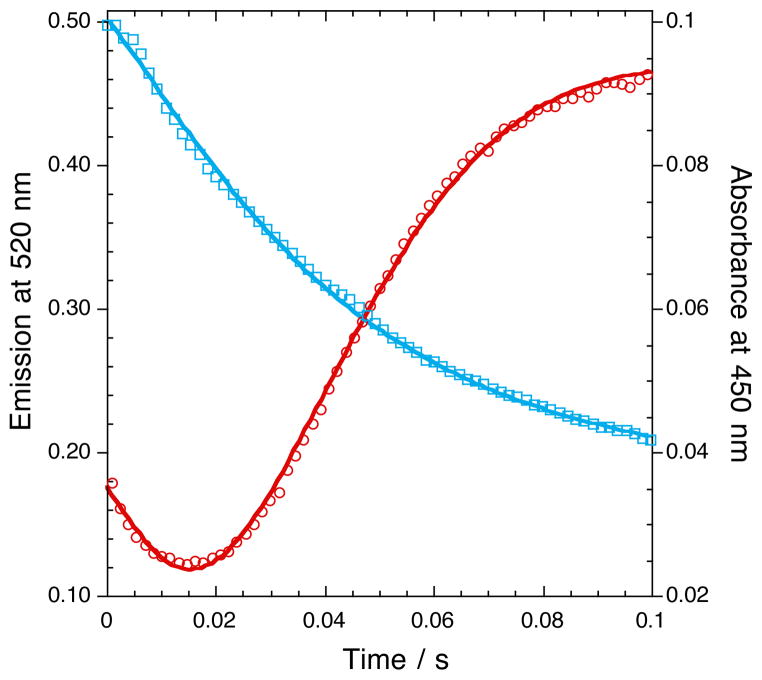
To study the SMO epoxidation mechanism, matched concentrations of NSMOA and SMOB–FADox were rapidly mixed with 35 μM NADH and 250 μM styrene in the stopped–flow instrument. Kinetics were monitored by absorbance at 450 nm and by fluorescence emission at 520 nm (Figure 5). The lines passing through the data points represent the best exponential fits of the observed data. The absorbance data, which represents the hydride transfer reaction from NADH to FAD, were fit with a rate constant of 50.0 ± 1.7 s−1. The fluorescence data, however, are more complex. The decrease in fluorescence during the first phase represents the FAD–reduction reaction (k = 49.0 ± 0.7 s−1). This is followed by an opposing increase in fluorescence, corresponding to the formation of the highly fluorescent C(4a)–hydroxy–FAD intermediate as a product of the epoxidation reaction. The observed rate constant for this step (49.7 ± 0.3 s−1) is indistinguishable from the hydride transfer reduction reaction. This implies that the net rate constant for the subsequent FAD–transfer, peroxide formation, and styrene epoxidation reactions must be faster than, and are therefore limited by, the rate constant for the hydride–transfer step.
Figure 5.
Coupled FAD–reduction and styrene epoxidation reactions monitored by fluorescence. 10 μM SMOB and 10 μM NSMOA were reacted with 35 μM NADH and 250 μM styrene at 15 °C. Fluorescence was excited at 382 nm and emission monitored at 520 nm (red); the same reaction was also monitored by absorbance at 450 nm (blue). The increase in fluorescence corresponding to FAD C(4a)-hydroxide formation was fit with a rate constant of 49.7 ± 0.25 s−1, while the decrease in absorbance at 450 nm corresponding to FAD reduction was fit with a rate constant of 50.02 ± 1.72 s−1.
Electron–Transfer from SMOB–FADhq to Cytochrome c
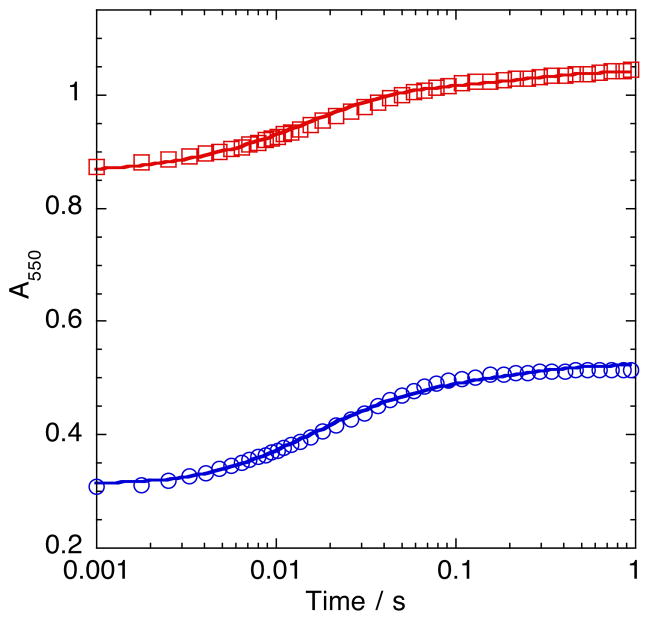
Single–turnover studies were conducted to evaluate the potential of pyridine nucleotides to gate the kinetics of FADhq dissociation from SMOB–FADhq and the subsequent cytochrome c reduction reaction (Figure 6). In the reaction of SMOB–FADox with NADH and cytochrome c, the kinetics of electron transfer were observed to be monophasic, independent of NADH concentration and limited by the hydride–transfer rate constant (50 s−1). When an NADH– SMOB–FADhq complex is prepared by titrating SMOB–FADox with molar excess NADH and then rapidly mixing with oxidized cytochrome c in the stopped–flow, the cytochrome c reduction kinetics remain monophasic, but proceed more slowly, with an observed rate constant of 30 s−1. The inset in Figure 6 shows the reaction of the NAD+–SMOB–FADhq pyridine nucleotide complex prepared by first titrating an anaerobic solution of SMOB–FADox and 3 mM NAD+ with dithionite and then rapidly mixing in the stopped–flow with oxidized cytochrome c and 3 mM NAD+. This reaction also proceeds with monophasic exponential kinetics, but more slowly, with an observed rate constant of 13.6 s−1.
Figure 6.
Electron-Transfer from SMOB-Pyridine Nucleotide Complexes to Cytochrome c. Reactions shown were initiated by rapid mixing in the stopped-flow. Curves passing through the data represent the best exponential fits through the absorbance data recorded at 550 nm. Reactions of 25 μM reduced SMOB-NADH complex prepared by anaerobic titration of 70 μM NADH with 30 μM oxidized cytochrome c (blue) and 18 μM oxidized SMOB with 400 μM NADH and 30 μM cytochrome c (red) were fit with monoexponential (k = 30 s−1) and biexponential (k1, k2 ~50 s−1). Inset shows the best monoexponential fit through data from the reaction of 5 μM oxidized cytochrome c with 25 μM reduced SMOB-NAD+ complex prepared by anaerobic titration with stoichiometric dithionite and 3 mM NAD+ (k = 13.6 s−1).
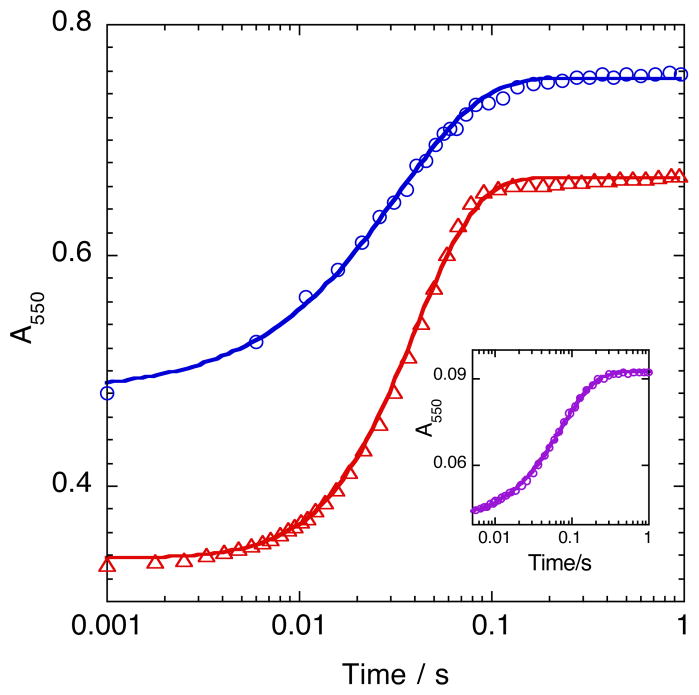
When SMOB–FADhq prepared by titration with dithionite is reacted with cytochrome c, the kinetics are best fit using a biphasic exponential function (k1 = 46.3 ± 3s−1, k2 = 6.2 ± 3.1 s−1) (Figure 7). The kinetics were observed to be independent of concentration over the investigated experimental range of cytochrome c concentration (10–85 μM). Simulations of the cytochrome c reduction reaction by SMOB–FADhq suggest that only submicromolar amounts of semiquinone accumulate during the reaction (Figures S3 and S4). This is in agreement with our observations of cytochrome c reduction in which no spectral features common to semiquinone formation (e.g. broad bands at 600–650 nm) are observed during the reduction reaction.33
Figure 7.
Electron-Transfer from Dithionite-Reduced SMOB to Cytochrome c. Reaction of 13 μM SMOB (prepared by reduction with dithionite) with 22.8 μM (blue) and 84.5 μM (red) cytochrome c. The best biexponential fits through these data give k1 = 46.3 ± 3.0 s−1 and k2 = 6.2 ± 3.1 s−1. Traces passing through the data represent the results of numerical integration of the model described text and Figure S4.
Competition Between NSMOA and Cytochrome c for FADhq
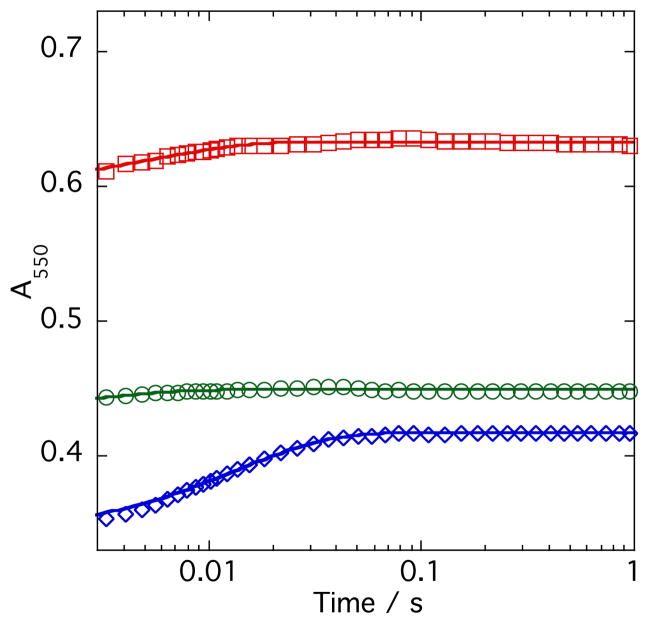
A series of experiments comparing the kinetics and extent of reduction of oxidized cytochrome c by free FADhq and SMOB–FADhq in the presence of apoNSMOA were undertaken to evaluate the mechanism FADhq transport to the active site of NSMOA (Figure 8). The best single–exponential fit through the 550 nm absorbance data corresponding to the reduction of cytochrome c by FADhq released from SMOB–FADhq indicates a reduction rate constant of ~72 s−1. By allowing the final absorbance value of 550 nm of this amount of cytochrome c with an excess of FADhq to represent 100% reduction, the extent of the reduction reaction when FADhq is delivered by SMOB was computed to be 44%. Although the kinetics of the reaction of free reduced FADhq with cytochrome c in the presence of apoNSMOA are too rapid to measure accurately in the stopped–flow, the extent of this reaction was computed to be 49.7%. The program Berkeley Madonna was used to model these data and to estimate the value of the second order rate constant for the binding of FADhq to NSMOA (Figure S3).
Figure 8.
Competition of NSMOA and Cytochrome c for Free and SMOB-Bound Forms of Reduced FAD. Comparison of the reaction kinetics of 25 μM SMOB-FADhq with 30 μM cytochrome c (blue) or 25 μM FADhq with 30 μM oxidized cytochrome c in the presence (green), or absence (red) of 30 μM NSMOA.
Crystal Structure of SMOB
SMOB is a homodimeric protein with a two–fold center of symmetry in which one active site lies on each face of the molecule (Figure 9). The overall fold is similar to other flavin reductase family members, such as PheA2 (1RZ1), which has an r.m.s.d. between all Cα atoms of 0.61 Å2, respectively. Electron density for residues 1–13 of the N–terminus are not seen in any of the 12 monomeric units found in the asymmetric unit. Given the position of the first observable residue on the N–terminus, these residues likely reside near the FAD/NADH binding pocket. For some (but not all) monomers, the electron density corresponding to the loops at positions 38–41, 102–107, and 153–156 is weak, suggesting both disorder and greater flexibility in these regions.
Figure 9.
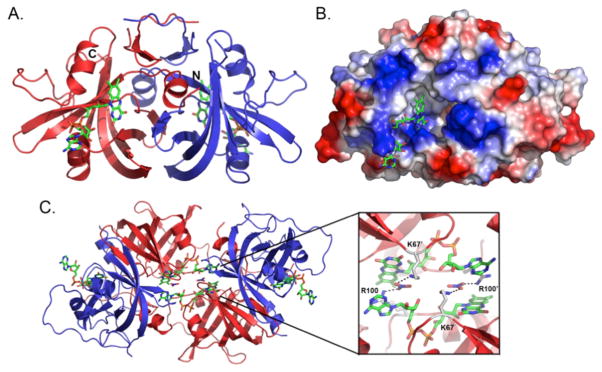
Ribbon structure (A) and electrostatic surface map (B) of the SMOB dimer depicting the FAD cofactor–binding site. FAD is colored by atom type, where green is carbon, red is oxygen, blue is nitrogen, and orange is phosphate. (C) Packing interactions between SMOB dimers depicting swapped-cofactor interactions and salt bridges between R100, NO3− and K67.
As a result of crystal packing, each SMOB monomer participates and shares in the binding of two molecules of FAD at unique sites on the same face of the protein (Figure 9). The isoalloxazine ring occupies the cofactor–binding site of one molecule, while the adenine and ribose rings of the same FAD occupy the active site of an adjacent SMOB subunit belonging to a different molecule. The swapped cofactor interactions and protein–protein packing are further stabilized by a nitrate ion, which binds between the adenine and isoalloxazine rings and acts as an electrostatic cross–linker bridging Arg 100 in one protein subunit and Lys 67 in the other (Figure 9).
Comparisons between SMOB and PheA2, the closest homolog for which a structure is known (39% identity), indicate the FAD cofactor binds differently in these structures (Figure 10). In PheA2, the adenosine, ribose, and phosphate groups of FAD interact with a small cleft on the side of each subunit that is formed by a loop corresponding to residues 84–92, which are analogous to 94–102 in SMOB. In SMOB, this loop adopts a more open conformation and is generally more disordered, as judged by weaker electron density and higher temperature factors (32.4 Å2 for the loop vs. 16.0 Å2 for the overall structure excluding water molecules). The residues in this region of the protein are not well conserved among homologous flavin reductases (Figure 10, Figure S5). Given the high structural similarity between SMOB and PheA2, however, it is possible that under physiological conditions FAD binds to SMOB in a configuration similar to the one observed in PheA2.
Figure 10.
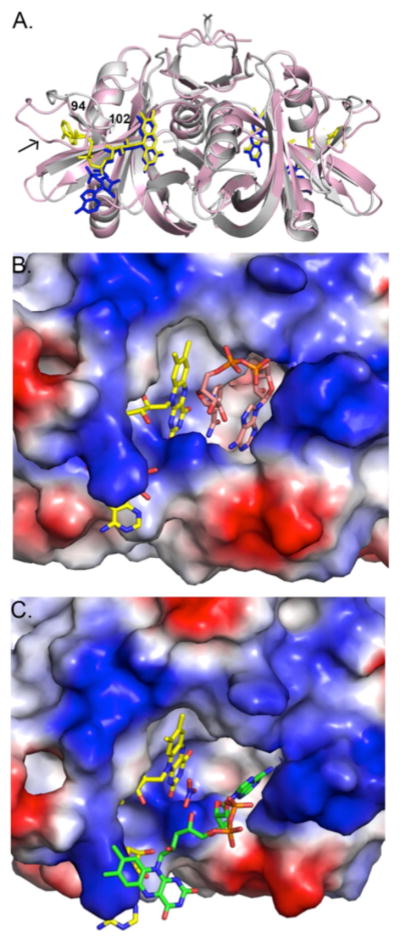
Comparison of SMOB and PheA2 crystal structures. (A) Overlap of SMOB (pink) and PheA2 (gray) depicting differences in FAD binding and orientation of residues on SMOB loop 94–102 (arrow). The SMOB and PheA2 FAD cofactors are depicted as blue and yellow sticks, respectively. (B) Model for NADH binding to SMOB at the substrate–binding site. Atoms are colored by type as described in Figure 9, except that FAD and NAD+ carbons are colored yellow and pink, respectively. An electrostatic surface of the cofactor and substrate binding sites is depicted, where blue and red represent regions of positive and negative charge, respectively. (C) FAD (green) from a neighboring SMOB molecule in the unit cell binding at the substrate site in the SMOB structure. Surfaces and atom types are depicted as in 2B.
The NADH binding site lies adjacent to the FAD cofactor–binding site. The adenine and ribose rings of the swapped FAD are bound such that the adenine C6–amine is oriented toward the core of the protein. In the NADH–soaked PheA2 (1RZ1) structure, the adenine ring of NAD+ binds at a similar position, albeit in a different configuration such that the C6 amine faces toward the surface and N3 orients toward the center of the protein. This orientation is accommodated because the nicotinamide ring rotates to occupy the space between the adenine and isoalloxazine rings such that the aromatic rings π stack. In SMOB, nitrate occupies the same position as the NAD+ nicotinamide group in PheA2.
Discussion
Redox–Linked FAD–Binding Equilibria Drive FAD–Exchange in SMO
Efficient catalysis by SMO is facilitated by a set of FAD–binding equilibria that are well tuned for flavin–exchange between the reductase and epoxidase components (Scheme 1). NSMOA has a five–fold higher affinity for reduced FAD than does SMOB, and this allows for a concerted vectoral delivery of reduced FAD from SMOB to NSMOA. Likewise, SMOB has a ten–fold higher affinity for oxidized FAD than does NSMOA, and this allows for the efficient return of FAD to SMOB during catalysis.26
Steady–state kinetic studies conducted at with enzyme concentrations in the sub-micromolar range suggest that at low FAD concentrations, apoSMOB reacts in a sequential ordered mechanism with NADH as the leading substrate.24,26 In the present work we were unable to complete single– turnover studies monitoring reactions of apoSMOB or the SMOB-NADH complex with FADox due to the tendency of these forms of SMOB to aggregate when prepared in the tens of micromolar range required for stopped flow studies. We speculate that NADH binding further assists in recycling oxidized FAD back from NSMOA to the active site of SMOB. We find that NADH binds rapidly to SMOB–FADox and forms the CT–1 charge–transfer intermediate in the dead–time of the stopped–flow instrument, followed by a much slower hydride–transfer reaction (Figure 3; Scheme 2). The kinetics of CT–1 formation when NADH functions as the leading substrate are expected to be similarly rapid compared to the subsequent kinetics of hydride–transfer.
Scheme 2.
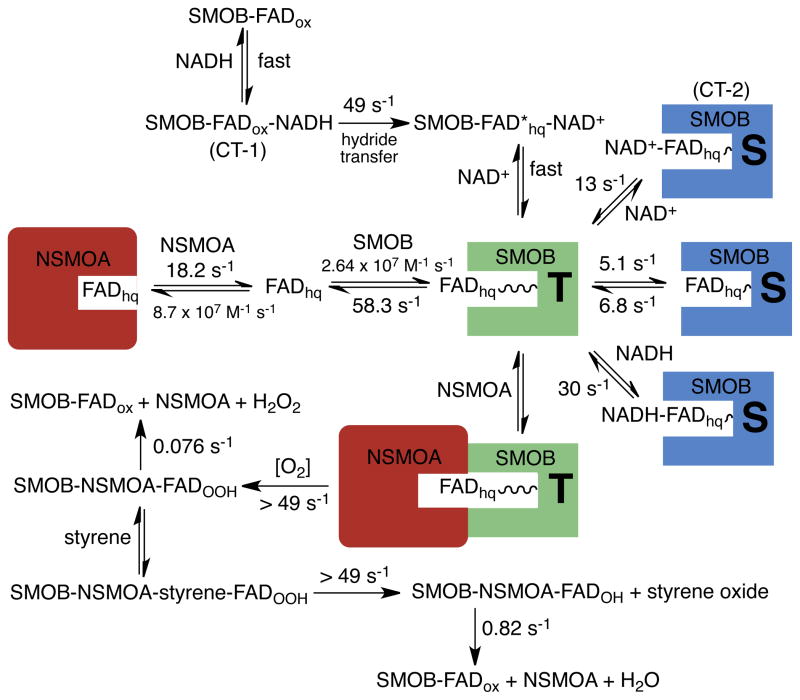
Proposed model of experimental results from electron–transfer, FAD–transfer, and oxygen reactions of SMO. In the reductive half reaction of SMOB, CT–1 forms rapidly in the dead–time of the instrument. Following hydride transfer (49s−1), NAD+ rapidly dissociates to generate the T-state of SMOB. In NADH catalyzed reactions, styrene epoxidation is rate-limited by the kinetics of the preceding hydride transfer reaction that yields the T-state intermediate. FADhq dissociates from the T-state of SMOB-FADhq at ~58 s−1. A second, slower kinetic phase is thought to be limited by the rate constant for the conversion of the S-state to T-state (~6.8 s−1). Pyridine nucleotide complexes of SMOB-FADhq prepared by equilibrium titration are gated by the dissociation of NAD+ (13 s−1) or NADH (30 s−1) in steps that are coupled to S- to T-state isomerization.
Interaction of SMOB with NSMOA
In the single–turnover reaction of SMOB with NADH, no detectable NAD+→FADH− charge–transfer intermediate (CT–2) accumulates (Figure 3A). This indicates that the hydride– transfer reaction from NADH to FADox is followed by the rapid dissociation of NAD+. Essentially identical reduction kinetics are observed in the presence of NSMOA (Figure 5) or cytochrome c (Figure 6), which suggests that NSMOA does not interact significantly with SMOB in the reductive half reaction (Scheme 2).
NSMOA competes effectively with cytochrome c for FADhq. supplied by SMOB. Once sequestered in the active site of NSMOA, FADhq reacts with oxygen to form a stable C(4a)–hydroperoxide intermediate22,26. The FAD–peroxide intermediate of NSMOA not only poises the SMO system to react with styrene, but also acts as a molecular chaperone to maintain SMOB in an active, folded state, while it awaits the return of FADox from NSMOA (Figure S2). In this state FAD is unavailable to react further with SMOB and the FAD reduction reaction is effectively stalled as the steady state rate of NADH oxidation becomes limited by the slow kinetics of hydrogen peroxide elimination from NSMOA-FADOOH. This mode of catalysis is closely aligned with that reported for the two–component system involved in actinorhodin biosynthesis, and is quite different from that reported for phenol hydroxylase, in which the flavin reduced by hydride–transfer provides electrons to a second flavin, which subsequently migrates to the active site of phenol hydroxylase.20,39
The fluorescent C(4a)–hydoxyFAD product of the NADH–catalyzed epoxidation reaction of the SMO forms with an observed rate constant of ~50 s−1. This implies that the kinetics of the epoxidation reaction are rate-limited by the proceeding kinetics of the reduction reaction. In the absence of SMOB, NSMOA–FADOOH reacts with styrene at 15 °C and pH 7 to form styrene oxide at only 30 s−1.22 The increase in the observed rate constant of the oxygen reaction in the presence of SMOB to a value limited by the hydride transfer reaction (Figure 5) suggests that interaction of SMOB with NSMOA may be responsible for accelerating the kinetics of the styrene epoxidation reaction, and thus may help explain the observation that the reaction efficiency is higher than that of a purely diffusive mechanism. These reactions, excepting the previously reported kinetics of NSMOA–FADhq reacting with oxygen and styrene22, are given in Scheme 2.
By modeling the kinetics of the competitive, parallel reactions of rapid electron–transfer from FADhq to cytochrome c and FADhq–binding to the active site of NSMOA, we find that only 50% of the total available oxidized cytochrome c is reduced. This indicates that apoNSMOA is highly competitive with cytochrome c for free reduced FAD. By modeling these reactions, we were able to compute an estimate of the second order rate constant for FADhq–binding to NSMOA to be 8.7 × 10⁷ M−1s−1, a value that is near the diffusion limit and fully consistent with the kinetics of turnover (Figure S3). This second–order rate constant may be used, together with the dissociation equilibrium constant of reduced FAD from NSMOA–FADhq (Kd = 210 nM), to compute an estimate of dissociation rate constant of the FADhq (k ~ 18.2 s−1) (Scheme 2).
In studies of the efficiency of flavin–transport from SMOB–FADhq to NSMOA in the presence of oxidized cytochrome c, the extent of cytochrome c reduction is 6% lower than that observed in the reaction of cytochrome c with the same concentration of free FADhq in the presence of NSMOA (Figure 8). This suggests that the complex formed between the reductase and epoxidase limits access of cytochrome c to the reduced FADhq.
Sequestered and Transfer States of FAD in SMO Catalysis
In the absence of NSMOA, the cytochrome c is reduced completely in a reaction that occurs with biphasic kinetics (Figure 7). This switch from a rapid monophasic reduction reaction in the presence of NSMOA to a slower biphasic reaction in the absence of NSMOA suggests that protein–protein interaction between NSMOA and SMOB may help to reposition the reductase–bound FAD from a less reactive, sequestered state (S–state) into an exposed configuration (T–state) that allows for facile flavin–dissociation and electron–transfer reactions (Scheme 2).
When pyridine nucleotide complexes prepared by equilibrium–titration of SMOB–FADhq with NAD+ or NADH are reacted with cytochrome c, the reduction reactions are monophasic (Figure 6). In these reactions, FADhq can be modeled as being bound in a sequestered (S–state) pyridine nucleotide complex, such that access to the bound–FADhq is gated by the dissociation kinetics of the bound pyridine nucleotide (Scheme 2). Pi–stacking of the isoalloxazine, nicotinamide, and adenosine rings may contribute to S–state stabilization. Movement of the flavin into the T–state may be mechanistically driven by breaking the pi–stacking interaction when NAD+ dissociates. The rapid monophasic kinetics observed in both the cytochrome c reduction and the styrene epoxidation reactions are consistent with a model in which the dissociation of NAD+ after hydride–transfer is coupled to the rapid accumulation of the T–state intermediate followed by slower equilibration between the T-state and S-state configurations of FADhq (Scheme 2).
When SMOB–FADhq prepared by titration with dithionite is reacted with cytochrome c, the kinetics of cytochrome c reduction are biphasic (Figure 7). The observed kinetics could represent either parallel or sequential electron transfer reactions to cytochrome c. However, in considering the observed gating mechanism of bound pyridine nucleotides in the reductive half reaction, we favor the sequential model as presented in Scheme 2. In this model, the SMOB-bound fraction of FADhq equilibrates in the absence of pyridine nucleotides between sequestered (S-state) and exposed (T-state) configurations similar to those occurring after the pyridine nucleotide-gated reduction reaction. We propose that the rapid initial phase of the cytochrome c reduction reaction is rate-limited by the kinetics FADhq dissociation from the T-state configuration, and that the second reaction phase is rate-limited by the slower kinetics of isomerization of FADhq from the S-state configuration to the T-state configuration. Rate constants provided in Scheme 2 were estimated by numerical simulation (Figure 7; Figure S4).
Structural Insight into the Mechanism of FAD Interaction
In the crystal structure of the SMOB dimer, the isoalloxazine ring system of the bound FAD is positioned in the active site of each symmetry–related monomer in a configuration similar to that previously observed in the structures of the PheA2 and 4–hydroxyphenylacetate–3–monoxygenases31,40 (Figure 10). We consider this type of structure with the sequestered isoalloxazine to be a good working model for the S–state of the FAD detected in our kinetic studies (Scheme 2).
The symmetry–related SMOB dimers in the crystallographic unit cell are juxtaposed with their active sites in close proximity and facing each other. Inter–dimer crystal packing interactions occur between the adenosine moiety of each bound FAD and amino acid side chains of the symmetry related, juxtaposed dimer (Figure 9C). These contacts, together with additional interactions of the FAD with bound nitrate ions, contribute to the unique adenosine ring orientation observed in the structure of SMOB. With due regard to the bias that these interactions may impose, it is interesting to consider how flavin binding modes similar to those observed in the SMOB structure could be mechanistically relevant.
An outstanding feature of the SMO system is how the epoxidase is FAD–specific, while the reductase is able to react with riboflavin, FMN, or FAD with very little substrate specificity24,26. In light of these interactions, it was previously hypothesized that a reduced FAD–transfer complex could involve an FAD–bridged structure of SMO in which the AMP moiety of FAD interacts with NSMOA and the reduced isoalloxazine moiety of the FAD interacts with SMOB26. It is interesting to review this idea in light of the new data presented here. In accordance with the originally proposed mode for FAD transfer26, the adenosine ring system in the SMOB structure is quite solvent accessible (Figure 10A). This would potentially allow NSMOA access to interact with the adenosine of the FAD while the reduced isoalloxazine ring system remains bound to SMOB. It is further possible that during catalysis, transfer of reduced FAD to NSMOA is coordinated with the return of oxidized FAD to SMOB following elimination of water from the C(4a)–hydroxyFAD intermediate.
An alternate interpretation is that the structure of SMOB shown in Figure 10C with the isoalloxazine ring system extending away from the reductase dimer may be similar to the kinetically modeled T–state configuration of SMOB–bound FAD (Scheme 2). Our studies of the reductive half reaction indicate that formation of the T–state is coupled to the dissociation of NAD+ and increased accessibility of FADhq to both NSMOA and cytochrome c. Both of these experimental observations are consistent with this structure. The adenosine ring system of the FAD occupies a significant fraction of the pyridine nucleotide–binding site, which we expect to be vacant following the rapid dissociation of NAD+ following hydride–transfer reaction. This orientation further positions the isoalloxazine ring system so that it can extend away from SMOB in a way that may facilitate interaction with and transfer into the FAD–binding pocket of NSMOA 23.
Using the structures of SMOB and NSMOA, transient SMOB–NSMOA complexes were modeled to investigate potential configurations that would allow for protected FADhq transfer. The SMOB electrostatic surface at the cofactor and substrate binding pockets is relatively positive. Similar calculations of the NSMOA surface also show regions of positive charge. At first glance, one would think that this precludes direct interaction between SMOB and NSMOA; the SMOB crystal packing, however, indicates that such an interaction may be possible as long as the substrate and its negatively charged phosphates can be presented to NSMOA. As an additional consideration, the 11 N–terminal amino acids of SMOB, which were disordered in the structure but seem to localize near the FAD and NADH binding site based on the position of the first observable residue, may also participate in facilitating the stabilization of this complex.
Further structural data will be needed to more definitively resolve the configuration of the FAD involved in the FAD–transfer and other complexes formed by SMOB and NSMOA in the styrene epoxidation reaction.
Supplementary Material
Acknowledgments
George Gassner and Eliot Morrison thank Dirk Tischler, Willem van Berkel and Ardie Westphal for providing helpful insight and discussions.
Abbreviations Used
- DTT
dithiothreitol
- FAD
flavin adenine dinucleotide
- FADox
oxidized flavin adenine dinucleotide
- FADhq
reduced flavin adenine dinucleotide hydroquinone
- MOPSO
3-(N-morpholino)-2-hydorxy-1-propanesulfonic acid
- NSMOA
N–terminal His6–tagged styrene monooxygenase oxygenase
- PMSF
phenylmethylsulfonyl fluoride
- SMO
styrene monooxygenase
- SMOB
styrene monooxygenase reductase
- SMOB–FADox
styrene monooxygenase reductase with bound FADox
- SMOB–FADhq
styrene monooxygenase reductase with bound FADhq
- Tris
2-Amino-2-hydroxymethyl-propane-1,3-diol
Footnotes
This work was supported by NIHSC1 GM081140 to George Gassner and Camille and Henry Dreyfus startup award to Matthew Sazinsky. Eliot Morison was supported by an ARCS scholarship.
The supplemental figures show: Figure S1: Spectra of Oxidized and Reduced SMOB and NADH; Figure S2: Stability of apoSMOB in the presence and absence of the NSMOA FAD C(4a)–hydroperoxide intermediate; Figure S3: Estimation of the Second–Order Rate Constant for the Reaction of NSMOA with Reduced FAD; Figure S4: Modeling Electron–Transfer from SMOB to cytochrome c; Figure S5: Sequence alignment of bacterial flavin reductases from multicomponent systems. Supplemental materials may be accessed free of charge online at http://pubs.acs.org.
References
- 1.Paca J, Halecky M, Vanek T, Kozliak E, Jones K. Removal of saturated aliphatic hydrocarbons (gasoline components) from air via bacterial biofiltration. J Environ Sci Health A Tox Hazard Subst Environ Eng. 2010;45:1037–1047. doi: 10.1080/10934529.2010.486313. [DOI] [PubMed] [Google Scholar]
- 2.Pagot Y, Belin JM, Husson F, Spinnler HE. Metabolism of phenylalanine and biosynthesis of styrene in Penicillium camemberti. J Dairy Res. 2007;74:180–185. doi: 10.1017/S0022029906002251. [DOI] [PubMed] [Google Scholar]
- 3.White WC. Butadiene production process overview. Chemico-–Biological Interactions. 2007;166:10–14. doi: 10.1016/j.cbi.2007.01.009. [DOI] [PubMed] [Google Scholar]
- 4.Fujita EM, Campbell DE, Zielinska B, Arnott WP, Chow JC. Concentrations of air toxics in motor vehicle-–dominated environments. Res Rep Health Eff Inst. 2011:3–77. [PubMed] [Google Scholar]
- 5.Lee S, Yoon J, Kim J, Park D. Degradation of polystyrene using clinoptilolite catalysts. J Anal, Appl Pyrol. 2002;64:71–83. [Google Scholar]
- 6.Dare E, Tofighi R, Nutt L, Vettori MV, Emgard M, Mutti A, Ceccatelli S. Styrene 7,8-–oxide induces mitochondrial damage and oxidative stress in neurons. Toxicol. 2004;201:125–132. doi: 10.1016/j.tox.2004.04.010. [DOI] [PubMed] [Google Scholar]
- 7.Final Report on Carcinogens Background Document for Styrene. Rep Carcinog Backgr. 2008 Doc i–398. [PubMed] [Google Scholar]
- 8.Jagr M, Mraz J, Linhart I, Stransky V, Pospisil M. Synthesis and characterization of styrene oxide adducts with cysteine, histidine, and lysine in human globin. Chem Res Toxicol. 2007;20:1442–1452. doi: 10.1021/tx700057t. [DOI] [PubMed] [Google Scholar]
- 9.Koskinen M, Calebiro D, Hemminki K. Styrene oxide-induced 2′-deoxycytidine adducts: implications for the mutagenicity of styrene oxide. Chemico-Biological Interactions. 2000;126:201–213. doi: 10.1016/s0009-2797(00)00165-4. [DOI] [PubMed] [Google Scholar]
- 10.Vogie K, Mantick N, Carlson G. Metabolism and toxicity of the styrene metabolite 4-vinylphenol in CYP2E1 knockout mice. J Toxicol Environ Health A. 2004;67:145152. doi: 10.1080/15287390490264785. [DOI] [PubMed] [Google Scholar]
- 11.Ramos JL, Duque E, Gallegos MT, Godoy P, Ramos-Gonzalez MI, Rojas A, Teran W, Segura A. Mechanisms of solvent tolerance in gram-negative bacteria. Annu Rev Microbiol. 2002;56:743–768. doi: 10.1146/annurev.micro.56.012302.161038. [DOI] [PubMed] [Google Scholar]
- 12.Hartmans S, van der Werf MJ, de Bont JA. Bacterial degradation of styrene involving a novel flavin adenine dinucleotide-dependent styrene monooxygenase. Appl Environ Microbiol. 1990;56:1347–1351. doi: 10.1128/aem.56.5.1347-1351.1990. [DOI] [PMC free article] [PubMed] [Google Scholar]
- 13.Cox HH, Faber BW, Van Heiningen WN, Radhoe H, Doddema HJ, Harder W. Styrene metabolism in Exophiala jeanselmei and involvement of a cytochrome P-450-dependent styrene monooxygenase. Appl Environ Microbiol. 1996;62:1471–1474. doi: 10.1128/aem.62.4.1471-1474.1996. [DOI] [PMC free article] [PubMed] [Google Scholar]
- 14.Tischler D, Eulberg D, Lakner S, Kaschabek SR, van Berkel WJH, Schlomann M. Identification of a Novel Self-Sufficient Styrene Monooxygenase from Rhodococcus opacus 1CP. J Bacteriol. 2009;191:4996–5009. doi: 10.1128/JB.00307-09. [DOI] [PMC free article] [PubMed] [Google Scholar]
- 15.van Berkel WJH, Kamerbeek NM, Fraaije MW. Flavoprotein monooxygenases, a diverse class of oxidative biocatalysts. J Biotech. 2006;124:670689. doi: 10.1016/j.jbiotec.2006.03.044. [DOI] [PubMed] [Google Scholar]
- 16.Montersino S, Tischler D, Gassner GT, van Berkel WJH. Catalytic and Structural Features of Flavoprotein Hydroxylases and Epoxidases. Adv Syn Catal. 2011;353:2301–2319. [Google Scholar]
- 17.Massey V. Activation of molecular oxygen by flavins and flavoproteins. J Biol Chem. 1994;269:22459–22462. [PubMed] [Google Scholar]
- 18.Ellis HR. The FMN-dependent two-component monooxygenase systems. Arch Biochem Biophys. 2011;497:1–12. doi: 10.1016/j.abb.2010.02.007. [DOI] [PubMed] [Google Scholar]
- 19.Sucharitakul J, Phongsak T, Entsch B, Svasti J, Chaiyen P, Ballou DP. Kinetics of a Two-Component p-Hydroxyphenylacetate Hydroxylase Explain How Reduced Flavin Is Transferred from the Reductase to the Oxygenase. Biochemistry. 2007;46:8611–8623. doi: 10.1021/bi7006614. [DOI] [PubMed] [Google Scholar]
- 20.Valton J, Mathevon C, Fontecave M, Nivière V, Ballou DP. Mechanism and regulation of the Two-component FMN-dependent monooxygenase ActVA-ActVB from Streptomyces coelicolor. J Biol Chem. 2008;283:10287–10296. doi: 10.1074/jbc.M709730200. [DOI] [PMC free article] [PubMed] [Google Scholar]
- 21.Valton J, Filisetti L, Fontecave M, Nivière V. A two-component flavin-dependent monooxygenase involved in actinorhodin biosynthesis in Streptomyces coelicolor. J Biol Chem. 2004;279:44362–44369. doi: 10.1074/jbc.M407722200. [DOI] [PubMed] [Google Scholar]
- 22.Kantz A, Gassner GT. Nature of the Reaction Intermediates in the Flavin Adenine Dinucleotide-Dependent Epoxidation Mechanism of Styrene Monooxygenase. Biochemistry. 2011;50:523–532. doi: 10.1021/bi101328r. [DOI] [PMC free article] [PubMed] [Google Scholar]
- 23.Ukaegbu UE, Kantz A, Beaton M, Gassner GT, Rosenzweig AC. Structure and Ligand Binding Properties of the Epoxidase Component of Styrene Monooxygenase. Biochemistry. 2010;49:1678–1688. doi: 10.1021/bi901693u. [DOI] [PMC free article] [PubMed] [Google Scholar]
- 24.Otto K, Hofstetter K, Rothlisberger M, Witholt B, Schmid A. Biochemical Characterization of StyAB from Pseudomonas sp. Strain VLB120 as a Two-Component Flavin-Diffusible Monooxygenase. J Bacteriol. 2004;186:5292–5302. doi: 10.1128/JB.186.16.5292-5302.2004. [DOI] [PMC free article] [PubMed] [Google Scholar]
- 25.Louie TM, Xie XS, Xun L. Coordinated Production and Utilization of FADH2 by NAD(P)H-Flavin Oxidoreductase and 4-Hydroxyphenylacetate 3-Monooxygenase. Biochemistry. 2003;42:7509–7517. doi: 10.1021/bi034092r. [DOI] [PubMed] [Google Scholar]
- 26.Kantz A, Chin F, Nallamothu N, Nguyen T, Gassner GT. Mechanism of flavin transfer and oxygen activation by the two-component flavoenzyme styrene monooxygenase. Arch of Biochem and Biophys. 2005;442:102–116. doi: 10.1016/j.abb.2005.07.020. [DOI] [PubMed] [Google Scholar]
- 27.Hollmann F, Lin PC, Witholt B, Schmid A. Stereospecific biocatalytic epoxidation: the first example of direct regeneration of a FAD-dependent monooxygenase for catalysis. J Am Chem Soc. 2003;125:8209–8217. doi: 10.1021/ja034119u. [DOI] [PubMed] [Google Scholar]
- 28.Hollmann F, Hofstetter K, Habicher T, Hauer B, Schmid A. Direct electrochemical regeneration of monooxygenase subunits for biocatalytic asymmetric epoxidation. J Am Chem Soc. 2005;127:6540–6541. doi: 10.1021/ja050997b. [DOI] [PubMed] [Google Scholar]
- 29.Galan B, Diaz E, Prieto MA, Garcia JL. Functional analysis of the small component of the 4-hydroxyphenylacetate 3-monooxygenase of Escherichia coli W: a prototype of a new Flavin:NAD(P)H reductase subfamily. J Bacteriol. 2000;182:627–636. doi: 10.1128/jb.182.3.627-636.2000. [DOI] [PMC free article] [PubMed] [Google Scholar]
- 30.van den Heuvel RH, Westphal AH, Heck AJ, Walsh MA, Rovida S, van Berkel WJ, Mattevi A. Structural studies on flavin reductase PheA2 reveal binding of NAD in an unusual folded conformation and support novel mechanism of action. The J Biol Chem. 2004;279:12860–12867. doi: 10.1074/jbc.M313765200. [DOI] [PubMed] [Google Scholar]
- 31.Kim SH, Hisano T, Iwasaki W, Ebihara A, Miki K. Crystal structure of the flavin reductase component (HpaC) of 4-hydroxyphenylacetate 3-monooxygenase from Thermus thermophilus HB8: Structural basis for the flavin affinity. Proteins. 2007;70:718–730. doi: 10.1002/prot.21534. [DOI] [PubMed] [Google Scholar]
- 32.Lambeth JD, Lancaster JR, Kamin H. Steroidogenic electron transport by adrenodoxin reductase and adrenodoxin. Use of acetylated cytochrome c as a mechanistic probe of electron transfer. J of Biol Chem. 1981;256:3674–3678. [PubMed] [Google Scholar]
- 33.Mizzer JP, Thorpe C. Stabilization of the red semiquinone form of pig kidney general acyl-CoA dehydrogenase by acyl coenzyme A derivatives. Biochemistry. 1981;20:4965–4970. doi: 10.1021/bi00520a024. [DOI] [PubMed] [Google Scholar]
- 34.Otwinowski Z, Minor W. In: Macromolecular Crystallography Part A. Charles W, Carter J, editors. Academic Press; 1997. pp. 307–326. [Google Scholar]
- 35.McCoy AJ, Grosse-Kunstleve RW, Adams PD, Winn MD, Storoni LC, Read RJ. Phaser crystallographic software. Journal of Applied Crystallography. 2007;40:658–674. doi: 10.1107/S0021889807021206. [DOI] [PMC free article] [PubMed] [Google Scholar]
- 36.Massey V, Ghisla S. Comparative Cardiology. Vol. 227. Annals of the New York Academy of Sciences; 1974. Role of Charge-Transfer Interactions in Flavoprotein Catalysis; p. 446465. [Google Scholar]
- 37.Ahmad I, Cusanovich MA, Tollin G. Laser flash photolysis studies of electron transfer between semiquinone and fully reduced free flavins and horse heart cytochrome c. Proc Natl Acad Sci USA. 1981;78:6724–6728. doi: 10.1073/pnas.78.11.6724. [DOI] [PMC free article] [PubMed] [Google Scholar]
- 38.Gao B, Ellis HR. Altered mechanism of the alkanesulfonate FMN reductase with the monooxygenase enzyme. Biochem and Biophys Res Comm. 2005;331:1137–1145. doi: 10.1016/j.bbrc.2005.04.033. [DOI] [PubMed] [Google Scholar]
- 39.Kirchner U, Westphal AH, Muller R, van Berkel WJ. Phenol hydroxylase from Bacillus thermoglucosidasius A7, a two-protein component monooxygenase with a dual role for FAD. J Biol Chem. 2003;278:47545–47553. doi: 10.1074/jbc.M307397200. [DOI] [PubMed] [Google Scholar]
- 40.van den Heuvel HHR, Westphal AH, Heck AJR, Walsh MA, Rovida S, van Berkel WJH, Mattevi A. Structural Studies on Flavin Reductase PheA2 Reveal Binding of FAD in an Unusual Folded Conformation and Support Novel Mechanism of of Action. J Biol Chem. 2004;279:12860–12867. doi: 10.1074/jbc.M313765200. [DOI] [PubMed] [Google Scholar]
Associated Data
This section collects any data citations, data availability statements, or supplementary materials included in this article.


