

Abstract
Background
Although essential tremor (ET) is among the most prevalent neurological diseases, its precise pathogenesis is not understood. Purkinje cell loss has been observed in some studies and is the focus of interest and debate. Expressing these data as Purkinje cells/layer length allows one to adjust for the inherent curved nature of the cerebellar folia. Capitalizing on the Essential Tremor Centralized Brain Repository, we quantified Purkinje cell linear density in cases vs. controls.
Methods
Free-floating, 100 μm, parasagittal cerebellar hemispheric sections were subjected to rabbit polyclonal anti-Calbindin D28k antibody, and 10 random fields/brain were selected for quantification of Purkinje cells/mm−1 Purkinje cell layer.
Results
Purkinje cell linear density was lower in 32 ET cases than 16 controls (1.14 ± 0.32 vs. 1.35 ± 0.31 per mm−1, p = 0.03). Purkinje cell linear density was inversely associated with torpedo count (r = −0.38, p = 0.028).
Discussion
The current sample of ET cases demonstrates a reduction in Purkinje cell number relative to that of controls. Greater Purkinje cell axonal remodeling (torpedoes) was found in individuals who had the most Purkinje cell drop out. The role of Purkinje cell loss in the pathogenesis of this disorder merits additional study.
Keywords: essential tremor, Purkinje cell, cerebellum, brain, pathology, pathophysiology, neurodegenerative
Introduction
Although essential tremor (ET) stands out as one of the most prevalent neurological diseases,1-4 its precise pathogenesis is not understood. Clinical and neuroimaging studies point to a central role of the cerebellum.5-10 In postmortem studies, an increasing number of structural changes have been observed in ET brains relative to age-matched control brains.11 These changes include greater numbers of Purkinje cell axonal and dendritic swellings,12-14 an increase in the numbers of heterotopically displaced Purkinje cells,15 structural remodeling of neighboring non-Purkinje cell neuron populations (i.e., basket cells),16 and, in some cases, more extensive structural changes within the deep cerebellar nuclei.17 Additionally, the loss of Purkinje cells in ET has been observed in some studies and is the focus of interest and debate.12, 18-20
With only one exception,18 data to date12, 19 have been reported as cell counts per microscopic field (e.g., 10 cells per 100x field). Yet field size can vary considerably across microscopes. Also, the Purkinje cells exist within a complex, convoluted layer of the tissue, which can result in a further lack of standardization across studies, and restrict the microscopist to linear segments. By contrast, expressing the data as cells per layer length (e.g., cells/mm or cells/um) provides greater latitude, allowing one to deal with the inherent curved nature of the cerebellar folia, and facilitating greater comparison across studies. Using this measure, and capitalizing on the Essential Tremor Centralized Brain Repository (ETCBR), a tissue resource which banks a large collection of ET brains,12, 21 we quantified Purkinje cell linear density in cerebellar hemispheric sections of ET cases vs. controls.
Methods
Cases and Controls
This study was conducted at the ETCBR, New York Brain Bank (NYBB), Columbia University Medical Center (CUMC). All ET cases were diagnosed by their treating neurologist and the ET diagnosis was confirmed using ETCBR criteria by a second neurologist specializing in movement disorders (E.D.L.).12 Control brains were normal elderly control subjects from the NYBB, derived from the Alzheimer's Disease Research Center and the Washington Heights Inwood Columbia Aging Project. They were free of clinical diagnoses of Alzheimer's disease (AD), ET, or Parkinson's disease (PD) and without neuropathological diagnoses of neurodegenerative disease.12 The NYBB operates under approval of the Institutional Review Board of CUMC.
In an earlier report18 we measured Purkinje cell linear density in a smaller sample of 8 ET cases and 11 controls, yet that report used 7 μm rather than the 100 μm cerebellar cortical sections that we now use. The thicker sections allow for greater visualization of the Purkinje cell layer, its dendritic arbor, and its axonal architecture. Twenty-seven (84.4%) of the currently-reported 32 ET cases and 13 (81.3%) of 16 controls were not included in earlier report; hence, they have been banked since 2008.
Data from our prior analyses18 indicated that 8 ET cases and 11 controls were sufficient to detect a 30% case-control difference. Data were available on 35 ET cases whose cerebellar cortical tissue was immunostained with calbindin. Controls were frequency-matched to cases using a 2:1 scheme, reflecting the greater availability of case tissue. We excluded 3 cases and 1 control with lifetime exposure to medications known to cause cerebellar damage (e.g., lithium, diphenylhydantoin, chemotherapeutic agents) or heavy ethanol use, as defined below, resulting in a final sample of 32 ET cases and 16 age-matched controls.
Clinical Evaluation
During life, demographic and clinical data were collected using a series of semi-structured questionnaires.12 Data on lifetime exposure to medications known to cause cerebellar damage (e.g., lithium, diphenylhydantoin, chemotherapeutic agents) were collected. Heavy ethanol use was defined previously as consumption of an average of four or more standard drinks (15 ml of absolute ethanol) per day for a man, or three or more per day for a woman, at any point in their lives.12, 22 Most ET cases also underwent a standardized, videotaped neurological examination, which included an assessment of postural tremor (sustained arm extension), five tests of kinetic tremor (pouring, drinking, using spoon, finger-nose-finger maneuver, and drawing spirals), and examination of head and voice tremors.23
Standard Neuropathological Assessment
As previously described, all brains underwent a complete neuropathological assessment by a senior neuropathologist (J.P.G.V.) at the NYBB.12 Each brain had a standardized measurement of brain weight (grams), postmortem interval (PMI, hours between death and placement of brain in a cold room or upon ice), Braak and Braak AD staging for neurofibrillary tangles,24, 25 Braak PD staging,26 and Consortium to Establish a Registry for AD (CERAD) ratings for neuritic plaques.27
Quantification of Postmortem Changes in Cerebellum
As described, a standard 3 × 20 × 25 mm parasagittal, formalin-fixed, tissue block was harvested from the neocerebellum;12, 28 the block included the cerebellar cortex, white matter and dentate nucleus. A senior neuropathologist, who was blinded to all clinical information, counted torpedoes throughout one entire LH&E section,28 and counted and averaged Purkinje cells in fifteen 100× fields (LH&E). As previously described,16 a semi-quantitative rating of the appearance of the basket cell plexus surrounding Purkinje cell bodies throughout Bielschowsky preparations was carried out by the same neuropathologist (P.L.F., see acknowledgements). The following scale was used: 0 (few, or no discernible processes); 1 (sparse number of processes); 2 (moderate number of processes); and 3 (dense tangle of processes). In some instances, the rater used intermediate values (0.5, 1.5, and 2.5).
Immunohistochemistry
Free-floating parasagittal sections (100 μm) of cerebellum were heated in 20 μg/mL Proteinase K (Roche Applied Science, Indianapolis, IN) in 10 μM Tris and 0.1 mM EDTA at pH 8, followed by 1% hydrogen peroxide in PBS and serum blocking solution (10% normal goat serum, 1% bovine serum albumin, 1% Triton, in PBS). Rabbit polyclonal Anti-Calbindin D28k (Swant, Marly, Switzerland) was applied overnight at 4°C. Secondary antibody (biotin-SP goat-anti-rabbit [Fisher Scientific, Waltham MA]), followed by Streptavidin-HRP for biotinylated antibodies (AbD Serotec, Raleigh, NC) was developed with DAB Chromogen Solution (Dako, Capinteria, CA).
Assessment of Purkinje Cell Linear Density
Three 100 μm standard sections per subject were used for analysis. Images were acquired using a Zeiss Axioplan 2 microscope with a 10× objective from all areas of the section that were well stained. Up to 50 images were taken from well stained areas of the tissue, preferentially avoiding sulci and gyri. Ten of these images were randomly selected using a random digit table, and the number of Purkinje cells (i.e., cell bodies) visible in each section was counted by a trained technician (R.B.) who was blinded to all clinical information and diagnoses. The Purkinje cell layer length was measured using Image J software (National Institutes of Health) by drawing a freehand line through the center of the cell bodies of cells in the layer. The number of Purkinje cells and the Purkinje cell layer length were summed from each of the 10 images. The number of Purkinje cells divided by the Purkinje cell layer length represented Purkinje cell linear density (i.e., Purkinje cells per mm−1 of Purkinje cell layer).
Statistical Analyses
Analyses were performed in SPSS (version 18.0). Clinical and postmortem findings were compared in cases and controls using Student's t tests, chi-square tests, and Fisher's exact tests. Correlations were Pearson's correlation coefficients (r). Non-parametric tests (Mann-Whitney test, Spearman's r) were also used when required. To further assess the distribution of Purkinje cell linear density in cases vs. controls, Purkinje cell linear density was also stratified into tertiles as well as quartiles.
Results
Purkinje cell linear density was quantified in 32 cases and 16 controls in the present study. Clinical characteristics of cases and controls are summarized in Table 1. Cases and controls were similar in age and gender. Both groups were also comparable with respect to brain weight, CERAD score and Braak AD stage (Table 1). Cases had a shorter PMI (Table 1). The number of torpedoes was higher (p = 0.001) and the number of Purkinje cells was lower (p = 0.007, Table 1) in cases vs. controls. The Basket cell axonal plexus density was higher in cases than controls (p = 0.007, Table 1). The Braak PD stage was 0 in all cases and controls.
Table 1.
Clinical Characteristics of ET Cases and Controls
| ET Cases N = 32 | Controls N = 16 | Significance | |
|---|---|---|---|
| Age (years) | 86.5 ± 6.1 | 87.4 ± 4.5 | p = 0.60A |
| Female gender | 23 (71.9) | 9 (56.3) | p = 0.28B |
| PMI (median hours) | 2.3 | 5.9 | p < 0.001C |
| Brain weight (grams) | 1218 ± 146 | 1192 ± 154 | p = 0.57A |
| CERAD plaque score* | p = 0.44D | ||
| 0, A, or B | 30 (93.8) | 9 (100) | |
| C | 2 (6.3) | 0 (0) | |
| Braak AD stage* | p = 0.59D | ||
| 0-4 | 28 (96.6) | 8 (100) | |
| 5 or 6 | 1 (3.4) | 0 (0) | |
| Torpedo count (LH&E) | Median = 12.0 | Median = 3.0 | p = 0.001C |
| Purkinje cell count (LH&E) | 6.6 ± 1.5 | 9.0 ± 2.9 | p = 0.007A |
| Basket cell axonal plexus density* | p = 0.007B | ||
| 0-1 | 10 (31.3) | 8 (88.9) | |
| 2 | 8 (25.0) | 1 (11.1) | |
| >2 | 14 (43.8) | 0 (0) | |
AD (Alzheimer's disease), CERAD (Consortium to Establish a Registry for AD), LH&E (Luxol Fast Blue counterstained with Hematoxylin and Eosin), PMI (Postmortem interval).
Unless specified otherwise, values are mean ± standard deviation or number (percentage).
Student's t test.
Chi-square test.
Mann-Whitney test.
Fisher's Exact Test.
Some subjects did not have available data.
The Purkinje cell linear density was on average 18% lower in ET cases than in controls (1.14 ± 0.32 vs. 1.35 ± 0.31 Purkinje cells per mm−1, t = 2.17, p = 0.03)(Figure 1, 2). To further assess the distribution of Purkinje cell linear density in cases vs. controls, Purkinje cell linear density was also stratified into tertiles as well as quartiles; ET cases and controls differed with respect to their distributions, with a higher percentage of ET cases in the lower tertiles/quartiles and a higher percentage of controls in the higher strata (for tertiles analysis, X2 = 10.91, p = 0.004; for quartiles analysis, X2 = 8.25, p = 0.04, Table 2).
Figure 1.
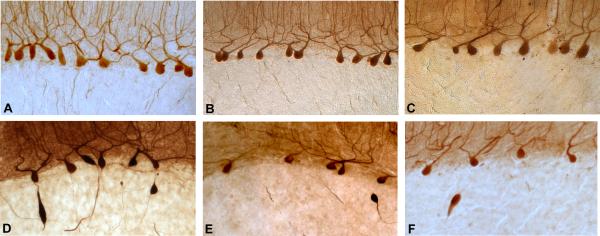
100 μm parasagittal cerebellar hemispheric sections were subjected to rabbit polyclonal anti-Calbindin D28k antibody. Three controls (A, B, C) and three ET cases (D, E, F). Purkinje cell linear density was 1.77 per mm−1 (A), 1.59 per mm−1 (B), 1.27 per mm−1 (C), 0.96 per mm−1 (D), 0.79 per mm−1 (E), 0.63 per mm−1 (F). Torpedoes are also evident in ET cases. Magnification 100×. The panels were chosen to represent a full range of linear density values, starting with a very high value (1.77 PC/mm−1) and then, at intervals of 0.20 – 0.30 PC/mm−1, arriving at a very low value (0.63 PC/mm−1). The width of the intervals was chosen to result in 6 panels (A – F). The three top panels are from controls and represent the values seen in 2/3 of controls. Similarly 2/3 of cases had values that were below the value shown in panel C.
Figure 2.
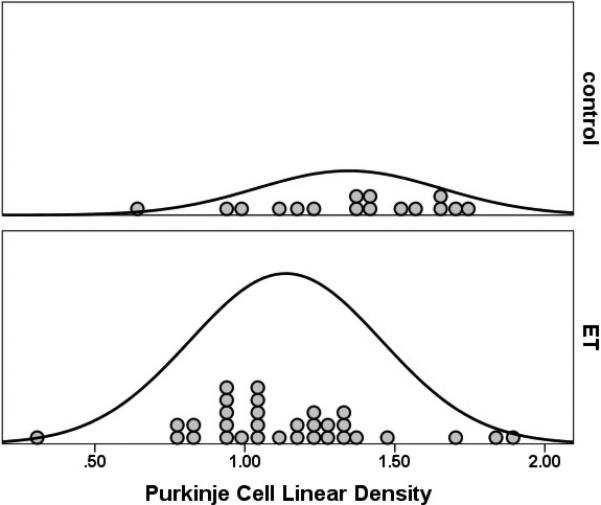
Purkinje cell linear density was lower in 32 ET cases than 16 controls (1.14 ± 0.32 vs. 1.35 ± 0.31 per mm−1, p = 0.03). The curves represent the distribution of data points.
Table 2.
Purkinje cell linear density by diagnosis: tertiles and quartiles analyses
| ETCases N = 32 | Controls N = 16 | |
|---|---|---|
| Tertile 1 (<1.04 Purkinje cells/mm−1) | 13 (40.6) | 3 (18.8) |
| Tertile 2 (1.04 – 1.35 Purkinje cells/mm−1) | 14 (43.8) | 3 (18.8) |
| Tertile 3 (>1.35 Purkinje cells/mm−1) | 5 (15.6) | 10 (62.5) |
| Quartile 1 (<0.98 Purkinje cells/mm−1) | 10 (31.3) | 2 (12.5) |
| Quartile 2 (0.98 – 1.19 Purkinje cells/mm−1) | 9 (28.1) | 3 (18.8) |
| Quartile 3 (1.20 – 1.35 Purkinje cells/mm−1) | 9 (28.1) | 3 (18.8) |
| Quartile 4 (>1.35 Purkinje cells/mm−1) | 4 (12.5) | 8 (50.0) |
To further assess the distribution of Purkinje cell linear density in cases vs. controls, Purkinje cell linear density was also stratified into tertiles as well as quartiles; ET cases and controls differed with respect to their distributions, with a higher percentage of ET cases in the lower tertiles/quartiles and a higher percentage of controls in the higher strata (for tertiles analysis, X2 = 10.91, p = 0.004; for quartiles analysis, X2 = 8.25, p = 0.04).
Purkinje cell linear density was not correlated with age (Pearson's r = -0.11, p = 0.48) or significantly correlated with PMI (Spearman's r = 0.27, p = 0.09). It was not correlated with gender (1.19 ± 0.32 Purkinje cells/mm−1 in males vs. 1.21 ± 0.33 Purkinje cells/mm−1 in females, Student's t test = 0.28, p = 0.78), brain weight (Pearson's r = 0.02, p = 0.90), Braak AD score (Spearman's r = 0.23, p = 0.12), or CERAD score (Spearman's r = 0.21, p = 0.16).
If we excluded the 8 brains (5 cases and 3 controls) included in our earlier report,18 the Purkinje cell linear density remained lower in ET cases than controls (1.09 ± 0.31 vs. 1.33 ± 0.31 Purkinje cells/mm−1, Student's t test = 2.35, p = 0.02). Purkinje cell linear density (assessed using 100 μm calbindin-immunostained sections) was marginally correlated with Purkinje cell count (assessed using 7 μm LH&E-stained sections)(Pearson's r = 0.33, p = 0.11), and inversely associated with the torpedo count (LH&E stained cerebellar cortical sections) (Spearman's r = −0.38, p =0.028).
Discussion
In the current sample of 32 ET cases and 16 controls, Purkinje cell linear density was significantly lower in ET cases than controls. The Purkinje cell linear density was also inversely correlated with the number of torpedoes (i.e., subjects with more evidence of Purkinje cell axonal swelling/damage also had greater loss of Purkinje cells).
In our prior study,18 we reported a value of 3.46 ± 1.27 Purkinje cells/mm (0.346 ± 0.127 Purkinje cells/mm−1) in controls and 2.14 ± 0.82 Purkinje cells/mm (0.214 ± 0.082 Purkinje cells/mm−1) in cases. The current case and control values (1.35 ± 0.31 Purkinje cells/mm−1in controls vs. 1.14 ± 0.32 Purkinje cells/mm−1in cases) are approximately 4-times higher than those, and this is likely to be a due to the greater thickness of the section used in the current study (i.e., 100 μm in current study and only 7 μm in prior study). In both studies, ET cases had lower Purkinje cell linear density than controls. The current study reproduces the original finding and expands the number of cases and controls by several-fold.
The loss of Purkinje cells in ET has been observed in our prior studies that reported simple cell counts per microscopic field, but there is debate around this issue.12, 18-20 The one study that did not detect a significant case-control difference was conducted in 12 ET cases and 6 controls, but the study has been criticized for having insufficient statistical power.20 A further re-examination and quantification of Purkinje cells in five of the study's cases revealed the clear presence of segmental loss of Purkinje cells.20
The reduction in Purkinje cells that we observed was modest (18%) but statistically significant, and the data distribution curves in cases and controls (e.g., Figure 2) were clearly different. We recognize that the two distribution curves overlap. As discussed previously, a modest and partial depletion of the Purkinje cell population, in conjunction with remodeling of basket cell processes around surviving Purkinje cells all suggest that the as-yet unknown underlying molecular abnormality in ET is one that leads to Purkinje cellular injury and Purkinje cell dysfunction. In some cases, the underlying abnormality probably overwhelms the cell, leading to Purkinje cell death. Thus, the likely primary pathophysiology of ET, occurring on a molecular and then cellular-physiological level, seems to involve to some extent a partial loss of Purkinje cells, with this being a gross and possibly imperfect cellular bio-marker of a larger underlying systems problem.20
Postmortem data show cell counts at only one point in time (i.e., after death). Therefore, it is not possible using autopsy data to show a reduction in cells in one individual patient over time. While some cases and controls may have similar cell counts at the time of death, giving the impression of the absence of cell loss in some cases, this impression does not take into consideration the fact that cell counts may have started at different places at baseline. There is a range of cell counts even in normal individuals of the same age. Thus, a case who began with 1.50 PC/mm−1 prior to disease onset (e.g., age 50) and who had 1.00 PC/mm−1 at death (e.g., age 80), experienced a 33% loss of PCs, whereas a control who may have begun with 1.20 PC/mm−1 at age 50 and had 1.00 PC/mm−1 at death (e.g, age 80), experienced only a 20% loss of PCs. This study had weakness. The quantification of Purkinje cell linear density was performed without random, unbiased stereological methods. However, the same approach was used for both cases and controls, making it unlikely that there was any diagnostically-selective bias.
The study also had several strengths. Cases were clinically well-characterized. We assessed Purkinje cell linear density, which is a more rigorous approach than that used in prior studies that have relied on simple count data. Purkinje cell linear density was further correlated with other pathobiological markers including torpedo counts and Basket cell changes.
In summary, the current sample of ET cases demonstrates a reduction in Purkinje cell number relative to that of controls. Greater Purkinje cell axonal remodeling (torpedoes) was found in individuals who had the most Purkinje cell drop out. The role of Purkinje cell loss in the pathogenesis of this disorder merits additional study.
Acknowledgements
The authors wish to thank Phyllis L. Faust MD, PhD for providing counts of Purkinje cells, torpedoes and basket cell processes. The authors would like to thank Ming X. Tang PhD (Department of Biostatistics, Columbia University) for additional statistical support.
Financial disclosure related to research covered in this article
This work was supported by R01 NS042859 (National Institutes of Health, Bethesda, MD).
Full financial disclosure for the previous 12 months
Elan D. Louis has received research support from the National Institutes of Health: NINDS #R01 NS042859 (principal investigator), NINDS #R01 NS39422 (principal investigator), NINDS #T32 NS07153-24 (principal investigator), NINDS #R01 NS073872 (co-principal investigator), NINDS #R21 NS077094 (co-Investigator), and NINDS #R01 NS36630 (co-Investigator), as well as the Parkinson's Disease Foundation (principal investigator), the Arlene Bronstein Essential Tremor Research Fund (Columbia University), and the Claire O'Neil Essential Tremor Research Fund (Columbia University). Jean-Paul G. Vonsattel has received research support from the National Institutes of Health: NINDS #R01 NS042859 (co-investigator).
Footnotes
Statistical Analyses: The statistical analyses were conducted by Dr. Louis.
Author Contributions
Elan D. Louis: Research project conception, organization and execution; statistical analyses design and execution; manuscript writing (writing the first draft and making subsequent revisions).
Rachel Babij: Research project execution; manuscript writing (making subsequent revisions).
Michelle Lee: Research project execution; manuscript writing (making subsequent revisions).
Etty Cortés: Research project execution; manuscript writing (making subsequent revisions).
Jean-Paul G. Vonsattel: Research project conception, organization and execution; manuscript writing (making subsequent revisions).
Conflict of Interest Statement
The authors declare that there are no conflicts of interest and no competing financial interests.
References
- 1.Benito-Leon J, Bermejo-Pareja F, Morales JM, Vega S, Molina JA. Prevalence of essential tremor in three elderly populations of central Spain. Mov Disord. 2003;18(4):389–394. doi: 10.1002/mds.10376. [DOI] [PubMed] [Google Scholar]
- 2.Louis ED, Ferreira JJ. How common is the most common adult movement disorder? Update on the worldwide prevalence of essential tremor. Mov Disord. 2010;25:534–541. doi: 10.1002/mds.22838. [DOI] [PubMed] [Google Scholar]
- 3.Dogu O, Sevim S, Camdeviren H, et al. Prevalence of essential tremor: door-to-door neurologic exams in Mersin Province, Turkey. Neurology. 2003;61(12):1804–1806. doi: 10.1212/01.wnl.0000099075.19951.8c. [DOI] [PubMed] [Google Scholar]
- 4.Benito-Leon J. Essential Tremor: One of the Most Common Neurodegenerative Diseases? Neuroepidemiology. 2011;36(2):77–78. doi: 10.1159/000323572. [DOI] [PMC free article] [PubMed] [Google Scholar]
- 5.Louis ED, Frucht SJ, Rios E. Intention tremor in essential tremor: Prevalence and association with disease duration. Mov Disord. 2009;24:626–627. doi: 10.1002/mds.22370. [DOI] [PMC free article] [PubMed] [Google Scholar]
- 6.Louis ED, Shungu DC, Chan S, Mao X, Jurewicz EC, Watner D. Metabolic abnormality in the cerebellum in patients with essential tremor: a proton magnetic resonance spectroscopic imaging study. Neurosci Lett. 2002;333(1):17–20. doi: 10.1016/s0304-3940(02)00966-7. [DOI] [PubMed] [Google Scholar]
- 7.Kronenbuerger M, Konczak J, Ziegler W, et al. Balance and motor speech impairment in essential tremor. Cerebellum. 2009;8(3):389–398. doi: 10.1007/s12311-009-0111-y. [DOI] [PubMed] [Google Scholar]
- 8.Cerasa A, Messina D, Nicoletti G, et al. Cerebellar atrophy in essential tremor using an automated segmentation method. Am J Neuroradiol. 2009;30:1240–1243. doi: 10.3174/ajnr.A1544. [DOI] [PMC free article] [PubMed] [Google Scholar]
- 9.Avanzino L, Bove M, Tacchino A, et al. Cerebellar involvement in timing accuracy of rhythmic finger movements in essential tremor. Eur J Neurosci. 2009;30(10):1971–1979. doi: 10.1111/j.1460-9568.2009.06984.x. [DOI] [PubMed] [Google Scholar]
- 10.Quattrone A, Cerasa A, Messina D, et al. Essential head tremor is associated with cerebellar vermis atrophy: a volumetric and voxel-based morphometry MR imaging study. Am J Neuroradiol. 2008;29(9):1692–1697. doi: 10.3174/ajnr.A1190. [DOI] [PMC free article] [PubMed] [Google Scholar]
- 11.Louis ED. Essential tremor: evolving clinicopathological concepts in an era of intensive post-mortem enquiry. Lancet Neurol. 2010;9(6):613–622. doi: 10.1016/S1474-4422(10)70090-9. [DOI] [PubMed] [Google Scholar]
- 12.Louis ED, Faust PL, Vonsattel JP, et al. Neuropathological changes in essential tremor: 33 cases compared with 21 controls. Brain. 2007;130(Pt 12):3297–3307. doi: 10.1093/brain/awm266. [DOI] [PubMed] [Google Scholar]
- 13.Louis ED, Faust PL, Ma KJ, Yu M, Cortes E, Vonsattel JP. Torpedoes in the cerebellar vermis in essential tremor cases vs. controls. Cerebellum. 2011;10:812–819. doi: 10.1007/s12311-011-0291-0. [DOI] [PubMed] [Google Scholar]
- 14.Yu M, Ma K, Faust PL, et al. Increased number of Purkinje cell dendritic swellings in essential tremor. Eur J Neurol. 2012;19:625–630. doi: 10.1111/j.1468-1331.2011.03598.x. [DOI] [PMC free article] [PubMed] [Google Scholar]
- 15.Kuo SH, Erickson-Davis C, Gillman A, Faust PL, Vonsattel JP, Louis ED. Increased number of heterotopic Purkinje cells in essential tremor. J Neurol Neurosurg Psychiatry. 2011;82:1038–1040. doi: 10.1136/jnnp.2010.213330. [DOI] [PMC free article] [PubMed] [Google Scholar]
- 16.Erickson-Davis CR, Faust PL, Vonsattel JP, Gupta S, Honig LS, Louis ED. “Hairy baskets” associated with degenerative Purkinje cell changes in essential tremor. J Neuropathol Exp Neurol. 2010;69(3):262–271. doi: 10.1097/NEN.0b013e3181d1ad04. [DOI] [PMC free article] [PubMed] [Google Scholar]
- 17.Louis ED, Vonsattel JP, Honig LS, et al. Essential tremor associated with pathologic changes in the cerebellum. Arch Neurol. 2006;63(8):1189–1193. doi: 10.1001/archneur.63.8.1189. [DOI] [PubMed] [Google Scholar]
- 18.Axelrad JE, Louis ED, Honig LS, et al. Reduced purkinje cell number in essential tremor: a postmortem study. Arch Neurol. 2008;65(1):101–107. doi: 10.1001/archneurol.2007.8. [DOI] [PMC free article] [PubMed] [Google Scholar]
- 19.Rajput AH, Robinson CA, Rajput ML, Robinson SL, Rajput A. Essential tremor is not dependent upon cerebellar Purkinje cell loss. Parkinsonism Relat Disord. 2012;18(5):626–628. doi: 10.1016/j.parkreldis.2012.01.013. [DOI] [PubMed] [Google Scholar]
- 20.Louis ED, Faust PL, Vonsattel JP. Purkinje cell loss is a characteristic of essential tremor: Towards a more mature understanding of pathogenesis. Parkinsonism Relat Disord. 2012;18:1003–1004. doi: 10.1016/j.parkreldis.2012.06.017. [DOI] [PubMed] [Google Scholar]
- 21.Louis ED, Borden S, Moskowitz CB. Essential tremor centralized brain repository: diagnostic validity and clinical characteristics of a highly selected group of essential tremor cases. Mov Disord. 2005;20(10):1361–1365. doi: 10.1002/mds.20583. [DOI] [PubMed] [Google Scholar]
- 22.Harasymiw JW, Bean P. Identification of heavy drinkers by using the early detection of alcohol consumption score. Alcohol Clin Exp Res. 2001;25(2):228–235. [PubMed] [Google Scholar]
- 23.Louis ED, Zheng W, Applegate L, Shi L, Factor-Litvak P. Blood harmane concentrations and dietary protein consumption in essential tremor. Neurology. 2005;65(3):391–396. doi: 10.1212/01.wnl.0000172352.88359.2d. [DOI] [PMC free article] [PubMed] [Google Scholar]
- 24.Braak H, Braak E. Diagnostic criteria for neuropathologic assessment of Alzheimer's disease. Neurobiol Aging. 1997;18(4 Suppl):S85–88. doi: 10.1016/s0197-4580(97)00062-6. [DOI] [PubMed] [Google Scholar]
- 25.Braak H, Alafuzoff I, Arzberger T, Kretzschmar H, Del Tredici K. Staging of Alzheimer disease-associated neurofibrillary pathology using paraffin sections and immunocytochemistry. Acta Neuropathol. 2006;112(4):389–404. doi: 10.1007/s00401-006-0127-z. [DOI] [PMC free article] [PubMed] [Google Scholar]
- 26.Braak H, Del Tredici K, Rub U, de Vos RA, Jansen Steur EN, Braak E. Staging of brain pathology related to sporadic Parkinson's disease. Neurobiol Aging. 2003;24(2):197–211. doi: 10.1016/s0197-4580(02)00065-9. [DOI] [PubMed] [Google Scholar]
- 27.Mirra SS. The CERAD neuropathology protocol and consensus recommendations for the postmortem diagnosis of Alzheimer's disease: a commentary. Neurobiol Aging. 1997;18(4 Suppl):S91–94. doi: 10.1016/s0197-4580(97)00058-4. [DOI] [PubMed] [Google Scholar]
- 28.Louis ED, Vonsattel JP, Honig LS, Ross GW, Lyons KE, Pahwa R. Neuropathologic findings in essential tremor. Neurology. 2006;66(11):1756–1759. doi: 10.1212/01.wnl.0000218162.80315.b9. [DOI] [PubMed] [Google Scholar]