

Abstract
Objectives
To investigate the association between tea consumption and mortality among oldest-old Chinese.
Design
Population-based longitudinal data from The Chinese Longitudinal Healthy Longevity Survey (CLHLS) was analyzed using Cox semi-parametric proportional hazard model.
Setting
631 randomly selected counties and cities of China’s 22 provinces.
Participants
9,093 old adults aged 80 and above who provided complete data at baseline survey (year 1998).
Measurements
Self-reported current frequency of tea drinking and past frequency around age 60 were ascertained at baseline survey, and follow-up survey was conducted respectively in years 2000, 2002 and 2005.
Results
Among oldest-old Chinese, tea consumption was associated with reduced risk of mortality after adjusting for demographic characteristics, socioeconomic status, health practices, and health status. Compared with non-tea drinkers, the adjusted hazard ratio (HR) was 0.90 (95% CI 0.84–0.96) for daily tea drinkers (at the baseline survey, 1998) and 1.00 (95% CI 1.01–1.07) for occasional tea drinkers respectively (P for linear trend=0.003). Similar results were found when tea drinking status around age 60 was used in analysis. Further analysis showed that compared to consistently infrequent tea drinkers, subjects who reported frequent tea drinking at both age 60 and at baseline survey had a 10% reduction in mortality (HR=0.90, 95%CI 0.84–0.97).
Conclusion
Tea consumption is associated reduced risk of mortality among oldest-old Chinese.
Keywords: Tea, Oldest-old Chinese, mortality, longitudinal study
INTRODUCTION
Tea is frequently consumed by people in almost all countries and is the most common beverage after water. 1 In China, tea (pronounced as “Cha” in Chinese) refers to all types of tea that are made from the leaves of the plant Camellia sinensis. As China is a huge country that spans across regions with distinct climate, culture and traditions, the predominant type of tea in different regions varies. For example, in Zhejiang Hangzhou, people mostly drink the green tea “West Lake Dragon Well”; in Yunnan, the black tea ‘Pu Er’ is the dominant type. Because of the high rates of tea consumption in the world, even small effects in humans could have large implications for public health.1 There has therefore been growing research interests on various health benefits of tea consumption in the past decades. Tea contains various bioactive components, of which the most widely studied compounds are tea catechins such as the Epigallocatechin-3-Gallate (EGCG). Most of the health benefits of tea drinking have been attributed to tea catechins but other components in tea such as theaflavins, thearugibins, L-theanine and caffeine also could play important roles. Accumulating data indicate that tea drinking reduces the risk of stroke, 2 dementia, 3–6 depression, 7–9 cardiovascular diseases, 10 cancers. 10
Since chronic diseases in late life are associated with premature death, it is plausible to speculate that tea drinking should be related to longevity, given its protective effects on various chronic medical conditions. Evidence from basic research on insects and animals also indicated that compounds in tea can increase lifespan. 11–13 Recently, longitudinal cohort studies from Japan reported that tea consumption was associated with reduced risk of mortality, death from cardiovascular diseases, 1, 14 and death caused by cancer. 15 However, those encouraging findings have not been replicated in large sample studies from other populations, and especially have not been replicated in large oldest-old samples. A recent work by Qiu et al. 21 based on four waves (1998, 2000, 2002 and 2005) of recruitment of The Chinese Longitudinal Healthy Longevity Survey (CLHLS) failed to show a reduced mortality risk associated with tea drinking in the whole sample of men and women combined. Only in men who drank tea almost every day was there a 10–20% lower risk of death compared to their counterparts. That study only analysed the mortality effects of tea consumption reported at baseline survey of subjects aged 80+ recruited in the earlier surveys and subsequent new younger subjects aged 65–79 recruited at later surveys. Changes in consumption habits are common during late life, and the influence of possible changes in the frequency of tea drinking on effect estimates is not known. In the present study, in contrast, we analyzed available data from CLHLS subjects recruited at the baseline survey; we used data on the frequency of tea drinking reported not only at the baseline survey, but also previously at around age 60 years old and took into account changes in tea drinking habits during the interval to derive stable measures of tea drinking frequency. We hypothesized a reduction in mortality risk associated with the level of tea drinking (non-drinker, occasional drinker, daily drinker) assessed at baseline and around age 60 and from both surveys.
METHODS
Study Population
The data used in this study are from the 1998–2005 longitudinal dataset which is derived from the first four waves (1998, 2000, 2002, and 2005) of the CLHLS and presents both static and seven-year interval dynamic information for the respondents who were first interviewed in 1998. The CLHLS randomly selected half of the counties and cities of 22 provinces in China, and attempted interviews on all centenarians who voluntarily agreed to participate in the study. For each centenarian, one neighborhood octogenarian and one neighborhood nonagenarian of pre-designated age and sex was interviewed. “Neighborhood” was loosely defined – it could be in the same village or street if available, or in the same town or in the same sampled county or city. The predefined age and sex, used to identify approximately equal numbers of male and female nonagenarians and octogenarians, were randomly determined, based on the code numbers of the centenarians. 16
Gu provided a comprehensive review of data quality of CLHLS in terms of proxy use, non-response rate, sample attrition, and reliability and validity of major health measures. His results showed that the data quality of CLHLS is generally good. For example, compared with data attrition in surveys conducted in Western countries, the CLHLS has a similar proportion of data attrition. And the unit non-response rate among the Chinese oldest-old was very low. 17 Goodkind wrote in his review on CLHLS: “The story emerging from these chapters is that the quality of reporting, despite a few flaws endemic to this kind of survey, was fairly good.” 18
The CLHLS baseline survey included 9,093 respondents. Of these, 3,368 persons died between the first and second waves, 1,604 persons died between the second and third waves, and 1,308 persons died between the third and fourth waves. There were 894 respondents lost to follow-up in the 2000 survey, 584 lost in the 2002 survey, and 284 lost in the 2005 survey. The average attrition per wave is 4.85% (see figure 1). In this study, we use cross-sectional data collected in 1998 from 9,093 participants and their follow-up data between 1998 and 2005. As was previously reported by Zeng et al. 16 and Qiu et al.21, those who were invalid or incomplete cases were excluded in this research.
Figure 1.
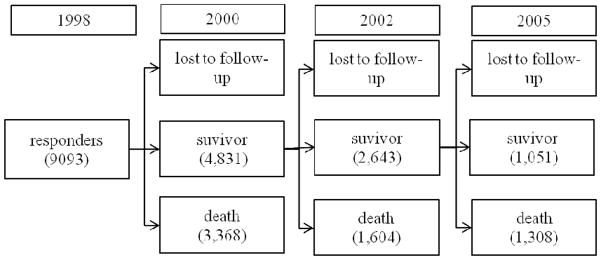
Survivors, deaths and loss to follow-up in the sample
Tea Consumption
The key independent variables are frequency of tea consumption at the baseline survey and around age 60. Respondents were asked two questions, (1) “Do you drink tea regularly at present?”, and (2) “Did you drink tea regularly around 60 years old?” Response categories were “almost everyday”; “occasionally”; “rarely or never”. a In addition, based on the above two questions, we construct a new variable to reflect consistent frequency of tea consumption across different stages of late life cycle. The responses were first categorized into two groups, that is, frequently (“almost everyday”) and infrequently (“occasionally or rarely or never”). Then the respondents were categorized into three groups based on frequency of tea consumption around age 60 and at the baseline survey, (1) “consistently infrequent drinker”: drank tea infrequently both around age 60 and at the baseline survey; (2) “inconsistently frequent drinker”: drank tea frequently/infrequently around age 60, but infrequently/frequently at the baseline survey; (3) “consistently frequent drinker”: drank tea frequently both around age 60 and at the baseline survey.
Covariates
The frequency distributions of the covariates across different tea drinking frequency categories included in our statistical models are listed in Table 1. We choose these variables as relevant covariates based on reviews of previous studies in this field1, 11–15 and our understanding of the Chinese social context.
Table 1.
Distribution of Potential Confounders across Different Drinking Frequency Categories
| Panel A Tea consumption at 1998 wave survey time
|
Panel B Tea consumption around 60 years old
|
|||||
|---|---|---|---|---|---|---|
| No drinker n= 4930 | Occasional drinker n=1507 | Daily drinker n=2264 | No drinker n= 4960 | Occasional drinker n=1712 | Daily drinker n=1993 | |
| Gender | ||||||
| Female | 66.7 | 56.7 | 46.6 | 66.5 | 56.5 | 45.7 |
| Male | 33.3 | 43.3 | 53.4 | 33.5 | 43.5 | 54.3 |
| Pearson chi2(2) = 267.46 P = 0.00 | Pearson chi2(2) = 264.39 P = 0.00 | |||||
| Mean age | 93.42 | 92.61 | 91.26 | 93.36 | 92.55 | 91.22 |
| F=60.81 P=0.00 | F =54.44 P=0.00 | |||||
| Residence | ||||||
| Rural | 65.3 | 64.9 | 53.8 | 66.4 | 61.5 | 52.4 |
| Urban | 34.7 | 35.1 | 46.2 | 33.6 | 38.5 | 47.6 |
| Pearson chi2(2) = 93.00 P = 0.00 | Pearson chi2(2) = 118.64 P = 0.00 | |||||
| Education | ||||||
| Illiterate | 74 | 65.7 | 51.6 | 74 | 64.5 | 49.9 |
| Literate | 26 | 34.3 | 48.4 | 26 | 35.5 | 50.1 |
| Pearson chi2(2) = 348.42 P= 0.00 | Pearson chi2(2) = 375.59 P= 0.00 | |||||
| Marital/live-in status | ||||||
| Live alone | 86.4 | 82.7 | 77.1 | 86.4 | 82.1 | 76.3 |
| Married and living with spouse | 13.6 | 17.3 | 22.9 | 13.6 | 17.9 | 23.7 |
| Pearson chi2(2) = 95.90 P = 0.00 | Pearson chi2(2) = 106.72 P = 0.00 | |||||
| Smoking | ||||||
| No | 86.6 | 81.9 | 75.4 | 85.9 | 82.2 | 75.6 |
| Yes | 13.4 | 18.1 | 24.6 | 14.1 | 17.8 | 24.4 |
| Pearson chi2(2) = 136.70 P = 0.00 | Pearson chi2(2) = 106.94 P = 0.00 | |||||
| Drinking Alcohol | ||||||
| No | 90.5 | 87.6 | 83.7 | 90.2 | 87.8 | 83.5 |
| Yes | 9.5 | 12.4 | 16.3 | 9.8 | 12.2 | 16.5 |
| Pearson chi2(2) = 68.12 P = 0.00 | Pearson chi2(2) = 60.88 P =0.00 | |||||
| Self-Reported Health | ||||||
| Not healthy | 45.3 | 42.5 | 37 | 44.3 | 42.9 | 38.4 |
| Healthy | 54.7 | 57.5 | 63 | 55.7 | 57.1 | 61.6 |
| Pearson chi2(2) = 41.09 P= 0.00 | Pearson chi2(2) = 18.83 P= 0.00 | |||||
| Number of Medical Conditions | 0.75 | 0.77 | 0.87 | 0.74 | 0.79 | 0.91 |
| F=10.60 P =0.00 | F= 20.71 P =0.00 | |||||
The covariates chosen in our regressions were: (1) demographic variables, including gender, age, and marital status (currently married and living with spouse vs. lone, including separated, divorced, widowed and never married); (2) socioeconomic status (SES), that is, education (illiterate vs. literate) and residence (rural area vs. urban area); (3) health practices, including smoking, drinking alcohol; (4) health status (self reported health and total number of medical conditionsb reported by the respondent).
Statistical analysis
The association between tea consumption and mortality among the Chinese oldest-old was examined using Cox semi-parametric proportional hazard model. Statistical test showed that the required proportionality assumption is met with our dataset. The basic model (1) in this paper is,
| (1) |
In model (1), “tea” refers to tea consumption, which is measured by three variables, frequency of tea drinking at the baseline survey, frequency of tea drinking around age 60, and changes of frequency of tea drinking from age 60 to the baseline survey, and the three-dimensional vector coefficient β1 refers to effect of tea consumption on mortality hazard.
As model (1) may produce a biased estimation of β1 due to confounding, we control for confounding by variables which are known to be correlated with mortality hazard as well as with tea consumption. These include demographic variables, as in model (2).
| (2) |
where X0 refers to the demographic variables and SES.
Other putative confounders include health practices and health status, were further added into model (2), as in the following model (3).
| (3) |
where X1 refer to health practices and health status.
All analyses were performed using STATA version 10.0 (StataCorp 2007).
RESULTS
As Table 1 shows, frequent tea drinkers were significantly more likely to be men, younger, urban-living, literate, and living with a spouse. At the same time, they were more likely to smoke and drink alcohol. They were more likely to report being healthy, but with more reported medical conditions.
We first analyzed the relationship between tea consumption at baseline survey and mortality hazard. The results are summarized in panel A of table 2. c In all the models, there was a significant linear trend of effects of tea drinking frequency on mortality hazard (p=0.001–0.015). With adjustment for confounders, the mortality hazard of daily drinkers compared to non-drinkers was reduced by 10%.
Table 2.
Relative Hazards Ratio (HR) of Tea Consumption on 7-Year Mortality, CLHLS, 1998–2005
| Panel A tea consumption at 1998 survey wave | ||||
|---|---|---|---|---|
| Model | Non drinker [n= 4930] | Occasional drinker [n=1507] | Daily drinker [n=2264] | P for linear trend |
| Model 1 | 1 | 0.98 (0.92 to 1.05) | 0.92 (0.87 to0.98) | 0.015 |
| Model 2 | 1 | 0.97 (0.90 to 1.04) | 0.90 (0.84 to 0.96) | 0.001 |
| Model 3 | 1 | 1.00(0.93 to 1.07) | 0.90(0.84 to 0.96) | 0.003 |
| Panel B tea consumption around 60 years old | ||||
|---|---|---|---|---|
| Model | Non drinker [n= 4960] | Occasional drinker [n=1712] | Daily drinker [n=1993] | P for linear trend |
| Model 1 | 1 | 0.99 (0.93 to 1.06) | 0.96 (0.90 to 1.03) | 0.272 |
| Model 2 | 1 | 0.98 (0.91 to 1.04) | 0.94 (0.88 to 1.01) | 0.073 |
| Model 3 | 1 | 0.98 (0.91 to 1.05) | 0.93 (0.86 to 0.99) | 0.036 |
Note: Values in the cell are hazards ratio (HR) estimated based on Cox semi-parametric proportional hazard model, and values in the bracket are 95% confidence interval (CI) of the HR. Panel A reports the estimation to effects of tea consumption at 1998 wave survey time on 7-year mortality, CLHLS, 1998–2005, while panel B reports the estimation to effects of tea consumption around 60 years old
Variables in model 1: only tea consumption status
Variables in model 2: + demographic variables and socioeconomic status (SES).
Variables in model 3: +health activities and health status.
Secondly, we estimated the relationship between tea consumption around age 60 and the subsequent mortality risk. The results are summarized in panel B of table 2. Model 1 which included tea drinking only shows that tea consumption was associated a reduction in mortality risk among occasional drinkers (by 1%) and daily drinkers (by 4%), but the lower 95% confidence intervals included 1, and the p value for linear trend was 0.272. The final model including demographic variables, SES, health activities and health status gave 95% confidence intervals of the estimated relative mortality hazard of daily drinker below 1, and the p value for linear trend was 0.036.
Next, we estimated the mortality hazard associated with consistently and inconsistently frequent tea drinking between age 60 and baseline survey using the same procedures, compared with subjects who consistently drank tea infrequently. The results are summarized in Table 3. After adjusting for confounding variables (model 3), the mortality hazard of subjects who were inconsistently frequently tea drinkers was reduced by 3%, and the mortality hazard of subjects who were consistently frequent tea drinkers was reduced by 10%; the p value for the linear trend was 0.042.
Table 3.
Relative Hazards Ratio (HR) of Consistent Tea Drinking Habit between 60 Years Old and the 1998 Wave Survey Time On 7-Year Mortality, CLHLS, 1998–2005
| Model | Infrequently drinking consistently [n=6,143] | Drinking inconsistently [n=740] | Frequently drinking consistently [n=1,748] | P for linear trend |
|---|---|---|---|---|
| Model 1 | 1 | 1.00 (0.91 to 1.01) | 0.93(0.87 to1.00) | 0.053 |
| Model 2 | 1 | 0.99 (0.90 to 1.09) | 0.91 (0.85 to 0.96) | 0.010 |
| Model 3 | 1 | 0.97(0.88 to 1.07) | 0.90 (0.84 to 0.97) | 0.042 |
Note: Values in the cell are hazards ratio (HR) estimated based on Cox semi-parametric proportional hazard model, and values in the bracket are 95% confidence interval (CI) of the HR.
Variables in model 1: only tea consumption status
Variables in model 2: + demographic variables and socioeconomic status (SES).
Variables in model 3: +health activities and health status
DISCUSSION
Based on longitudinal data from a large sample of oldest-old Chinese, we found that higher tea consumption frequency was associated with reduced risk of mortality across a 7-year follow-up period. The results were statistically significant after controlling for potential confounding variables and remained essentially the same regardless of whether tea consumption habit around age 60, tea consumption habit at baseline survey, or frequent tea drinking consistently reported for each of the two time points were used in the analysis. The oldest-old is a unique group which is relatively understudied, and the CLHLS cohort is the largest study sample of the oldest-old in the world.19 This is the first time that a study has shown a relationship between frequent tea consumption and reduced mortality among oldest-old Chinese, supporting the beneficial effects of tea in extreme late life on survival and longevity. Our findings confirm reports from a handful of previous longitudinal studies that were conducted among middle-aged and young-old Japanese and Chinese. 1, 14, 15, 21 At the population level, a 10% mortality risk reduction associated with consistent frequent tea drinking represents a considerable health impact.
Arguably, tea consumption may measure some other unobserved characteristics which may be related to both tea consumption and mortality. As shown in Table 1, tea consumption was associated with higher education, urban-living and living with a spouse, which are well-established positive social determinants of longer survivorship.22,23 They could represent an healthy group of old individuals with longer survival likelihood. Indeed they were more likely to report being healthy. Although they reported more medical conditions than non-drinkers, they may possibly be more aware of the number of medical problems they had while the latter may possibly be under-reporting. The overall number of medical conditions reported was remarkably low in both groups, likely due to general under-reporting of medical conditions, but also may be partly related to their longer survivor status. Although they were more likely to smoke and drink alcohol, the mortality hazard due to negative lifestyle, behavioral and biomedical risk factors is known to be lessened in the very old; indeed for obesity and high cholesterol, they have also been found to be reversed. 24 The study does not exclude the possibility that other unknown personal, psychosocial and behavioral characteristics associated with tea drinking may favor better survival and longevity among tea drinkers. However, there are biologically plausible links that support the likelihood of a beneficial effect of tea drinking on mortality risks.
Most lifestyle-related diseases show chronic progression with multiple processes, 1 hence the delay of progression will help to increase lifespan. From this perspective, the observed protective effect of tea on survival at follow-up could be partially explained by the protective effects of tea on the pathogenesis and progression of multiple chronic medical conditions that are common in late life. However, since we did not collect detailed information on the incidence of chronic diseases and the exact cause of death at follow-up, the relative contribution from each medical condition and the association between tea consumption and disease specific mortality remained unknown. On the other hand, it is possible that compounds in tea could promote longevity independently of its effects in preventing disease and delaying progression for various chronic medical conditions. However, we are limited in further investigating this hypothesis as we did not measure biomarkers that could be related to longevity pathways.
A limitation in this study is that we did not collect more detailed information on the types and quantity of tea consumed in estimating the effects of tea consumption on mortality. Different types of tea vary in their bioactive constituents, and may therefore have diverse effects on mortality. The main type of tea consumed by Chinese is green tea, about 58% of total tea consumption, 20 so the results may mainly reflect the effects of green tea consumption on mortality. Also we did not have data on blood concentrations of tea compounds such as epigallocatechin gallate (EGCG) or L-theanine, which could be useful in validating the reported frequency measurement of tea consumption.
A potential bias to the results may arise from loss to follow-up. We analyzed the characteristics of those lost to follow up, and found that they were more likely to be male, younger, literate, urban-living, report being healthy, and drink tea frequently. Most of those characteristics are positively correlated with lower mortality hazard. As a result, the estimated effects of tea drinking on mortality may be prone to bias downward as a result of the attrition problem, hence unlikely to weaken the strength of association.
Another possible limitation is that we only adjusted for the number of co-morbid medical conditions, which was generally low, but not specific conditions in our model. However, Kuhn et al. have pointed out that objective health measures are not necessarily better predictors of mortality, and individuals can effectively assess their own health status even in settings of poor education and low levels of interaction with modern health systems. On the other hand, self-reported health status has been shown in many studies to be a robust predictor of all-cause mortality, and was included in our adjustment models. Hence, having adjusting for self-reported health status and the number of medical conditions, it is unlikely that adjustment for specific medical co-morbidities will substantially alter our estimates of the association between tea consumption and mortality.
CONCLUSION
We found that tea consumption was associated with reduced risk of mortality among oldest-old Chinese. The life span extending effects of tea and the underlying mechanisms should be further investigated.
Acknowledgments
Funding sources: This study is supported by the NIH R01 grant (5R01-AG023627), National Natural Sciences Foundation of China grants (71110107025; 71233001; 71103006).
Sponsor’s Role: No commercial company sponsored or played any role in the design and methods of the study, subject recruitment, data collection and analysis, and preparation of this article.
Footnotes
The definition of the three categories in CLHLS is that ”daily or almost daily “ means drink tea five times or more per week, “occasionally” means drink tea two to four times per week, and “seldom or never” means drink tea once a week or less.
They are defined in CLHLS as hypertension, diabetes, heart disease, stroke, cerebrovascular disease, bronchitis, pulmonary emphysema, asthma, pneumonia, pulmonary tuberculosis, cataract, glaucoma, cancer, prostate tumor, gastric or duodenal ulcer, Parkinson’s disease, bedsore and others specified by responders.
To save space, we did not report the estimated effects of covariates on mortality hazard in table 2–4. However, they are available on request.
Author Contributions: YZ is the principal investigator of the CLHLS project. LF proposed the analysis. RR conducted literature review, performed statistical analysis and wrote the article. LF, JL, TPN, YZ reviewed statistical analysis and revised the article. All authors read and commented on the final manuscript.
Conflicts of interest: We declare that we have no financial support or relationships that may pose conflict of interest.
References
- 1.Kuriyama S, Shimazu T, Ohmori K, et al. Green tea consumption and mortality due to cardiovascular disease, cancer, and all causes in Japan: The Ohsaki Study. JAMA. 2006;296:1255–1265. doi: 10.1001/jama.296.10.1255. [DOI] [PubMed] [Google Scholar]
- 2.Arab L, Liu W, Elashoff D. Green and black tea consumption and risk of stroke: A Meta-Analysis. Stroke. 2009;40:1786–1792. doi: 10.1161/STROKEAHA.108.538470. [DOI] [PubMed] [Google Scholar]
- 3.Song J, Xu H, Liu F, et al. Tea and cognitive health in late life: Current evidence and future directions. J Nutr Health Aging. 2012;16:31–34. doi: 10.1007/s12603-011-0139-9. [DOI] [PubMed] [Google Scholar]
- 4.Feng L, Gwee X, Kua EH, et al. Cognitive function and tea consumption in community dwelling older chinese in Singapore. J Nutr Health Aging. 2010;14:433–438. doi: 10.1007/s12603-010-0095-9. [DOI] [PubMed] [Google Scholar]
- 5.Feng L, Li J, Ng TP, et al. Tea drinking and cognitive function in oldest-old Chinese. J Nutr Health Aging. 2012;16:754–758. doi: 10.1007/s12603-012-0077-1. [DOI] [PMC free article] [PubMed] [Google Scholar]
- 6.Feng L, Ng TP, Kua EH, et al. Tea and cognitive function of elderly people: Evidence from neurobiology and epidemiology. In: Preedy V, editor. Tea in Health and Disease Prevention. Utah: Academic Press; 2013. pp. 1325–1336. [Google Scholar]
- 7.Chen X, Lu W, Zheng Y, et al. Exercise, Tea consumption, and depression among breast cancer survivors. J Clin Oncol. 2010;28:991–998. doi: 10.1200/JCO.2009.23.0565. [DOI] [PMC free article] [PubMed] [Google Scholar]
- 8.Niu K, Hozawa A, Kuriyama S, et al. Green tea consumption is associated with depressive symptoms in the elderly. Am J Clin Nutr. 2009;90:1615–1622. doi: 10.3945/ajcn.2009.28216. [DOI] [PubMed] [Google Scholar]
- 9.Feng L, Li J, Kua EH, et al. Association of tea consumption with depressive symptoms in older Chinese adults. J Am Geriatr Soc. 2012;60:2358–2360. doi: 10.1111/jgs.12011. [DOI] [PubMed] [Google Scholar]
- 10.Khan N, Mukhtar H. Tea polyphenols for health promotion. Life Sci. 2007;81:519–533. doi: 10.1016/j.lfs.2007.06.011. [DOI] [PMC free article] [PubMed] [Google Scholar]
- 11.Abbas S, Wink M. Epigallocatechin gallate from green tea (Camellia sinensis) increases lifespan and stress resistance in Caenorhabditis elegans. Planta Med. 2009;75:216–221. doi: 10.1055/s-0028-1088378. [DOI] [PubMed] [Google Scholar]
- 12.Peng C, Chan HY, Li YM, et al. Black tea theaflavins extend the lifespan of fruit flies. Exp Gerontol. 2009;44:773–783. doi: 10.1016/j.exger.2009.09.004. [DOI] [PubMed] [Google Scholar]
- 13.Unno K, Fujitani K, Takamori N, et al. Theanine intake improves the shortened lifespan, cognitive dysfunction and behavioural depression that are induced by chronic psychosocial stress in mice. Free Radic Res. 2011;45:966–974. doi: 10.3109/10715762.2011.566869. [DOI] [PubMed] [Google Scholar]
- 14.Suzuki E, Yorifuji T, Takao S, et al. Green tea consumption and mortality among Japanese elderly people: The prospective Shizuoka elderly cohort. Ann Epidemiol. 2009;19:732–739. doi: 10.1016/j.annepidem.2009.06.003. [DOI] [PubMed] [Google Scholar]
- 15.Nakachi K, Eguchi H, Imai K. Can teatime increase one’s lifetime? Ageing Res Rev. 2003;2:1–10. doi: 10.1016/s1568-1637(02)00047-8. [DOI] [PubMed] [Google Scholar]
- 16.Zeng Y, Gu D, George L. Religious participation and mortality among old Chinese adults. Res Aging. 2011;33:51–83. doi: 10.1177/0164027510383584. [DOI] [PMC free article] [PubMed] [Google Scholar]
- 17.Gu D. General data quality assessment of the CLHLS. In: Zeng Y, Poston D, Vlosky D, et al., editors. Healthy Longevity in China: Demographic, Socioeconomic, and Psychological Dimensions. Dordrecht: Springer Publisher; 2008. pp. 39–60. [Google Scholar]
- 18.Goodkind D. Review of the book healthy longevity in china: demographic, socioeconomic, and psychological dimensions. Popul Stud. 2009;63:1–7. [Google Scholar]
- 19.Koenig R. Demography: Sardinia’s mysterious male methuselahs. Science. 2001;291:2074–2076. doi: 10.1126/science.291.5511.2074. [DOI] [PubMed] [Google Scholar]
- 20.Chen M. Tea production and consumption in China. China Tea. 2008;30:1–8. [Google Scholar]
- 21.Qiu L, Sautter J, Gu D. Associations between frequency of tea consumption and health and mortality: evidence from old Chinese. Br J Nutr. 2012;108(9):1686–1697. doi: 10.1017/S0007114511007173. [DOI] [PubMed] [Google Scholar]
- 22.Kaplan GA, Seeman TE, Cohen RD, et al. Mortality among the elderly in the Alameda County Study: Behavioral and demographic risk factors. AmJ Public Health. 1987;77:307–312. doi: 10.2105/ajph.77.3.307. [DOI] [PMC free article] [PubMed] [Google Scholar]
- 23.Manzoli L, Villari P, Pirone G, et al. Marital status and mortality in the elderly: A systematic review and meta-analysis. Soc Sci Med. 2007;64:77–94. doi: 10.1016/j.socscimed.2006.08.031. [DOI] [PubMed] [Google Scholar]
- 24.Dahl AK, Fauth EB, Ernsth-Bravell M, et al. Body mass index, change in body mass index, and survival in old and very old persons. J Am Geriatr Soc. 2013;61:512–518. doi: 10.1111/jgs.12158. [DOI] [PMC free article] [PubMed] [Google Scholar]
- 25.Kuhn R, Rahman O, Menken J. Aging in Sub-Saharan Africa: Recommendation for Furthering Research. Washington (DC): National Academies Press (US); 2006. Survey Measures of Health: How Well Do Self-Reported and Observed Indicators Measure Health and Predict Mortality? In: Cohen B, Menken J eds. [PubMed] [Google Scholar]