

Abstract
The nephrotoxicity limits the clinical application of cisplatin. Human organic cation transporter 2 (OCT2) and multidrug and toxin extrusion proteins (MATEs) work in concert in the elimination of cationic drugs such as cisplatin from the kidney. We hypothesized that co-administration of ondansetron would have an effect on cisplatin nephrotoxicity by altering the function of cisplatin transporters. The inhibitory potencies of ondansetron on metformin accumulation mediated by OCT2 and MATEs were determined in the stable HEK-293 cells expressing these transporters. The effects of ondansetron on drug disposition in vivo were examined by conducting the pharmacokinetics of metformin, a classical substrate for OCTs and MATEs, in wild-type and Mate1−/− mice. The nephrotoxicity was assessed in the wild-type and Mate1−/− mice received cisplatin with and without ondansetron. Both MATEs, including human MATE1, human MATE2-K, and mouse Mate1, and OCT2 (human and mouse) were subject to ondansetron inhibition, with much greater potencies by ondansetron on MATEs. Ondansetron significantly increased tissue accumulation and pharmacokinetic exposure of metformin in wild-type but not in Mate1−/− mice. Moreover, ondansetron treatment significantly enhanced renal accumulation of cisplatin and cisplatin-induced nephrotoxicity which were indicated by increased levels of biochemical and molecular biomarkers and more severe pathohistological changes in mice. Similar increases in nephrotoxicity were caused by genetic deficiency of MATE function in mice. Therefore, the potent inhibition of MATEs by ondansetron enhances the nephrotoxicity associated with cisplatin treatment in mice. Potential nephrotoxic effects of combining the chemotherapeutic cisplatin and the antiemetic 5-hydroxytryptamine-3 (5-HT3) receptor antagonists, such as ondansetron, should be investigated in patients.
Keywords: cisplatin, drug interaction, multidrug and toxin extrusion protein, nephrotoxicity, ondansetron, organic cation transporter
Introduction
Cisplatin has been widely used as an anticancer drug in both adult and pediatric populations against malignant solid tumors. Nephrotoxicity is one of the major dose-limiting side effects of cisplatin that hinders the use of higher doses to maximize the antineoplastic effects (Arany and Safirstein, 2003; Sastry and Kellie, 2005). This underscores the urgent need for understanding the kidney-specific accumulation of cisplatin and development of novel strategies to prevent this serious side effect.
Proximal tubular epithelial cells in the kidney can accumulate cisplatin to a greater degree than other organ tissues. The disproportionate accumulation of cisplatin in kidney tissues, which is about 5 times higher than the serum concentration, highly contributes to cisplatin-induced nephrotoxicity (Kuhlmann et al., 1997; Pabla and Dong, 2008). A desirable approach of renal protection may be to prevent from accumulating toxic concentrations of cisplatin in the kidney while maintain therapeutic concentrations in the circulation. Recent findings demonstrate that organic cation transporters (OCTs) are critical to the nephrotoxicity of platinum agents. The human OCT2, which is primarily expressed at the basolateral membrane of kidney epithelial cells, is a high capacity transporter for the accumulation of cisplatin from the blood into proximal tubules (Filipski et al., 2008). A non-synonymous single-nucleotide polymorphism (SNP, rs316019) in the OCT2 gene has been associated with reduced nephrotoxicity of cisplatin in patients. Moreover, mice lacking Oct2 have decreased urinary excretion of cisplatin while being protected from its nephrotocixity (Filipski et al., 2009). In addition, cimetidine, an OCT2 inhibitor, reduces the nephrotoxicity of cisplatin in wild-type mice to a degree similar to that seen in Oct1/2−/− mice receiving cisplatin treatment (Franke et al., 2010). Therefore, reduced function on cisplatin uptake transporters in the kidney may protect from cisplatin-induced nephrotoxicity.
In contrast to the basal uptake transporter OCT2, the excretion transporters, including multidrug and toxin extrusion proteins 1 and 2 (MATE1 and MATE2K in humans, Mate1 in rodents) that are located at the apical membrane of proximal tubular cells (Masuda et al., 2006), are responsible for cisplatin excretion into the urine (Otsuka et al., 2005). A significant rise in the levels of plasma creatinine and blood urea nitrogen (BUN), two biomarkers of renal injury, was observed in cisplatin-treated Mate1 knockout (Mate1−/−) mice in comparison to wild-type mice (Nakamura et al., 2010). Pyrimethamine, a potent MATE inhibitor, also significantly increases the levels of creatinine and BUN in the mice receiving cisplatin treatment (Nakamura et al., 2010). Reduced function on cisplatin excretion transporters in the kidney may thus be causative to cisplatin-induced nephrotoxicity.
The basolateral OCTs work in concert with the apical MATEs to eliminate cationic drugs from the circulation to the urine. Increasing evidence indicates that this cationic transport system is an important mechanistic basis for the occurrence of drug-drug interactions (DDIs) (Ayrton and Morgan, 2008; Wang et al., 2008b; Matsushima et al., 2009; Nies et al., 2011). We hypothesized that the drugs co-administrated with cisplatin that are either OCT or MATE inhibitors or both might have an effect on cisplatin accumulation and toxicity in the kidney. Notably, OCTs and MATEs share a broad spectrum of substrates and inhibitors (Nies et al., 2011; Yonezawa, 2012). The protection on cisplatin-induced nephrotoxicity by an OCT inhibitor may be compromised if it also inhibits MATEs. In contrast, a MATE inhibitor may not necessarily exacerbate cisplatin-induced nephrotoxity if it is also a potent OCT inhibitor. To determine if there is any interaction between a drug and cisplatin in the kidney, the relative inhibitory potency of the drug on cisplatin transporters at both the basolateral and apical membrane has to be assessed.
The introduction of 5-hydroxytryptamine-3 receptor (5-HT3) antagonists has been a significant clinical advance in the prevention and treatment of chemotherapy-induced nausea and vomiting, particularly for patients receiving highly emetogenic cisplatin-based regimens (Hesketh et al., 2003). 5-HT3 receptor antagonists such as ondansetron and tropisetron can interact with OCTs and MATEs (Kido et al., 2011; Tzvetkov et al., 2012; Wittwer et al., 2013). In this study, by investigating ondansetron, we sought to determine whether 5-HT3 receptor antagonists could be a risk factor in cisplatin-induced nephrotoxicity. At first, the inhibitory potencies of ondansetron on OCTs and MATEs were determined in the human embryonic kidney 293 (HEK-293) cells overexpressing these transporters, respectively, which function was determined with metformin, a classical substrate for OCTs and MATEs (Wang et al., 2002; Shu et al., 2007; Shu et al., 2008; Tsuda et al., 2009; Chen et al., 2010; Li et al., 2011). We then investigate the in vivo inhibition by ondansetron by conducting the pharmacokinetics of metformin in wild-type and Mate1−/− mice. Lastly, the renal function was assessed in the mice received cisplatin with and without ondansetron.
Materials and Methods
Chemicals and Reagents
The Flp-In transfection system, Dulbecco’s modified Eagle’s medium (DMEM), PBS, Lipofectamine 2000, hygromycin, Opti-MEM reduced serum medium, TRIzol, and fetal bovine serum were purchased from Invitrogen. The full length cDNAs of human OCT2 (hOCT2), human MATE1 (hMATE1), mouse Oct2 (mOct2) and mMate1 were obtained from Thermo Scientific Inc. (Waltham, MA). The full length cDNA of hMATE2k was purchased from Origene Inc. (Rockville, MD). The pcDNA5-hOCT2, -hMATE1, mOct2, -mMate1, and -hMATE2k were constructed by subcloning the full length cDNAs of these transporter genes into pcDNA5 empty vector. All HEK-293 Flp-In cells stably expressing these transporters were established by selection against hygromycin (75 μg/ml) according to the Flp-In transfection system instruction (Invitrogen). The overexpression of the transporter genes of interest was confirmed by RT-PCR and functional tests. [14C]-metformin was purchased from Moraved Biochemicals and Radiochemicals (Brea, CA). Cisplatin, ondansetron, and unlabeled metformin were obtained from Sigma Chemical Co. LLC. (St. Louis, MO). All other reagents and compounds except those specifically described below were commercially available and of reagent grade or better.
Cell Culture
HEK-293 cells stably overexpressing transporters and mock HEK-293 cells were cultured in DMEM supplemented with 10% fetal bovine serum, 100 U/mL penicillin, 100 μg/mL streptomycin, and 75 μg/mL hygromycin, and were maintained in 75-cm2 plastic flasks at 37°C in a humidified atmosphere with 5% CO2.
In Vitro Transporter Inhibition Assay
All drug accumulation inhibition experiments were conducted on monolayer cultures in bio-coated 24-well plates at 37°C. 25×104 cells were plated in each well at 18–24 hours prior to the accumulation inhibition assay. For the experiments of OCT inhibition, KRH buffer (125 mM NaCl, 4.8 mM KCl, 1.2 mM CaCl2, 1.2 mM MgSO4, 1.2 mM KH2PO4, 25 mM HEPES, 5.6 mM glucose, pH 7.4) was used. The cells were washed once with pre-warmed KRH buffer. After incubation with KRH buffer containing different concentration of ondansetron with 10 μM [14C]-metformin plus 40 μM unlabeled metformin for 10 minutes, the uptake was halted by removing the KRH buffer and washing the cells with ice-cold KRH buffer 3 times.
For the experiments of MATE inhibition, a K+ based buffer (KBB) was used, which consisted of 140 mM KCl, 0.4 mM KH2PO4, 0.8 mM MgSO4, 1.0 mM CaCl2, 25 mM glucose, and 10 mM HEPES, pH 7.4. MATE transporters (rodents and humans) are bi-directional transporters per se, depending on the direction of its driving force of electrochemical gradient across the membrane. They may serve as excretion transporters in vivo in the liver and kidney because they are localized to the apical membrane of hepatocytes and proximal tubular cells, respectively. However, when characterizing their function in vitro in heterogeneously expression systems, uptake studies are conducted using an artificial intracellular acidic environment caused by pre-incubation with NH4Cl (Otsuka et al., 2005). Before uptake assays, cells were washed with pre-warmed K+ based buffer and then incubated in K+ based buffer containing 30 mM NH4Cl for 10 min at 37°C, and thereafter incubated in the uptake buffer (NH4Cl-free) for another 5 minutes, and changed to the uptake buffer containing a series of concentrations of inhibitors with 10 μM [14C]-metformin plus 40 μM unlabeled metformin for 10 minutes. Assays were stopped by addition of ice-cold substrate-free uptake buffer, and the cells were washed 3 times. Cells were solubilized in 0.1N sodium hydroxide (NaOH). The plate was shaken for 30 minutes and added 0.1N hydrochloric acid (HCL) to neutralize the buffer. 300 μl cell lysate was transferred to scintillation tube containing 3 ml Biodegradable Counting Cocktail buffer (Fisher Scientific Inc., Pittsburgh, PA). Radioactivity was counted by a multi-purpose scintillation counter (Beckman LS6500 Counter, Brea, CA). Protein concentrations were measured using a BCA protein assay kit (Bio-Rad Co. Hercules, CA), which was used for normalizing radioactivity values.
Animals
Mate1+/− mice were generated and backcrossed with C57BL/6J for at least 5 generations as described previously (Li et al., 2011). Mate1+/− breeding pairs were set up to obtain wild-type (Mate1+/+) and mutants (Mate1−/−) for experiments. All mice used in the experiments have the same genetic background (C57BL/6J) between 10–12 weeks of age. Animals were housed in a temperature controlled environment with a 12-hour light cycle and were given a standard diet and water ad libitum. All procedures were carried out in accordance with NIH guidelines for animal experimentation and were approved by the Institutional Animal Care and Use Committee (IACUC) of the School of Pharmacy, University of Maryland Baltimore.
Metformin Accumulation in the Kidney and Liver
Effect of ondansetron on tissue accumulation of metformin in wild-type mice
Wild-type mice at age of 10–12 weeks were divided into 5 groups (n = 6/group). Saline and four doses of ondansetron, 0, 1.6, 4.8, 6.4, and 20 mg/kg, were given intraperitoneally to the mice in each group. Thirty minutes later, all of the mice were injected intraperitoneally with 7.5 mg/kg metformin (containing 1/20 14C-metformin). Another 30 minutes later, mice were sacrificed. The time point was chosen based on a pilot study and the pharmacokinetic profile of metformin. We wanted to choose a time point at which metformin had completed the absorption phase while having enough circulation concentrations to maximize our chances to detect the concentrations in different tissues. The 30 minute point met the criteria and only one time point was chosen to save animals. The livers and kidneys were isolated, gently washed, weighed and submerged in PBS, which were further homogenized completely. The homogenized tissues were centrifuged at 15,000 rpm for 10 minutes and the radioactivity in the supernatant was counted at multiple-purpose scintillation machine (Beckman LS6500 Counter, Brea, CA). Effect of ondansetron on tissue accumulation of metformin in Mate1+/+ and Mate1−/− mice: Mate1+/+ and Mate1−/− mice at age of 10–12 weeks were injected with 0.9% saline or 6.4 mg/kg ondansetron (n = 6/group) via intraperitoneal injection. Other procedures are the same as described above.
Metformin Pharmacokinetic Study in Mice
Mate1+/+ and Mate1−/− mice at age of 10–12 weeks were given 0.9% saline (n = 6) or 6.4 mg/kg ondansetron (n = 6) via intraperitoneal injection. Thirty minutes later, all of the mice were injected with 7.5 mg/kg metformin (containing 1/20 [14C]-metformin). Blood samples were collected at 0, 8, 15, 30, 45, 60, 90, and 120 minutes after metformin injection. Blood samples were centrifuged at 8000 rpm for 10 min at 4°C and 6 μl of plasma were added into 2 ml scintillation buffer. The radioactivity in the plasma was counted at a multiple-purpose scintillation counter (Beckman LS6500 Counter, Brea, CA). WinNonlin version 5.2.1 (Pharsight; Sunnyvale, CA) was used to analyze the serum concentration-time profiles of metformin in mice. Pharmcokinetic parameters and the area under the serum concentration-time curve from time 0 to infinity (AUC∞) were calculated by the nonlinear least-squares method. The AUC until 120 minutes (AUC0–120) was determined by the trapezoidal rule.
Platinum Accumulation in the Kidney and Liver
Six Mate1+/+ and 6 Mate1−/− mice were injected with 0.9% saline, and the other 6 Mate1+/+ mice were injected with 6.4 mg/kg ondansetron dissolved in 0.9% saline. Thirty minutes later, all of the mice were injected with 10 mg/kg cisplatin in 0.9% saline. All injections were performed via intraperitoneal. The mice were sacrificed at 8 hours after cisplatin injection. The kidneys and livers were dissected and 20 mg of tissues was added with 100 μl 70% nitric acid, and incubated at 65°C for at least 3 hours. The tissue lysate was centrifuged at 12,000 rpm for 10 min, and 50 μl supernatant was diluted by adding 450 μl internal control solution of mass spectrometry analysis containing 10 ng/ml iridium and 0.1% triton-X-100 (Zhang et al., 2006). The platinum content was measured by inductively coupled plasma mass spectrometry in the Analytical Facility at the University of California at Santa Cruz (Santa Cruz, California).
Cisplatin Toxicity Study
Mate1+/+ mice assigned to 4 groups (Groups 1, 3–5) and Mate1−/− mice (Groups 2 and 6) were enrolled in cisplatin toxicity study (4–10 mice/group). Previous studies have shown that the mice with Mate1 deficiency have normal renal function but more susceptible to cisplatin-induced nephrotoxicity (Nakamura et al., 2010). Thus, the group 6 of Mate1−/− mice served as a positive control showing the role of Mate1 in cisplatin nephrotoxicity. In day one, the first, the second, the fourth, and the sixth group of mice were injected with saline, and the other two groups with 6.4 mg/kg ondansetron dissolved in 0.9% saline. Thirty minutes later, except the first, the second, and the third group of mice that were injected with saline, all other three groups of mice (groups 4–6) were injected again with 10 mg/kg cisplatin dissolved in 0.9% saline. All injections were performed via intraperitoneal. The mice were sacrificed at 72 h after cisplatin injection. Blood samples were collected from the heart after anesthesia by 10 mg/kg Ketamine and 0.5 mg/kg Xyline. The blood was left at room temperature for 10 minutes for clotting, and then was centrifuged at 8,000 rpm for 10 minutes. The serum was taken and kept at −80°C for blood chemistry measurements as described below. One kidney and part of the liver from each mouse were collected and submerged immediately into 10% formalin saline buffer overnight at 4°C, and further processed to paraffin embedding and hematoxylin and eosin (H&E) staining. A fraction of kidney and liver tissues were also used for RNA extraction as described below.
Blood Biochemical Measurement after Cisplatin Treatment
Analysis of serum samples were performed by BioReliance Animal Health Services (Rockville, MD) using a fully automated clinical chemistry analyzer (COBAS 6000). Vendor Calibrators, controls and reagent C-pack were used to perform QC analysis and sample analysis.
Reverse Transcription and Real-time PCR
Total RNA was isolated from the kidney of mice using Trizol and phenol-chloroform method. The total RNA (2 μg) was reversely transcribed using a high capability reverse transcipt kit (Roche Applied Science, Indianapolis, IN). The reaction mixtures were diluted by 4 times and 1 μl was then used as the template for real-time PCR. The real-time PCR condition was: an initial 2-min incubation step at 50°C, then 3-min denaturation at 94°C, followed by 40 cycles of 2-step at 94°C for 30 s and 60°C for 60 s. Real-time PCR was performed on ABI PRISM 7700 (Applied Biosystems, Foster City, CA). The expression of biomarker genes for kidney injury, including Kim-1(Kidney injury molecular-1 protein) and Lcn2 (lipocalin 2 gene, encoding neutrophil gelatinase-associated lipocalin, NGAL) (Wang et al., 2008a; Wasilewska et al., 2010), and the housekeeper glyceraldehyde-3-phosphate dehydrogenase (Gapdh) gene were determined by real-time PCR.
Statistical Analysis
All data were expressed as the mean ± standard deviation (SD). Observed inhibitory constant (Ki) was calculated through nonlinear regression using WinNonlin (Pharsight; Sunnyvale, CA). Data were analyzed statistically using the unpaired Student’s t test and the one-way analysis of variance (ANOVA) followed by Dunnett’s test, when appropriate. A P value of < 0.05 was considered statistically significant.
Results
Ondansetron is a much more potent MATE inhibitor than OCT in vitro
Ondansetron has been previously characterized as an inhibitor towards human OCTs and MATEs in high-throughput screenings against a prescription drug library (Kido et al., 2011; Wittwer et al., 2013). In this study, we firstly sought to validate the interaction of ondansetron with OCT2, MATE1, and MATE2-K, using metformin as the probe substrate towards these transporters (Motohashi and Inui, 2013). As indicated by the mRNA expression levels (Fig. 1A) and the function tests with the substrate metformin (Fig. 1B), the stable HEK-293 cells highly expressing OCT2, MATE1, and MATE2-K, respectively, were successfully established. Using these cell lines, we conducted the assays to determine the inhibitory potencies of ondansetron on metformin accumulation mediated by human OCT2, MATE1, and MATE2-K. In the concentration range tested (0–50 μM), ondansetron could achieve more than 50% inhibition on these three transporters (Fig. 1C, 1D & 1E). However, ondansetron showed a much more potent inhibition on MATE1 and MATE2-K than OCT2. The inhibitory potency was 109-fold and 257-fold higher on MATE1 (Ki: 0.035 μM) and MATE2-K (Ki: 0.015 μM) than for OCT2 (Ki: 3.85 μM), respectively
Figure 1. Ondansetron is a more potent inhibitor of human MATEs than that of human OCT2 in vitro.
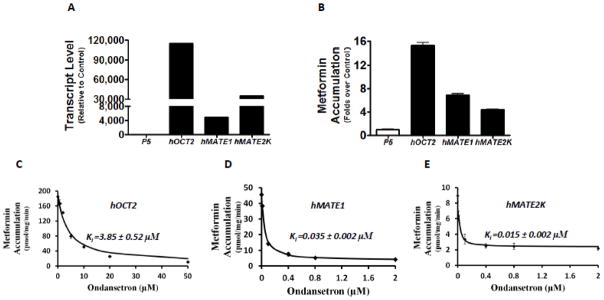
A. The mRNA levels of human OCT2 (hOCT2), human MATE1 (hMATE1), and human MATE2-K (hMATE2-K) in the stable cell lines overexpressing these transporter genes, and the empty vector (p5), respectively. The mRNA levels were determined by RT-PCR and shown as relative to the levels of transporter genes in the control cells transfected with p5 empty vector. B. The accumulation of metformin in the stable cell lines overexpressing hOCT2, hMATE1, hMATE2-K, and the empty vector (p5). C–E. The concentration-dependent inhibition of metformin accumulation by ondansetron in the stable cell lines overexpressing hOCT2 (C), hMATE1 (D), and hMATE2-K (E), respectively. Metformin (50 μM, including 10 μM 14C radiolabeled metformin and 40 μM non-radiolabeled), a characterized substrate for the studied transporters, was incubated with and without various concentrations of ondansetron for 10 minutes. C–E: The inhibition constant (Ki) of ondansetron for each transporter studied was calculated and shown in the figure. As indicated by the X axis, higher concentrations of ondansetron were needed to achieve similar inhibition on hOCT2 than hMATE1 and hMATE2-K.
It is unknown whether ondansetron treatment has an effect on the disposition of the cationic drugs transported by OCTs or MATEs in vivo. Prior to testing in vivo in mice as described below, we determined if ondansetron could significantly inhibit the activities of mouse homologs of Oct2 and Mate1 as well. The HEK-293 cells overexpressing mouse Oct2 and Mate1 were constructed (Fig. 2A & 2B). Metformin accumulation mediated by both mOct2 and mMate1were subject to ondansetron inhibition, with a much greater potency by ondansetron on mMate1 (Ki: mOct2 3.5 μM; mMate1 0.07 μM) (Fig. 2C & 2D). There was a slight species difference in the inhibitory potency of ondansetron on MATEs. It seemed that ondansetron was a little more potent inhibitor towards human MATEs (MATE1 and MATE2-K) than mouse homolog (only mMate1 has been identified in mouse kidney). Overall, the in vitro data suggested that mice may be an appropriate model to examine the drug-drug interactions resulted from the functional alteration of OCTs and MATEs by ondansetron.
Figure 2. Ondansetron is a more potent inhibitor of mouse Mate1 than that of mouse Oct2 in vitro.

A. The mRNA levels of mouse Oct2 (mOct2) and mouse Mate1 (mMate1) in the stable cell lines overexpressing these transporter genes and the empty vector (p5), respectively. The mRNA levels were determined by RT-PCR and shown as relative to the levels of transporter genes in the control cells transfected with p5 empty vector. B. The accumulation of metformin in the stable cell lines overexpressing mOct2, mMate1, and the empty vector (p5). C–D. The concentration-dependent inhibition of metformin accumulation by ondansetron in the stable cell lines overexpressing mOct2 (C) and mMate1 (D), respectively. Metformin (50 μM, including 10 μM 14C radiolabeled metformin and 40 μM non-radiolabeled), a characterized substrate for the studied transporters, was incubated with and without various concentrations of ondansetron for 10 minutes. C & D: The inhibition constant (Ki) of ondansetron for each transporter studied was calculated and shown in the figure. As indicated by the X axis, higher concentrations of ondansetron were needed to achieve similar inhibition on mOct2 than mMate1.
Ondansetron inhibits the function of cationic drug transporters in vivo
To explore whether the inhibition by ondansetron on MATEs and OCTs in vitro could be translated to an altered drug disposition in vivo, we studied the effect of ondansetron on metformin disposition in mice. The mice were given different doses of ondansetron along with metformin. We focused on the kidney and liver which are highly expressed of OCTs and MATEs (Gorboulev et al., 1997; Otsuka et al., 2005). The accumulation of metformin in the kidney and liver was increased by ondansetron in a dose-dependent manner. The accumulation of metformin in the kidney at ondansetron doses of 1.6, 4.8, 6.4 and 20 mg/kg were 117 ± 63.0, 190 ± 23.1 (P = 0.012), 236 ± 27.3 (P = 0.003) and 265 ± 64 ng/g (P = 0.010), respectively, compared to the non-ondansetron-treated group (125 ± 27.7 ng/g) (Fig. 3A). The accumulation of metformin in the liver at ondansetron doses of 1.6, 4.8, 6.4 and 20 mg/kg were 36.3 ± 6.05, 51.7 ± 8.99 (P = 0.004), 53.5 ± 5.51 (P = 0.001) and 75.5 ± 5.96 ng/g (P < 0.001), respectively, compared to the group without ondansetron treatment (28.8 ± 4.74 ng/g) (Fig. 3B).
Figure 3. Ondansetron dose-dependently alters the disposition of metformin, a prototypical substrate of cationic drug transporters, in mice.

A & B. Effects of ondansetron treatment on tissue accumulation of metformin in mouse kidney (A) and liver (B). C. Serum concentration profile of metformin in wild-type mice received ondansetron as compared to those received saline. Wild-type mice (n = 6/group) at age of 10–12 weeks were given 0.9% saline or different doses of ondansetron (6.4 mg/kg in the pharmacokinetic study) via intraperitoneal injection. Thirty minutes later, all of the mice were injected with 7.5 mg/kg metformin (containing 1/20 14C-metformin). A & B: the tissues were collected at 30 minutes after metformin injection. C: the blood samples were collected before and up to 2 hours after metformin injection. *P < 0.05, **P < 0.01, significantly different from the saline control (0 mg/kg ondansetron).
The remarkable increase in metformin accumulation by ondansetron in the kidney and the liver prompted us to examine whether ondansetron could alter the overall pharmacokinetic profile of metformin in mice. We chose the dose of 6.4 mg/kg ondansetron which was clinically relevant to those in patients based on body surface scaling between mice and humans (Sharma and McNeill, 2009). The plasma concentrations of metformin at time points of 15, 30, and 45 minutes after metformin treatment were significantly elevated in the mice received ondansetron treatment, compared to those treated with saline (P < 0.05, Fig. 3C). Consistently, other critical pharmacokinetic parameters of metformin were also altered in the ondansetron treatment group (Tab. 1). The area under time-concentration curve from metformin injection (time 0) to mouse sacrifice (time 120 minutes) (AUC0–120min) for ondansetron treatment group was significantly increased by 31% when compared with that in saline treatment group (160 ± 8.46 vs. 122 ± 17.4, μg·min/mL, P = 0.008). The maximal serum concentrations (Cmax) in ondansetron and saline treatment groups were 3.71 and 2.72 μg/ml, respectively, increasing 36% in the former (P = 0.07). However, the time to Cmax between the two groups of mice did not show any statistical significance (30.1 ± 5.06 vs. 34.0 ± 7.17 minutes, P = 0.41). By studying the disposition of metformin, a classical substrate towards OCTs and MATEs, our data suggested that ondansetron might inhibit the function of cationic drug transporters in vivo.
Table 1.
Effect of ondansetron treatment on the pharmacokinetic parameters of metformin in Mate1+/+ (Wild-type, Wt) and Mate1−/− mice. Mate1+/+ and Mate1−/− mice (n = 6/group) at age of 10–12 weeks were given 0.9% saline or 6.4 mg/kg ondansetron via intraperitoneal injection. Thirty minutes later, all mice were injected with 7.5 mg/kg metformin (containing 1/20 [14C]-metformin). Blood samples were collected before and up to 2 hours after metformin injection.
| Parameters |
Mate1 +/+
|
P |
Mate1 −/−
|
P |
P: +/+ vs. −/−
|
|||
|---|---|---|---|---|---|---|---|---|
| Saline | Ond | Saline | Ond | Saline | Ond | |||
| AUC0–120 (μg/ml/min) | 122 ± 17.4 | 160 ± 8.46 | 0.008 | 235 ± 13.0 | 279 ± 35.7 | 0.059 | <0.001 | 0.001 |
| Cmax (μg/ml) | 2.72 ± 0.43 | 3.71±0.79 | 0.070 | 4.29 ± 0.92 | 4.35 ± 0.50 | 0.920 | 0.021 | 0.223 |
| T1/2 (min) | 34.0 ± 7.17 | 30.1 ± 5.06 | 0.411 | 38.1 ± 6.30 | 44.4 ± 7.73 | 0.258 | 0.417 | 0.021 |
Ondansetron potently inhibits Mate1 function in mice
To ascertain which cationic drug transporter was mainly inhibited by ondansetron in vivo, we further examined the effect of ondansetron treatment on the pharmacokinetics of metformin in Mate1−/− mice in comparison to wild-type mice. As demonstrated in the dose-dependent studies above, metformin accumulation in the kidney and the liver was significantly increased by ondansetron (6.4 mg/kg) treatment in the wild-type mice (ondansetron vs. saline; kidney, 236 ± 27.2 vs. 114 ± 21.8 ng/g, P = 0.004; liver, 52.1 ± 13.8 vs. 16.3 ± 6.67 ng/g, P = 0.016; Fig. 4A & 4B). However, ondansetran treatment did not alter the accumulation of metformin in the kidney and the liver in the Mate1−/− mice (ondansetron vs. saline; kidney, 957 ± 97.5 vs. 917 ± 89.6 ng/g, P = 0.512; liver, 138 ± 19.7 vs. 137 ± 47.8 ng/g, P = 0.980; Fig. 4A & 4B). Consistent with previous reports that Mate1 plays an important role in the disposition of cationic drugs in mice (Omote et al., 2006; Lickteig et al., 2008), the accumulation of metformin in the kidney and the liver was remarkably different between the wild-type and Mate1−/− mice.
Figure 4. Mate1 mediates the pharmacokinetic interaction between ondansetron and metformin in mice.

A & B. Effects of ondansetron treatment on tissue accumulation of metformin in the kidney (A) and the liver (B) of Mate1+/+ (Wild-type, Wt) and Mate1−/− mice. C. Serum concentration profile of metformin in Mate1−/− mice received ondansetron as compared to those received saline. Wt and Mate1−/− mice (n = 6/group) at age of 10–12 weeks were given 0.9% saline or 6.4 mg/kg ondansetron via intraperitoneal injection. Thirty minutes later, all of the mice were injected with 7.5 mg/kg metformin (containing 1/20 14C-metformin). A & B: the tissues were collected at 30 minutes after metformin injection. C: the blood samples were collected before and up to 2 hours after metformin injection. *P < 0.05, **P < 0.01, significantly different from the saline control (no ondansetron).
Furthermore, while ondansetron treatment significantly changed the pharmacokinetics of metformin in the wild-type mice (Fig. 3C), it had little effect in Mate1−/− mice (Fig. 4C). The AUC0–120min in Mate1−/− mice with ondansetron treatment showed no statistical difference from those with saline treatment (279 ± 35.7 vs. 235 ± 13.0 μg/ml/min, P > 0.05, Tab. 1). Other pharmacokinetic parameters such as Cmax and T1/2 did not show any differences between ondansetron and saline treatment in the Mate1−/− mice either. However, as expected, the Mate1−/− mice exhibited a remarkable difference in metformin pharmacokinetics when compared to the wild-type mice (Table 1). The AUC of metformin was significantly larger in the Mate1−/− mice than that in the wild-type mice, with and without ondansetron treatment (Mate1−/− vs. wild-type; Saline, 235 ± 13.0 vs. 123 ± 17.4 μg/ml/min; P < 0.001; Ondansetron, 279 ± 35.7 vs. 160 ± 8.46, P = 0.001, Tab. 1). The data showed the important role of MATEs in cationic drug disposition.
Ondansetron increases renal accumulation of cisplatin in mice
Cisplatin has been reported to be transported by OCTs and MATEs (Filipski et al., 2008; Nakamura et al., 2010). Clinically, cisplatin is frequently prescribed together with ondansetron to prevent cisplatin-induced nausea and vomiting in patients. The above in vitro and in vivo data, and particularly the effect of ondansetron on metformin accumulation in the kidney, prompted us to firstly determine if ondansetron treatment would lead to altered cisplatin disposition in the kidney.
Nakamura et al. (2010) have previously reported that enhanced renal toxicity by cisplatin in Mate1−/− mice results from increased accumulation of cisplatin in the kidney. Consistently, in the present study we observed that renal accumulation of platinum in Mate1−/− mice was significantly greater by 27% than that in Mate1+/+ mice at 8 hours after the mice received cisplatin treatment (13.3 ± 2.01 vs. 10.5 ± 1.02 ng/mg, P = 0.011). As expected, platinum accumulation in the kidney was also significantly increased by 23% by ondansetron (6.4 mg/kg) in the wild-type mice of cisplatin treatment (ondansetron vs. saline; 12.9 ± 0.96 vs. 10.5 ± 1.02 ng/mg; P = 0.001). Notably, the magnitude of increase in platinum renal accumulation by the ondansetron treatment was similar to that by Mate1 deficiency (Fig. 5). However, unlike metformin accumulation in the liver, we did not observe a significant effect on hepatic platinum accumulation by either ondansetron treatment or Mate1 deficiency (data not shown). This might be due to the fact that cisplatin is a weaker substrate of OCTs and MATEs as compared to metformin (Motohashi and Inui, 2013). Overall, the data suggested that ondansetron treatment might enhance the accumulation of cisplatin in the kidney via its inhibition on Mate1 in mice.
Figure 5. Ondansetron increases platinum (Pt) accumulation in the kidney in the mice received cisplatin treatment.
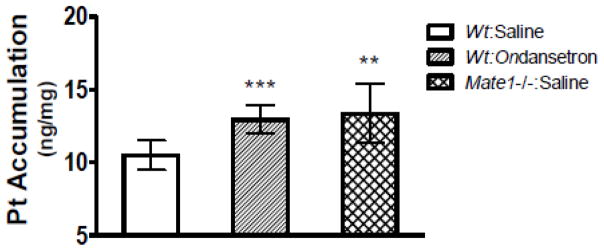
The wild-type (Wt) and Mate1−/− mice (n = 6/group) at age of 10–12 weeks were given 0.9% saline or ondansetron (6.4 mg/kg) via intraperitoneal injection. Thirty minutes later, all mice were injected with 10 mg/kg cisplatin. The kidney tissues were collected at 8 hours after cisplatin injection. **P < 0.01, ***P < 0.005, significantly different from the wild-type mice received saline injection.
Ondansetron may enhance cisplatin-induced nephrotoxicity via inhibition on Mate1 in mice
We subsequently studied the effect of ondansetron treatment on cisplatin-induced nephrotoxicity in mice. Ondansetron alone did not show any toxicity in mice during our toxicity study (Fig. 6 & 7 and Table 2). Body weights were reduced by the administration of cisplatin in the mice. However, no effect by ondansetron treatment on cisplatin-induced weight loss was observed (data not shown). We examined the blood biochemical in the mice received cisplatin treatment with and without ondansetran treatment. To ascertain the role of Mate1, both wild-type and Mate1−/− mice were used. Mate1 deficiency alone did not cause any apparent renal functional insufficiency (Fig. 6 & 7 and Table 2). Ondansetron treatment increased the serum levels of creatinine and BUN, two biomarkers of kidney injury, in the wild-type mice received cisplatin (10 mg/kg) treatment (Fig. 6A & 6B). The levels of creatinine and BUN were also higher in the Mate1−/− mice than those in the wild-type mice when both groups were given cisplatin treatment. Notably, ondansetron treatment and Mate1 genetic deficiency had similar effects, suggesting that the effect by ondansetron treatment might be via its inhibition on Mate1 function. Other blood biochemicals, such as total protein, albumin, glucose, and CO2, also indicated that both ondansetron treatment and Mate1 genetic deficiency enhanced the toxicity associated with cisplatin treatment (Table 2).
Figure 6. Increased cisplatin-induced nephrotoxicity by ondansetron is likely mediated by Mate1 in mice.
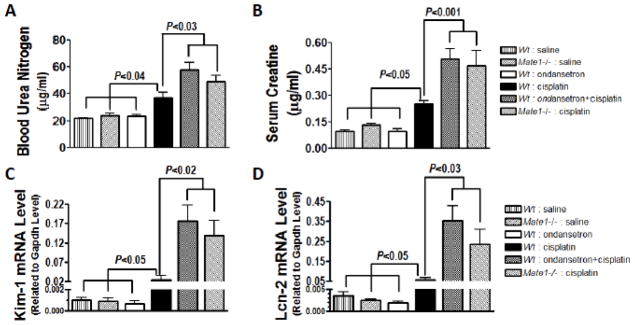
A & B. The levels of serum biomarkers of kidney injury in Mate1+/+ (Wild-type, Wt) and Mate1−/− mice received cisplatin or saline with and without ondansetron. A: Serum creatinine; B: Blood urea nitrogen (BUN). C & D. The levels of molecular biomarkers of kidney injury in Wt and Mate1−/− mice received cisplatin or saline with and without ondansetron. C: The transcript levels of Kim-1 (Kidney injury molecular-1 protein); D: The transcript levels of Lcn-2 (lipocalin 2 gene, encoding neutrophil gelatinase-associated lipocalin, NGAL). The mRNA levels were determined by RT-PCR and shown as relative to the levels of glyceraldehyde-3-phosphate dehydrogenase (Gapdh) transcripts. Wt and Mate1−/− mice (n = 6–10/group) were injected intraperitoneally with 0.9% saline or 6.4 mg/kg ondansetron dissolved in 0.9% saline. Thirty minutes later, the mice were injected with 0.9% saline or 10 mg/kg cisplatin in 0.9% saline. The mice were sacrificed at 72 h after cisplatin injection.
Figure 7. Renal histology in Wt and Mate1−/− mice received cisplatin with and without ondansetron.
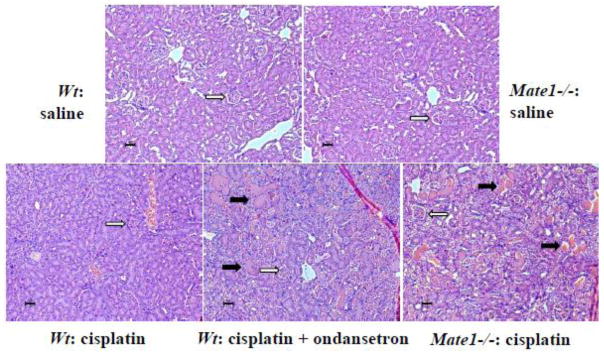
The solid black arrows represent sever necrosis containing eosinophilic amorphous material and pyknotic debris. The open arrows indicate the structure of glomerulus. The black scale bar represents 10 μm. Experimental procedures on animals are the same as those described in Figure 6 legend.
Table 2.
Effect of ondansetron treatment on the blood biochemical measurements in Mate1+/+ and Mate1−/− mice. Mate1+/+ (Wild-type, Wt) and Mate1−/− mice (n = 6–10/group) were injected intraperitoneally with 0.9% saline or 6.4 mg/kg ondansetron dissolved in 0.9% saline. Thirty minutes later, the mice were injected with 0.9% saline or 10 mg/kg cisplatin in saline. The mice were sacrificed at 72 h after the second saline or cisplatin injection. Blood samples were collected from the heart and the biochemical measurements in the serum were conducted by using a clinical chemistry analyzer. Co-administration of cisplatin and ondansetron significantly increased overall cisplatin toxicity in the mice.
| Parameters | Mate1+/+ | Mate1−/− | Mate1+/+ | Mate1+/+ | Mate1+/+ | Mate1−/− |
|---|---|---|---|---|---|---|
|
| ||||||
| Saline | Saline | Ond | Cis | Ond + Cis | Cis | |
| TP (g/dL) | 4.4 ± 0.1 | 4.4 ± 0.2 | 4.2 ± 0.2 | 4.5 ± 0.3 | 3.9 ± 0.2### | 3.5 ± 0.3&&& |
| Albumin (g/dL) | 3.0 ± 0.1 | 3.1 ± 0.2 | 2.8 ± 0.1 | 3.1 ± 0.2 | 2.5 ± 0.1### | 2.1 ± 0.5&&& |
| ALP (U/L) | 87 ± 15 | 66 ± 5.9 | 103 ± 36 | 87 ± 10 | 95 ± 11 | 98 ± 22 |
| AST (U/L) | 74 ± 34 | 65 ± 30 | 97 ± 48 | 106 ± 30 | 155 ± 49 | 135 ± 64 |
| ALT (U/L) | 28 ± 8.9 | 43 ± 45 | 33 ± 13 | 38 ± 19 | 59 ± 11 | 49 ± 18 |
| Tbili (mg/dL) | 0.13 ± 0.05 | 0.08 ± 0.05 | 0.13 ± 0.06 | 0.2 ± 0.1 | 0.2 ± 0.1 | 0.1 ± 0.0 |
| a Glucose (mg/dL) | 321 ± 100 | 266 ± 56 | 468 ± 162 | 470 ± 33** | 398 ± 27 | 374 ± 9 |
| Creatinine (mg/dL) | 0.10 ± 0.02 | 0.13 ± 0.02 | 0.10 ± 0.03 | 0.25 ± 0.04** | 0.51 ± 0.13### | 0.47 ± 0.19&&& |
| BUN (mg/dL) | 22 ± 1.9 | 24 ± 4.0 | 24 ± 2.1 | 37 ± 9*** | 58 ± 13# | 49 ± 11& |
| Sodium (mEq/L) | 150 ± 2 | 151 ± 2 | 146 ± 4 | 146 ± 2 | 150 ± 1# | 149 ± 2 |
| Potassium (mEq/L) | 4.47 ± 0.55 | 4.23 ± 0.44 | 4.77 ± 1.46 | 5.21 ± 0.72 | 4.36 ± 0.80 | 4.27 ± 0.21 |
| Chloride (mEq/L) | 110 ± 2.4 | 111 ± 1.4 | 106 ± 3.1 | 106.1 ± 0.8 | 115.0 ± 2.2### | 118.1 ± 2.7&&& |
| Calcium (mEq/L) | 8.8 ± 0.3 | 8.5 ± 0.2 | 9.1 ± 0.4 | 9.0 ± 0.1 | 9.4 ± 0.5 | 9.3 ± 0.1 |
| CO2 (mmol/L) | 21.4 ± 4.1 | 21.9 ± 2.2 | 24.3 ± 1.6 | 21.1 ± 1.4 | 17.7 ± 1.0 | 18.1 ± 1.3 |
glucose levels may not be accurate. The mice were not fasted, and hemolysis was noticed in the serum samples.
P < 0.05;
P < 0.01;
P < 0.005
Mate1+/+ mice treated with cisplatin (Cis) compared to those with saline.
Mate1+/+ mice treated with ondansetron plus cisplatin (Ond + Cis) compared to those with cisplatin (Cis) only.
Mate1−/− mice treated with cisplatin (Cis) compared to Mate1+/+ mice with cisplatin (Cis).
Note: Ond, ondansetron; Cis, cisplatin; TP, total protein; ALP, alkaline phosphatase; AST, aspartate aminotransferase; ALT, alanine aminotransferase; Tbili, total bilirubin; BUN, blood urea nitrogen.
We then examined the molecular biomarkers of kidney injury in the mice received cisplatin treatment with and without ondansetran treatment. The total RNA was extracted from the kidney. The transcript levels of the Kim-1 and Lcn2 genes, as indicators of acute kidney injury (Wang et al., 2008a; Wasilewska et al., 2010), were apparently elevated by cisplatin treatment in the wild-type mice. The elevations were significantly enhanced by either ondansetron treatment or Mate1 genetic deficiency (Fig. 6C & 6D). Consistent with the results of biochemical biomarkers, ondansetron treatment and Mate1 deficiency had similar effects on cisplatin-induced elevation on the two molecular biomarkers.
Lastly, we examined the kidney histology in the mice received cisplatin treatment with and without ondansetran treatment (Fig. 7). Histopathologic evaluation indicated that cisplatin (10mg/kg) treatment alone caused tubular dilation, tubular cell swelling, interstitial space narrowing, glomerulus shrinking, and occasionally spots of necrosis containing eosinophilic amorphous material. However, the overall histological structure such as glomerulus was still intact. The mouse kidney from the combination treatment of cisplatin and ondansetron showed severe tubular structure broken, glomerulus shrinking, and frequent spots of necrosis with eosinophilic amorphous material and pyknotic debris. The Mate1−/− mice treated with cisplatin exhibited similar characteristic damages in the kidney as those in the Mate1+/+ mice treated with cisplatin plus ondansetron. In summary, our toxicology data indicated that ondansetron enhanced the kidney injury associated with cisplatin treatment in mice, and the enhancement was likely via its inhibition of Mate1 function.
Discussion
This study was designed to investigate whether co-administration of ondansetron increased the possibility of nephrotoxicity during the treatment by cisplatin which is a substrate for cationic drug transporters including OCTs and MATEs. Ondansetron was determined in vitro to be a potent MATE inhibitor and a mild OCT inhibitor. This was then studied in vivo in mice. For the first time, we demonstrated that ondansetron may alter the in vivo disposition of cationic drugs mainly via its inhibition of MATE function. Given that ondansetron and other structurally similar 5-HT3 receptor antagonists are widely prescribed as antiemetic agents, particularly for the treatment of nausea and vomiting associated with chemotherapy, our data have important clinical implication as these 5-HT3 receptor antagonists may serve as perpetrators to cause undesirable drug-drug interactions (DDIs). This is corroborated by our findings that co-administration of ondansetron enhances cisplatin-induced nephrotoxicity likely due to an inhibited Mate1 function in mice.
The DDIs occurring in the kidney have been increasingly recognized, which frequently involve the inhibition of transporters at the membrane of tubular cells, leading to the accumulation of victim drugs in the body and consequently potentiated pharmacological/adverse effects (Morrissey et al., 2013). The cationic transport system, consisting of the basolateral uptake transporters and the apical excretion transporters, is critical to renal secretion of oganic cationic compounds. It has been long believed that inhibition of the uptake transporters such as OCT2 mainly explains the renal DDIs caused by organic cations (Ciarimboli, 2011). However, recent understanding of the apical transporters put challenges on certain previous data interpretation (Koepsell et al., 2007; Nies et al., 2011). For example, cimetidine has been widely used as a research tool in vitro to inhibit OCT function and in vivo to investigate the tubular secretion of organic cations in human kidney. Ito et al. demonstrated recently that the inhibition of MATEs, but not OCTs, is a likely mechanism underlying the DDIs with cimetidine in renal elimination (Ito et al., 2012). The in vitro Ki of cimetidine for OCT2 (95 – 146 μM) is an order of magnitude higher than the plasma unbound concentrations (3.6 – 7.8 μM) of cimetidine. However, the Ki of cimetidine for MATEs falls well in the range of the plasma concentrations. These progresses in drug transporters have warranted evaluation of the apical transporters such as MATEs during renal DDIs.
In this study, we found that ondansetron is an inhibitor for both the basolateral OCT2 and the apical MATE1 and MATE2-K in cell cultures. However, the Ki values of ondansetron for MATE1 (0.035 μM) and MATE2-K (0.015 μM) were much lower than that for OCT2 (3.85 μM), by 109 and by 256 folds respectively, indicating that ondansetron is a much potent inhibitor for the formers than the latter. The plasma peak concentrations of ondansetron in patients has been reported to range from 0.10 to 0.42 μM from doses of 8 mg to 32 mg daily (Stout et al., 2010). A Ki value of at least more than one-tenth of Cmax has been suggested for the drug to cause a clinically recognizable interaction with another drug that is transported by the same transporter (Fenner et al., 2009). Based on the cellular inhibitory potencies, we estimate that a clinically relevant dose of ondansetron may significantly inhibit MATE function with a negligible inhibition on OCT2 function.
We demonstrated in wild-type mice that ondansetron, at a clinical relevant dose, increases the plasma concentrations and tissue accumulation of metformin which is a classical probe substrate for OCTs and MATEs. However, ondansetron did not have such effects in Mate1−/− mice. In humans, MATE1 is ubiquitously expressed with high expression in the kidney and the liver. MATE2-K is an additional functional MATE in human kidney (Komatsu et al., 2011). Mate1 is the only MATE detected in mouse renal tissues and the Mate1−/− mice may represent a model of deficiency in full renal MATE function in humans (Nakamura et al., 2010). The data together suggest that the pharmacokinetic interaction of ondansetron with metformin in vivo may be mainly mediated by MATE function. Likely, clinical doses of ondansetron, via the inhibition of MATEs, would affect the renal secretion and the canlicular excretion of certain cationic compounds, and consequently their system exposure and pharmacological effects. Given the widely clinical use of antiemetic ondansetron and other structurally similar 5-HT3 receptor antagonists including palonasetron, granisetron, tropiseton, alosetron, azasetron, and dolasetron, future work is needed to determine how important and extensive the MATE transporter-mediated DDIs are in those clinical settings.
In this study, we made an attempt to understand the clinical implication of ondansetron inhibition of MATEs by studying its effect on cisplatin-induced nephrotoxicity in mice. Nausea and vomiting are associated with cisplatin chemotherapy, which result in significant morbidity, adversely affect a patient’s quality of life, and lead to poor compliance with the treatment regimen. In the absence of antiemetic prophylaxis, cisplatin induces nausea and vomiting in virtually all patients (Roila et al., 2006). 5-HT3 receptor antagonists are commonly prescribed during cisplatin chemotherapy. These 5-HT3 receptor antagonists are regarded as safe agents with high therapeutic indexes. Nevertheless, limited evidence suggests that co-administration of ondansetron and cisplatin is associated with increased nephrotoxicity which is common among cancer patients receiving a cisplatin regimen. Ondansetron and tropisetron can interact with OCTs and MATEs as inhibitors (Molderings et al., 2003; Kido et al., 2011), although a validation has not been previously made in vivo. Cisplatin has been characterized as a substrate for OCTs and MATEs both in vitro and in vivo (Yokoo et al., 2007; Iwata et al., 2012; Yonezawa, 2012). The present study not only validated the potent inhibition of ondansetron on MATE function but also demonstrated that ondansetron did enhance cisplatin-induced nephrotoxicity, as indicated by blood chemistry, molecular biomarkers, and histological examination. Consistent with a previous report (Nakamura et al., 2010), cisplatin caused much more severe nephrotoxicity in our Mate1−/− mice in comparison to wild-type mice. Strikingly, ondansetron treatment and the genetic deficiency of Mate1 had rather similar effects on the nephrotoxicity associated with cisplatin treatment. When coupled with the potent inhibition by ondansetron of MATE function both in vitro and in vivo, our nephrotoxicity results indicated that ondansetron enhanced cisplatin-induced nephrotoxicity likely via MATE inhibition. Our current effort is to assess whether this antiemetic drug co-administrated with cisplatin has the potential to increase the risk of nephrotoxicity in patients.
Besides OCTs and MATEs, other renal tubular uptake or efflux transporters may be involved in the urinary excretion of cisplatin. The increased cisplatin-induced nephrotoxicity by ondansetron is also likely via the other transporters. It has been reported that the copper transporter 1 (Ctr1; Slc31a1), which is localized on the basolateral side of both proximal and distal tubular cells in the kidney, is involved in the accumulation of cisplatin into the kidney in mice (Skvortsov et al., 2012). Knock-down of Ctr1 expression by small interfering RNA was also associated with decreased cisplatin cellular accumulation in vitro. However, the specific nephrotoxicity associated with cisplatin may not be explained by Ctr1 as the transporter is ubiquitously expressed, including tumor tissues. Down-regulation of Ctr1 is considered as one of mechanisms of resistance to cisplatin treatment in tumor cells (Pabla et al., 2009; Kalayda et al., 2012). While Ctrl1 inhibition seems to have a protective role in cisplatin-induced nephrotoxicity, the anticancer effect of cisplatin may be compromised as well. Pharmacological inhibition of OCTs, specifically OCT2, has been suggested as an effect approach to ameliorate cisplatin-induced nephrotoxicity (Zhang and Zhou, 2012). In contrast, the present study indicated that a potent MATE inhibitor could enhance the nephrotoxicity. Therefore, the interaction with different cisplatin transporters should be cautiously evaluated when we develop a renoprotective agent for cisplatin-associated nephrotoxicity. It should also be noted that, despite the fact that the chemical structures of 5-HT3 receptor antagonists are similar, the individual drugs exhibit notable pharmacologic differences in their selectivity, potency, and pharmacokinetics (Samardzic et al., 1994). The inhibitory potencies of other 5-HT3 receptor antagonists on MATEs and other renal transporters and their effects on cisplatin-associated nephrotoxicity remain to be studied.
In summary, our in vitro data indicate that ondansetron has a more potent inhibition toward MATEs than OCT2. We further demonstrate that ondansetron can increase the plasma concentrations and renal accumulation of the cationic probe drug metformin primarily by its inhibition of MATEs. Importantly, the potent inhibition of MATEs by ondansetron may enhance the risk of nephrotoxicity associated with cisplatin treatment. Additional studies with other 5-HT3 receptor antagonists are warranted to assess the clinical implication of drug interactions via inhibition of renal transporters.
Highlights.
Nephrotoxicity significantly limits clinical use of the chemotherapeutic cisplatin.
The antiemetic ondansetron is frequently co-administrated with cisplatin.
Ondansetron was here demonstrated as a potent inhibitor of MATE transporters.
Ondansetron enhanced cisplatin nephrotoxicity likely via Mate1 inhibition in mice.
Ondansetron may increase patient risk of nephrotoxicity in cisplatin chemotherapy.
Acknowledgments
The present study was supported by the National Institute of General Medical Sciences of the National Institutes of Health (NIH) under Award R01GM099742 (Y.S.) and by the US Food and Drug Administration (FDA) under Award U01FD004320 (J.E.P, Y.S.). Qing Li and Wei Zhang received research support from National Natural Science Foundation (NNSF) of China (81001445, Q. L.; 81273595, W. Z.). The content is solely the responsibility of the authors and does not necessarily represent the official views of the NIH, FDA and NNSF.
Abbreviations
- OCT2
Organic cation transporter 2
- MATE1/2
Multidrug and toxin extrusion 1/2
- MATE2-k
Human MATE2 isoforms (specific in the kidney)
- HEK-293
Human Embryonic Kidney Cell
- SNP
Single-nucleotide polymorphism
- BUN
Blood urea nitrogen
- 5-HT3
5-hydroxytryptamine-3
- AUC
Area under curve
- Kim-1
Kidney injury molecular-1 protein
- Lcn2
Lipocalin 2 gene
Footnotes
Conflict of Interest Statement
The authors declare that they have no financial or personal conflicts of interest that influenced, or could be perceived to have influenced, this work.
Publisher's Disclaimer: This is a PDF file of an unedited manuscript that has been accepted for publication. As a service to our customers we are providing this early version of the manuscript. The manuscript will undergo copyediting, typesetting, and review of the resulting proof before it is published in its final citable form. Please note that during the production process errors may be discovered which could affect the content, and all legal disclaimers that apply to the journal pertain.
References
- Arany I, Safirstein RL. Cisplatin nephrotoxicity. Semin Nephrol. 2003;23:460–464. doi: 10.1016/s0270-9295(03)00089-5. [DOI] [PubMed] [Google Scholar]
- Ayrton A, Morgan P. Role of transport proteins in drug discovery and development: a pharmaceutical perspective. Xenobiotica. 2008;38:676–708. doi: 10.1080/00498250801923855. [DOI] [PubMed] [Google Scholar]
- Chen L, Pawlikowski B, Schlessinger A, More SS, Stryke D, Johns SJ, Portman MA, Chen E, Ferrin TE, Sali A, Giacomini KM. Role of organic cation transporter 3 (SLC22A3) and its missense variants in the pharmacologic action of metformin. Pharmacogenet Genomics. 2010;20:687–699. doi: 10.1097/FPC.0b013e32833fe789. [DOI] [PMC free article] [PubMed] [Google Scholar]
- Ciarimboli G. Role of organic cation transporters in drug-induced toxicity. Expert Opin Drug Metab Toxicol. 2011;7:159–174. doi: 10.1517/17425255.2011.547474. [DOI] [PubMed] [Google Scholar]
- Fenner KS, Troutman MD, Kempshall S, Cook JA, Ware JA, Smith DA, Lee CA. Drug-drug interactions mediated through P-glycoprotein: clinical relevance and in vitro-in vivo correlation using digoxin as a probe drug. Clin Pharmacol Ther. 2009;85:173–181. doi: 10.1038/clpt.2008.195. [DOI] [PubMed] [Google Scholar]
- Filipski KK, Loos WJ, Verweij J, Sparreboom A. Interaction of Cisplatin with the human organic cation transporter 2. Clin Cancer Res. 2008;14:3875–3880. doi: 10.1158/1078-0432.CCR-07-4793. [DOI] [PubMed] [Google Scholar]
- Filipski KK, Mathijssen RH, Mikkelsen TS, Schinkel AH, Sparreboom A. Contribution of organic cation transporter 2 (OCT2) to cisplatin-induced nephrotoxicity. Clin Pharmacol Ther. 2009;86:396–402. doi: 10.1038/clpt.2009.139. [DOI] [PMC free article] [PubMed] [Google Scholar]
- Franke RM, Kosloske AM, Lancaster CS, Filipski KK, Hu C, Zolk O, Mathijssen RH, Sparreboom A. Influence of Oct1/Oct2-deficiency on cisplatin-induced changes in urinary N-acetyl-beta-D-glucosaminidase. Clin Cancer Res. 2010;16:4198–4206. doi: 10.1158/1078-0432.CCR-10-0949. [DOI] [PMC free article] [PubMed] [Google Scholar]
- Gorboulev V, Ulzheimer JC, Akhoundova A, Ulzheimer-Teuber I, Karbach U, Quester S, Baumann C, Lang F, Busch AE, Koepsell H. Cloning and characterization of two human polyspecific organic cation transporters. DNA Cell Biol. 1997;16:871–881. doi: 10.1089/dna.1997.16.871. [DOI] [PubMed] [Google Scholar]
- Hesketh PJ, Van Belle S, Aapro M, Tattersall FD, Naylor RJ, Hargreaves R, Carides AD, Evans JK, Horgan KJ. Differential involvement of neurotransmitters through the time course of cisplatin-induced emesis as revealed by therapy with specific receptor antagonists. Eur J Cancer. 2003;39:1074–1080. doi: 10.1016/s0959-8049(02)00674-3. [DOI] [PubMed] [Google Scholar]
- Ito S, Kusuhara H, Yokochi M, Toyoshima J, Inoue K, Yuasa H, Sugiyama Y. Competitive inhibition of the luminal efflux by multidrug and toxin extrusions, but not basolateral uptake by organic cation transporter 2, is the likely mechanism underlying the pharmacokinetic drug-drug interactions caused by cimetidine in the kidney. J Pharmacol Exp Ther. 2012;340:393–403. doi: 10.1124/jpet.111.184986. [DOI] [PubMed] [Google Scholar]
- Iwata K, Aizawa K, Kamitsu S, Jingami S, Fukunaga E, Yoshida M, Yoshimura M, Hamada A, Saito H. Effects of genetic variants in SLC22A2 organic cation transporter 2 and SLC47A1 multidrug and toxin extrusion 1 transporter on cisplatin-induced adverse events. Clin Exp Nephrol. 2012;16:843–851. doi: 10.1007/s10157-012-0638-y. [DOI] [PubMed] [Google Scholar]
- Kalayda GV, Wagner CH, Jaehde U. Relevance of copper transporter 1 for cisplatin resistance in human ovarian carcinoma cells. J Inorg Biochem. 2012;116:1–10. doi: 10.1016/j.jinorgbio.2012.07.010. [DOI] [PubMed] [Google Scholar]
- Kido Y, Matsson P, Giacomini KM. Profiling of a prescription drug library for potential renal drug-drug interactions mediated by the organic cation transporter 2. J Med Chem. 2011;54:4548–4558. doi: 10.1021/jm2001629. [DOI] [PMC free article] [PubMed] [Google Scholar]
- Koepsell H, Lips K, Volk C. Polyspecific organic cation transporters: structure, function, physiological roles, and biopharmaceutical implications. Pharm Res. 2007;24:1227–1251. doi: 10.1007/s11095-007-9254-z. [DOI] [PubMed] [Google Scholar]
- Komatsu T, Hiasa M, Miyaji T, Kanamoto T, Matsumoto T, Otsuka M, Moriyama Y, Omote H. Characterization of the human MATE2 proton-coupled polyspecific organic cation exporter. Int J Biochem Cell Biol. 2011;43:913–918. doi: 10.1016/j.biocel.2011.03.005. [DOI] [PubMed] [Google Scholar]
- Kuhlmann MK, Burkhardt G, Kohler H. Insights into potential cellular mechanisms of cisplatin nephrotoxicity and their clinical application. Nephrol Dial Transplant. 1997;12:2478–2480. doi: 10.1093/ndt/12.12.2478. [DOI] [PubMed] [Google Scholar]
- Li Q, Peng X, Yang H, Wang H, Shu Y. Deficiency of multidrug and toxin extrusion 1 enhances renal accumulation of paraquat and deteriorates kidney injury in mice. Mol Pharm. 2011 doi: 10.1021/mp200395f. [DOI] [PMC free article] [PubMed] [Google Scholar]
- Lickteig AJ, Cheng X, Augustine LM, Klaassen CD, Cherrington NJ. Tissue distribution, ontogeny and induction of the transporters Multidrug and toxin extrusion (MATE) 1 and MATE2 mRNA expression levels in mice. Life Sci. 2008;83:59–64. doi: 10.1016/j.lfs.2008.05.004. [DOI] [PMC free article] [PubMed] [Google Scholar]
- Masuda S, Terada T, Yonezawa A, Tanihara Y, Kishimoto K, Katsura T, Ogawa O, Inui K. Identification and functional characterization of a new human kidney-specific H+/organic cation antiporter, kidney-specific multidrug and toxin extrusion 2. J Am Soc Nephrol. 2006;17:2127–2135. doi: 10.1681/ASN.2006030205. [DOI] [PubMed] [Google Scholar]
- Matsushima S, Maeda K, Inoue K, Ohta KY, Yuasa H, Kondo T, Nakayama H, Horita S, Kusuhara H, Sugiyama Y. The inhibition of human multidrug and toxin extrusion 1 is involved in the drug-drug interaction caused by cimetidine. Drug Metab Dispos. 2009;37:555–559. doi: 10.1124/dmd.108.023911. [DOI] [PubMed] [Google Scholar]
- Molderings GJ, Bruss M, Bonisch H, Gothert M. Identification and pharmacological characterization of a specific agmatine transport system in human tumor cell lines. Ann N Y Acad Sci. 2003;1009:75–81. doi: 10.1196/annals.1304.008. [DOI] [PubMed] [Google Scholar]
- Morrissey KM, Stocker SL, Wittwer MB, Xu L, Giacomini KM. Renal transporters in drug development. Annu Rev Pharmacol Toxicol. 2013;53:503–529. doi: 10.1146/annurev-pharmtox-011112-140317. [DOI] [PubMed] [Google Scholar]
- Motohashi H, Inui K. Organic cation transporter OCTs (SLC22) and MATEs (SLC47) in the human kidney. AAPS J. 2013;15:581–588. doi: 10.1208/s12248-013-9465-7. [DOI] [PMC free article] [PubMed] [Google Scholar]
- Nakamura T, Yonezawa A, Hashimoto S, Katsura T, Inui K. Disruption of multidrug and toxin extrusion MATE1 potentiates cisplatin-induced nephrotoxicity. Biochem Pharmacol. 2010;80:1762–1767. doi: 10.1016/j.bcp.2010.08.019. [DOI] [PubMed] [Google Scholar]
- Nies AT, Koepsell H, Damme K, Schwab M. Organic cation transporters (OCTs, MATEs), in vitro and in vivo evidence for the importance in drug therapy. Handb Exp Pharmacol. 2011:105–167. doi: 10.1007/978-3-642-14541-4_3. [DOI] [PubMed] [Google Scholar]
- Omote H, Hiasa M, Matsumoto T, Otsuka M, Moriyama Y. The MATE proteins as fundamental transporters of metabolic and xenobiotic organic cations. Trends Pharmacol Sci. 2006;27:587–593. doi: 10.1016/j.tips.2006.09.001. [DOI] [PubMed] [Google Scholar]
- Otsuka M, Matsumoto T, Morimoto R, Arioka S, Omote H, Moriyama Y. A human transporter protein that mediates the final excretion step for toxic organic cations. Proc Natl Acad Sci U S A. 2005;102:17923–17928. doi: 10.1073/pnas.0506483102. [DOI] [PMC free article] [PubMed] [Google Scholar]
- Pabla N, Dong Z. Cisplatin nephrotoxicity: mechanisms and renoprotective strategies. Kidney Int. 2008;73:994–1007. doi: 10.1038/sj.ki.5002786. [DOI] [PubMed] [Google Scholar]
- Pabla N, Murphy RF, Liu K, Dong Z. The copper transporter Ctr1 contributes to cisplatin uptake by renal tubular cells during cisplatin nephrotoxicity. Am J Physiol Renal Physiol. 2009;296:F505–511. doi: 10.1152/ajprenal.90545.2008. [DOI] [PMC free article] [PubMed] [Google Scholar]
- Roila F, Hesketh PJ, Herrstedt J. Prevention of chemotherapy- and radiotherapy-induced emesis: results of the 2004 Perugia International Antiemetic Consensus Conference. Ann Oncol. 2006;17:20–28. doi: 10.1093/annonc/mdj078. [DOI] [PubMed] [Google Scholar]
- Samardzic R, Jovanovic-Micic D, Beleslin DB. 5HT-3 receptors: characteristics and therapeutic implications of a new subtype of 5-hydroxytryptamine receptors. Srp Arh Celok Lek. 1994;122:82–85. [PubMed] [Google Scholar]
- Sastry J, Kellie SJ. Severe neurotoxicity, ototoxicity and nephrotoxicity following high-dose cisplatin and amifostine. Pediatr Hematol Oncol. 2005;22:441–445. doi: 10.1080/08880010590964381. [DOI] [PubMed] [Google Scholar]
- Sharma V, McNeill JH. To scale or not to scale: the principles of dose extrapolation. Br J Pharmacol. 2009;157:907–921. doi: 10.1111/j.1476-5381.2009.00267.x. [DOI] [PMC free article] [PubMed] [Google Scholar]
- Shu Y, Brown C, Castro RA, Shi RJ, Lin ET, Owen RP, Sheardown SA, Yue L, Burchard EG, Brett CM, Giacomini KM. Effect of genetic variation in the organic cation transporter 1, OCT1, on metformin pharmacokinetics. Clin Pharmacol Ther. 2008;83:273–280. doi: 10.1038/sj.clpt.6100275. [DOI] [PMC free article] [PubMed] [Google Scholar]
- Shu Y, Sheardown SA, Brown C, Owen RP, Zhang S, Castro RA, Ianculescu AG, Yue L, Lo JC, Burchard EG, Brett CM, Giacomini KM. Effect of genetic variation in the organic cation transporter 1 (OCT1) on metformin action. J Clin Invest. 2007;117:1422–1431. doi: 10.1172/JCI30558. [DOI] [PMC free article] [PubMed] [Google Scholar]
- Skvortsov AN, Zatulovskii EA, Puchkova LV. Structure-functional organization of eukaryotic high-affinity copper importer CTR1 determines its ability to transport copper, silver and cisplatin. Mol Biol (Mosk) 2012;46:335–347. [PubMed] [Google Scholar]
- Stout PR, Bynum ND, Lewallen CM, Mitchell JM, Baylor MR, Ropero-Miller JD. A comparison of the validity of gas chromatography-mass spectrometry and liquid chromatography-tandem mass spectrometry analysis of urine samples II: amphetamine, methamphetamine, (+/−)-3,4-methylenedioxyamphetamine, (+/−)-3,4-methylenedioxymethamphetamine, (+/−)-3,4-methylenedioxyethylamphetamine, phencyclidine, and (+/−)-11-nor-9-carboxy-Delta(9)-tetrahydrocannabinol. J Anal Toxicol. 2010;34:430–443. doi: 10.1093/jat/34.8.430. [DOI] [PubMed] [Google Scholar]
- Tsuda M, Terada T, Mizuno T, Katsura T, Shimakura J, Inui K. Targeted disruption of the multidrug and toxin extrusion 1 (mate1) gene in mice reduces renal secretion of metformin. Mol Pharmacol. 2009;75:1280–1286. doi: 10.1124/mol.109.056242. [DOI] [PubMed] [Google Scholar]
- Tzvetkov MV, Saadatmand AR, Bokelmann K, Meineke I, Kaiser R, Brockmoller J. Effects of OCT1 polymorphisms on the cellular uptake, plasma concentrations and efficacy of the 5-HT(3) antagonists tropisetron and ondansetron. Pharmacogenomics J. 2012;12:22–29. doi: 10.1038/tpj.2010.75. [DOI] [PubMed] [Google Scholar]
- Wang DS, Jonker JW, Kato Y, Kusuhara H, Schinkel AH, Sugiyama Y. Involvement of organic cation transporter 1 in hepatic and intestinal distribution of metformin. J Pharmacol Exp Ther. 2002;302:510–515. doi: 10.1124/jpet.102.034140. [DOI] [PubMed] [Google Scholar]
- Wang EJ, Snyder RD, Fielden MR, Smith RJ, Gu YZ. Validation of putative genomic biomarkers of nephrotoxicity in rats. Toxicology. 2008a;246:91–100. doi: 10.1016/j.tox.2007.12.031. [DOI] [PubMed] [Google Scholar]
- Wang ZJ, Yin OQ, Tomlinson B, Chow MS. OCT2 polymorphisms and in-vivo renal functional consequence: studies with metformin and cimetidine. Pharmacogenet Genomics. 2008b;18:637–645. doi: 10.1097/FPC.0b013e328302cd41. [DOI] [PubMed] [Google Scholar]
- Wasilewska A, Zoch-Zwierz W, Taranta-Janusz K, Michaluk-Skutnik J. Neutrophil gelatinase-associated lipocalin (NGAL): a new marker of cyclosporine nephrotoxicity? Pediatr Nephrol. 2010;25:889–897. doi: 10.1007/s00467-009-1397-1. [DOI] [PubMed] [Google Scholar]
- Wittwer MB, Zur AA, Khuri N, Kido Y, Kosaka A, Zhang X, Morrissey KM, Sali A, Huang Y, Giacomini KM. Discovery of Potent, Selective Multidrug and Toxin Extrusion Transporter 1 (MATE1, SLC47A1) Inhibitors Through Prescription Drug Profiling and Computational Modeling. J Med Chem. 2013 doi: 10.1021/jm301302s. [DOI] [PMC free article] [PubMed] [Google Scholar]
- Yokoo S, Yonezawa A, Masuda S, Fukatsu A, Katsura T, Inui K. Differential contribution of organic cation transporters, OCT2 and MATE1, in platinum agent-induced nephrotoxicity. Biochem Pharmacol. 2007;74:477–487. doi: 10.1016/j.bcp.2007.03.004. [DOI] [PubMed] [Google Scholar]
- Yonezawa A. Platinum agent-induced nephrotoxicity via organic cation transport system. Yakugaku Zasshi. 2012;132:1281–1285. doi: 10.1248/yakushi.12-00211. [DOI] [PubMed] [Google Scholar]
- Zhang J, Zhou W. Ameliorative effects of SLC22A2 gene polymorphism 808 G/T and cimetidine on cisplatin-induced nephrotoxicity in Chinese cancer patients. Food Chem Toxicol. 2012;50:2289–2293. doi: 10.1016/j.fct.2012.03.077. [DOI] [PubMed] [Google Scholar]
- Zhang S, Lovejoy KS, Shima JE, Lagpacan LL, Shu Y, Lapuk A, Chen Y, Komori T, Gray JW, Chen X, Lippard SJ, Giacomini KM. Organic cation transporters are determinants of oxaliplatin cytotoxicity. Cancer Res. 2006;66:8847–8857. doi: 10.1158/0008-5472.CAN-06-0769. [DOI] [PMC free article] [PubMed] [Google Scholar]