Abstract
Study Design
Retrospective review of MRI images.
Objective
Examine the diagnostic accuracy, discriminative ability, and reliability of the Sedimentation Sign in a sample of patients with clinically diagnosed lumbar spinal stenosis (LSS), low back pain (LBP), vascular claudication, and in asymptomatic controls.
Summary of Background Data
The Nerve Root Sedimentation Sign (SedSign) was recently described as a new diagnostic test for LSS; however the degree to which this Sign is sensitive and specific in diagnosis of LSS is unknown.
Methods
All LSS images were from subjects who had clinically diagnosed LSS confirmed on imaging by a spine specialist. The other images were from people with LBP but no LSS, people with severe vascular claudication, and asymptomatic participants. Three blinded raters independently assessed the images.. A positive Sign was defined as the absence of nerve root sedimentation at the level above or below the level of maximum stenosis.
Results
Images from 148 subjects were reviewed (67 LSS, 31 LBP, 4 vascular, and 46 asymptomatic). Intra-rater reliability for the Sign ranged from kappa = 0.87 to 0.97, and inter-rater reliability from 0.62 to 0.69. Sensitivity ranged from 42–66%, and specificity from 49–78%. Sensitivity improved to a range of 60–96% when only images with a smallest cross sectional area of the dural sac <80mm2 were included. The Sign was able to differentiate (p=0.004) between LSS and asymptomatic controls, but not between LSS and LBP, or between LSS and vascular claudication.
Conclusion
The SedSign was shown to have high intra-rater reliability and acceptable inter-rater reliability. The Sign appears most sensitive in defining severe LSS cases, yet may not aid in the differential diagnosis of LSS from LBP or vascular claudication, or add any specific diagnostic information beyond the traditional history, physical examination and imaging studies that are standard in LSS diagnosis.
Keywords: lumbar spinal stenosis, Diagnosis, sedimentation sign, MRI, imaging, Low Back, Pain, vascular claudication, reliability, sensitivity, specificity
Introduction
Degenerative lumbar spinal stenosis (LSS) has been defined as a condition in which there is diminished space available for the neural and vascular elements within the lumbar spinal canal secondary to degenerative changes of osseous and soft tissue structures encroaching on the spinal canal.1 Currently there is no consensus regarding specific diagnostic criteria for LSS. Commonly, diagnosis is based on a combination of anatomical findings of a narrowed spinal canal or narrowed nerve root foramina, reported symptoms, and clinical signs.1;2 The most specific symptom of LSS, neurogenic claudication, is described as a progressive onset of pain and neuromuscular deficits3–5 initiated by walking.4;6;7
A number of imaging parameters have been proposed to aid in the diagnosis of LSS. In particular, a reduced cross sectional area (CSA) of the dural sac has been accepted as a good discriminator for the presence of LSS.8–10 However, use of CSA as a diagnostic tool is not ideal given that using such criteria can lead to both over-diagnosis and under-diagnosis of clinically relevant LSS11 as it is recognized that measures of CSA often correlate poorly with clinical symptoms in LSS.5
To define imaging findings of LSS, Barz and colleagues recently described the Nerve Root Sedimentation Sign (SedSign).10 Barz et al.10 observed on supine MRI scans that in patients with no suspected LSS, owing to gravity, the lumbar nerve roots sink to the dorsal portion of the dural sac. Conversely, in patients with LSS, such cauda equina nerve root sedimentation was rarely observed. A positive SedSign was defined as the absence of sedimented nerve roots. The Sign was reported to be 94% sensitive and 100% specific for LSS in the study by Barz et al., using the criteria of walking distance <200m and CSA of the dural sac <80mm2 to define the LSS cases. However, the authors were clear to indicate that a positive SedSign is not sufficient in and of itself to diagnose LSS, but could be viewed as an additional patho-morphologic sign to be used in combination with other tests. One recent study by Macedo et al.12 found that in 50 patients with MRI confirmed central LSS the Sign accurately identified 54%. The accuracy of the SedSign increased to 82% when only severe cases as defined by Barz et al.10 (walking distance <200m and dural sac <80mm2) were included in the analysis.
However, the degree to which this Sign is sensitive and specific for the diagnosis of LSS remains unclear. As suggested by Barz et al.10 further studies are required to investigate the clinical diagnostic value of the SedSign. Therefore the aim of this study was to examine the diagnostic accuracy, discriminative ability, and reliability of the SedSign in a sample of patients with clinically diagnosed LSS, low back pain (LBP), vascular claudication, and in asymptomatic controls.
Materials and Methods
Subjects
This study was a retrospective review of MRI images obtained from two previous imaging studies of LSS (Michigan Spinal Stenosis Studies 1 and 2).13
All images for the LSS group were obtained by reviewing the files of previous study participants who had clinically diagnosed LSS. Clinical diagnosis of LSS included history, physical examination, and confirmation of LSS through review of imaging by a spine specialist (either physiatrist or spine surgeon). All individuals in the LSS group had self-reported neurogenic claudication and walking limitations.
Other imaging examinations utilized in this study were identified from the records of previous trial participants who reported mechanical low back pain without LSS, or who were scheduled for surgery for vascular claudication, or who were asymptomatic. The LBP group all had non-specific LBP, but specifically did not report any leg pain, claudication, walking limitations, or focal neurologic deficits.
As part of the University of Michigan Medical Center lumbar spine imaging protocol, axial T2-weighted scans had been obtained on a 1.5T imager with the following parameters: TR = 3000–5000 msecs; TE (effective): 102 msecs; number of echos: 1; autoshimming: on; flow compensation: on; FOV: 20 cm; slice thickness: 4 mm; gap: 1 mm; matrix: 256 × 224; frequency direction: AP; NEX: 4; no contrast.
At each lumbar intervertebral disc level between L1/2 and L4/5, the axial MR section which demonstrated the smallest cross-sectional area (CSA) was identified with the use of an electronic cursor. Next, as per the protocol of Barz et al.10 the axial image at the mid-vertebral body level above that axial MRI scan which demonstrated the smallest CSA was identified. Finally, the axial image at the mid-vertebral body level below that axial MRI scan was identified. These two axial images were then uploaded into a powerpoint presentation and coded so that image reviewers were blinded to all patient data. Two identical images from each level from each subject were included to allow for intra-rater reliability assessment. Images were randomly distributed throughout the powerpoint presentation. At level L1/2 only images below, and at level L4/5 only images above were rated. According to the protocol by Barz et al.10 we did not evaluate the L5/S1 level. This is because nerve roots S1 and S2 leave the dural sac in a ventral position, inhibiting sedimentation to the dorsal part of the dural sac. Therefore, according to Barz et al.10 evaluation of the Sign at L5/S1 would be misleading.
Three blinded raters were assigned to independently assess the images. The raters included a radiologist (DQ), a spine specialist physiatrist (AH), and an interventional pain physician with expertise in spine (SG). Prior to the study ratings, a set of ten test cases was completed by each rater. These cases were then discussed among the raters, as well as with one of the authors of the original SedSign study (MM).10 Following the test cases, two of the raters (DQ and SG) assessed the images twice each (2 weeks between readings), and one rater (AH) assessed the images one each. All ratings were based on the above-described axial MRI scans obtained at mid vertebral level.
A "negative" SedSign was defined as all lumbar nerve roots being located in the dorsal part of the dural sac with the exception of the two ventral nerve roots exiting caudal to the level where the observations were being made. For example, at level L3/4, when assessing the dural sac for the SedSign at the level above the disc (at mid-L3 level), all lumbar nerve roots should be dorsal to a transverse line drawn through the dural sac with the exception of the L4 nerve roots which would normally be located in the more ventrolateral aspect of the dural sac.
A "positive" SedSign was defined as an absence of nerve root sedimentation, with the majority of nerve roots located in the central aspect of the dural sac. In addition, two options were added for when a positive SedSign was identified. In the case where the rating was positive but there was still patent dural sac dorsal to the roots reflecting an area into which the roots could have sedimented, the rating was further refined as positive with room. In the case where the rating was positive but there was clearly no residual patent dorsal dural sac into which the nerve roots could have sedimented, the rating was further refined as positive without room.
Analysis
Descriptive statistics were used to describe the study sample. Cohen's Kappa was used to examine intra-rater and inter-rater reliability. The chi-square test was used to assess sensitivity, specificity and positive predictive value of the SedSign for all cases. All analyses were performed twice, first using the ratings derived from the level above the maximal stenosis and then using the ratings derived from the level below. We also repeated all analysis using only images with a CSA <80mm2. Finally one-way analysis of variance (ANOVA) including the Tukey Honestly Significant Difference post-hoc test, was used to determine whether the SedSign could differentiate between the four patient groups (LSS, LBP, vascular claudication, and asymptomatic).
Results
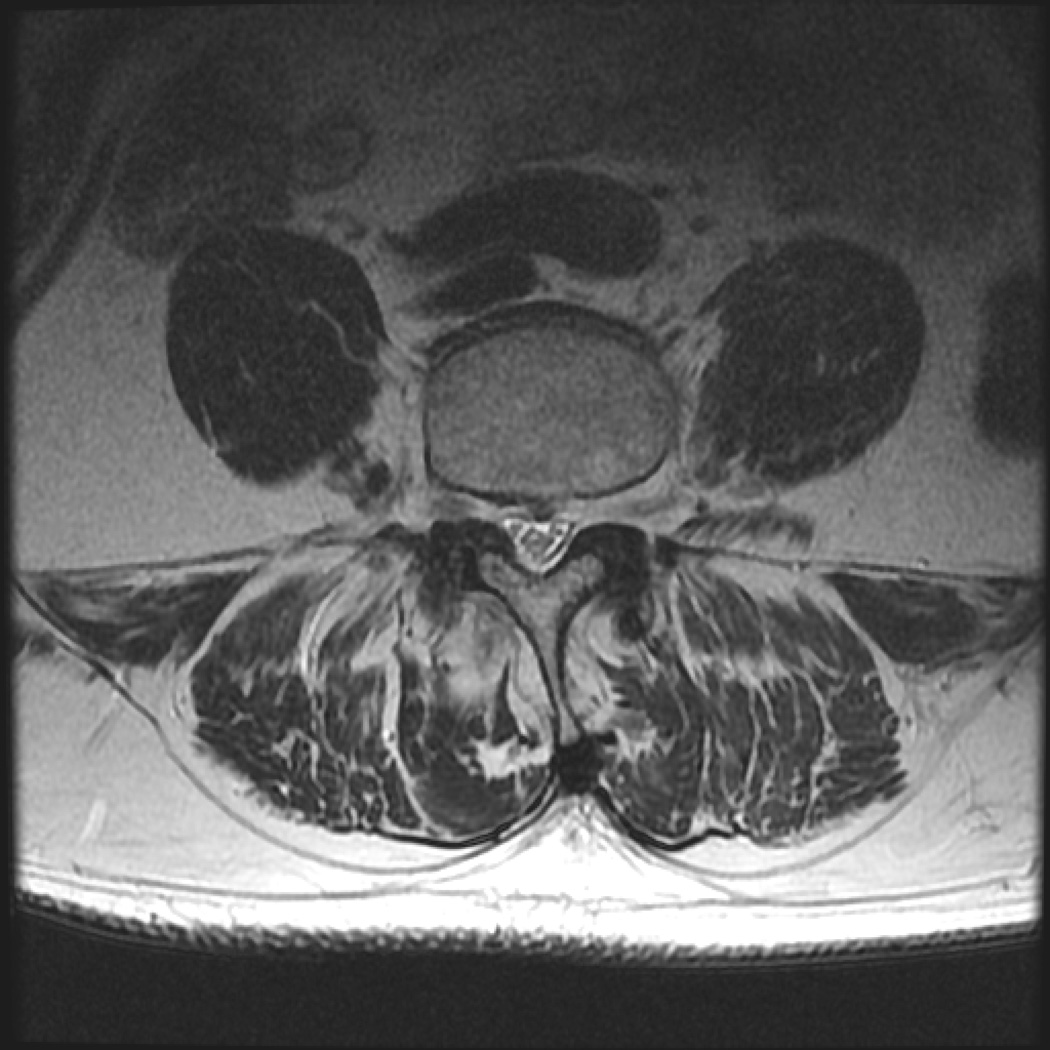
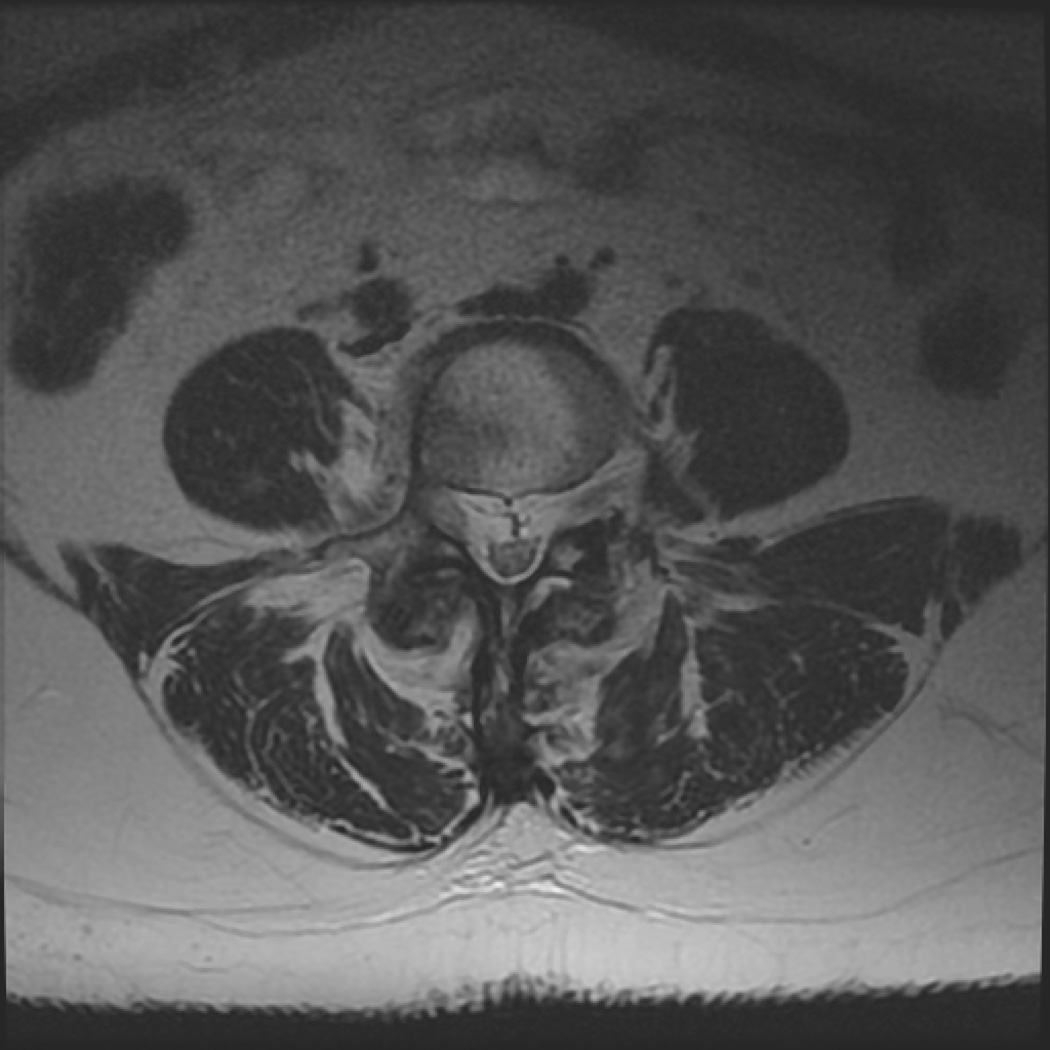
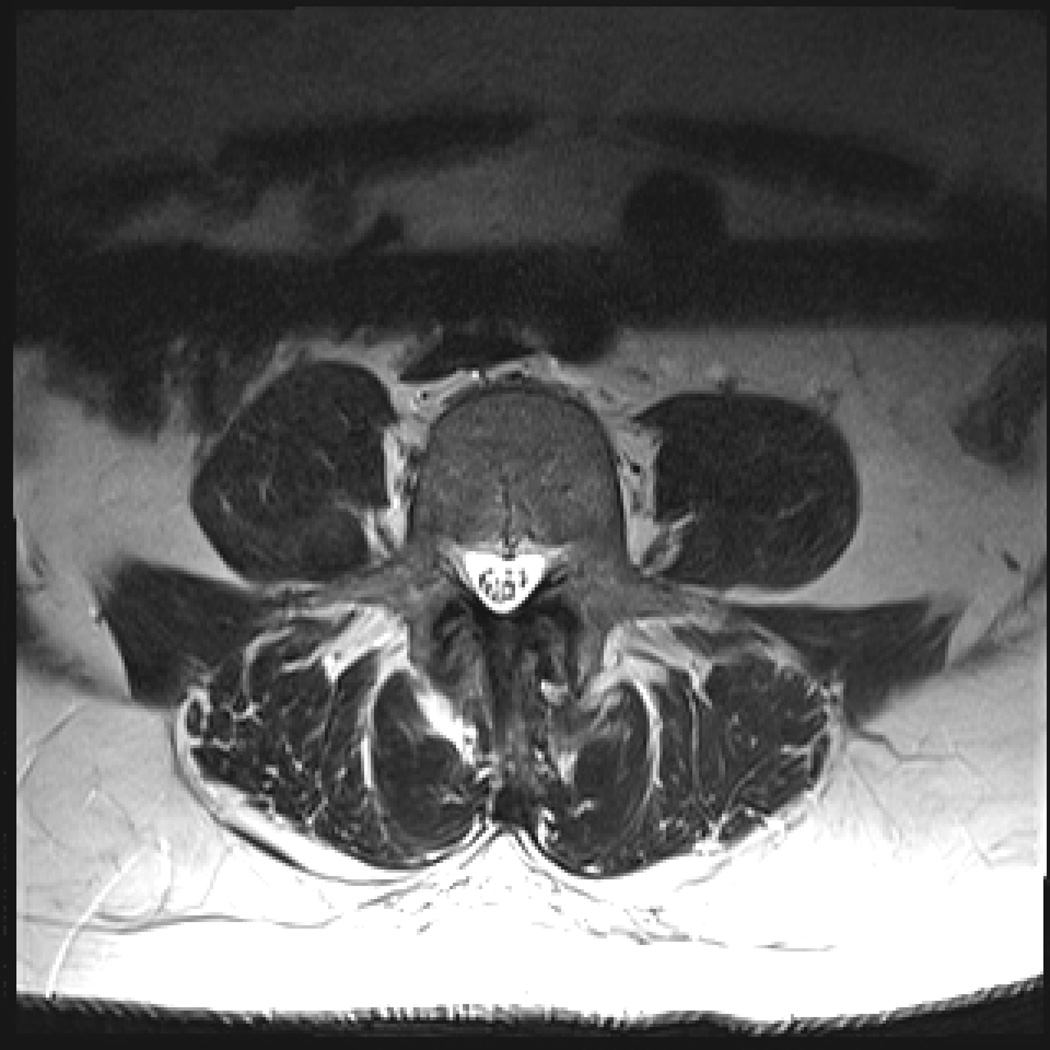
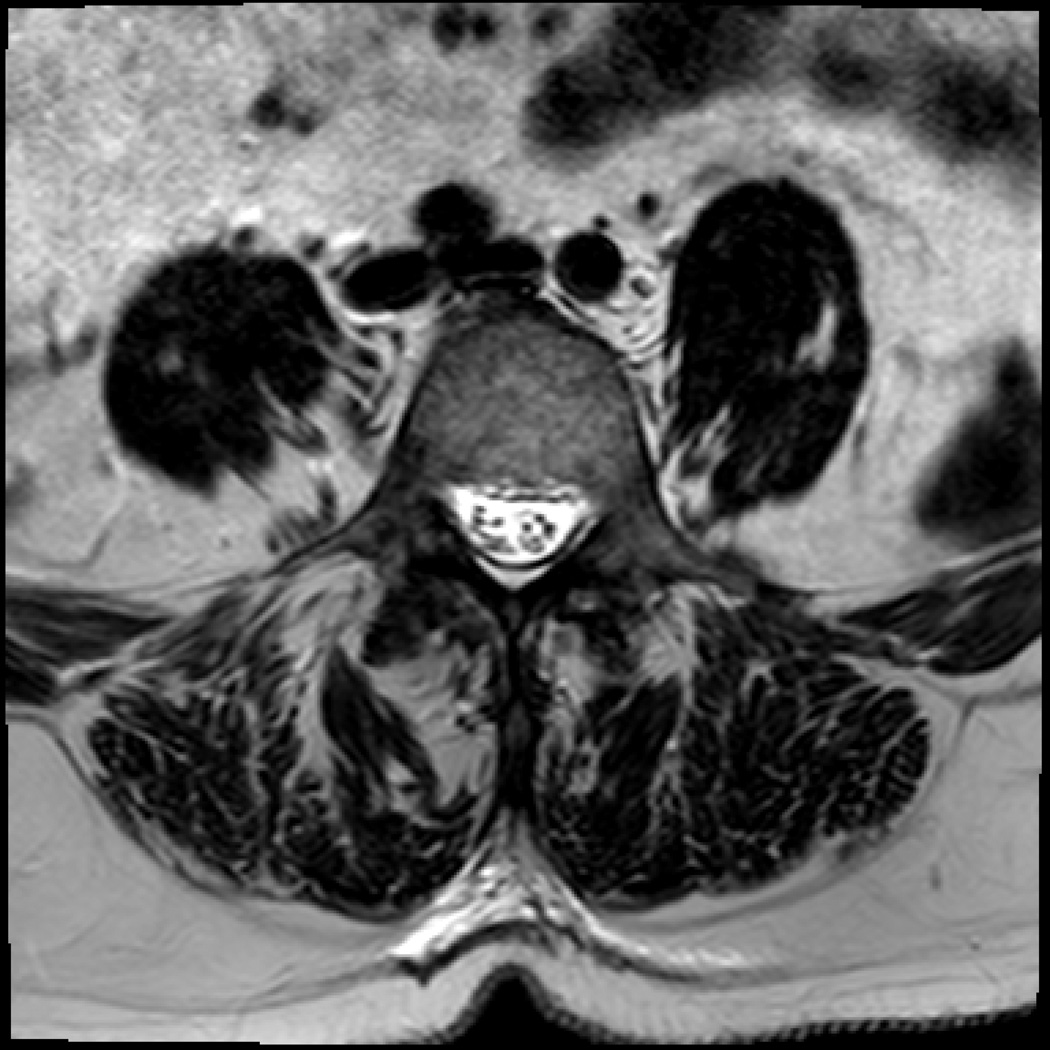
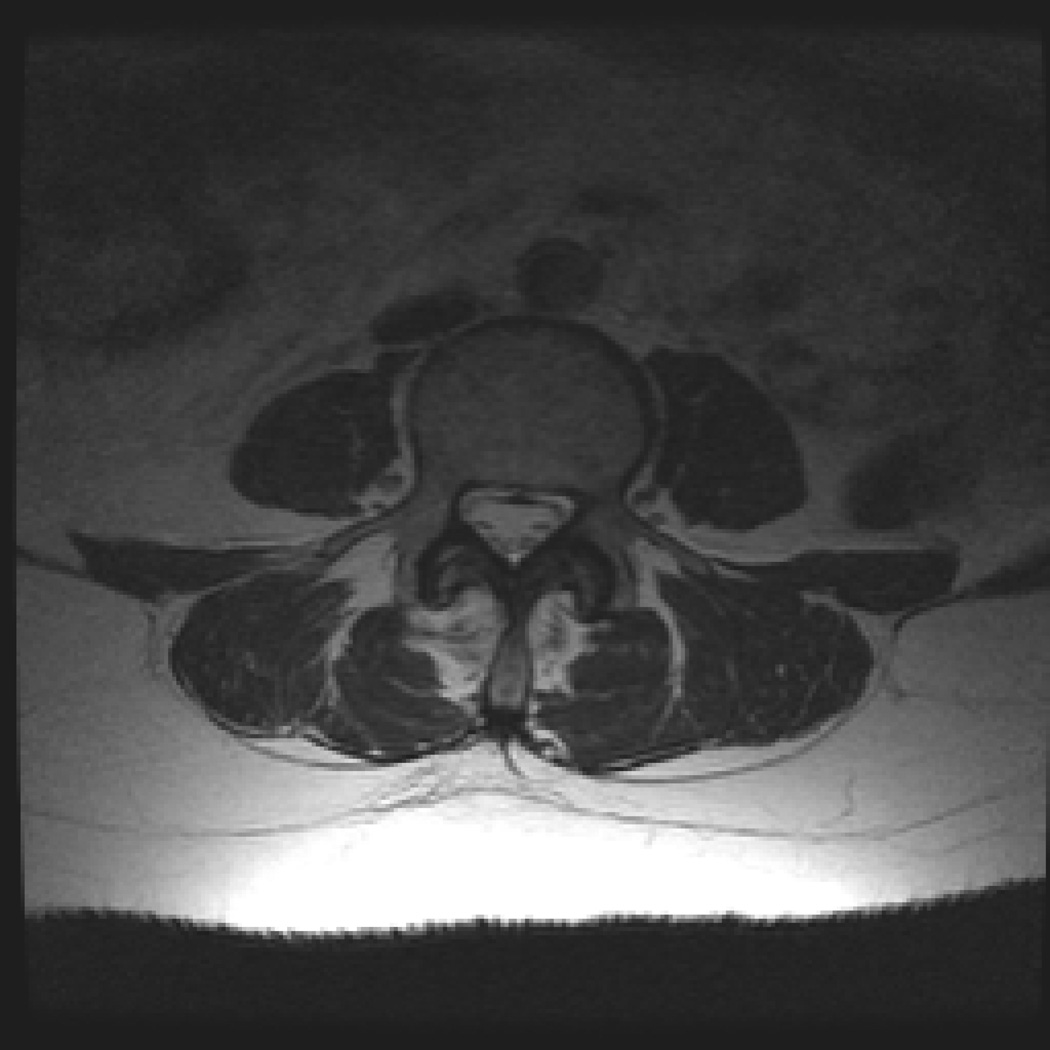
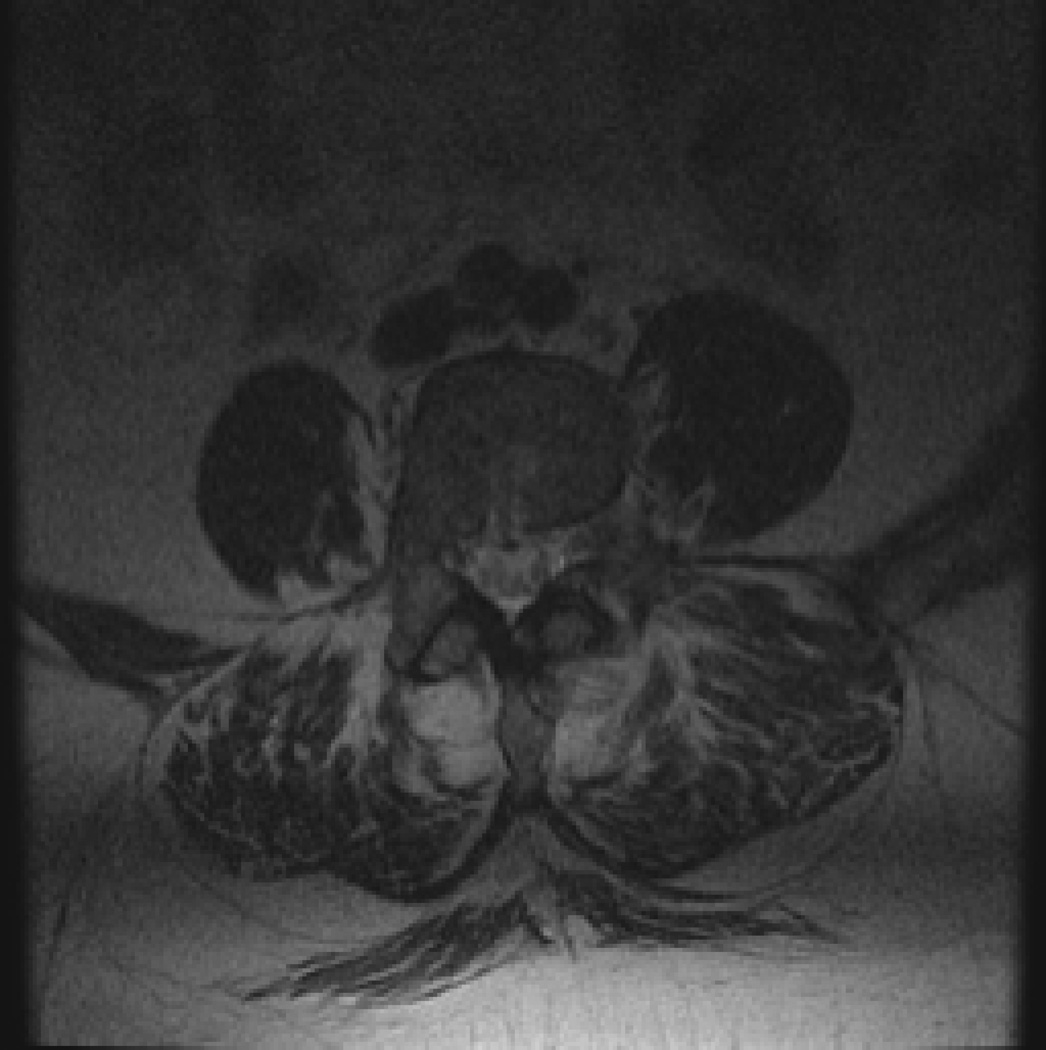
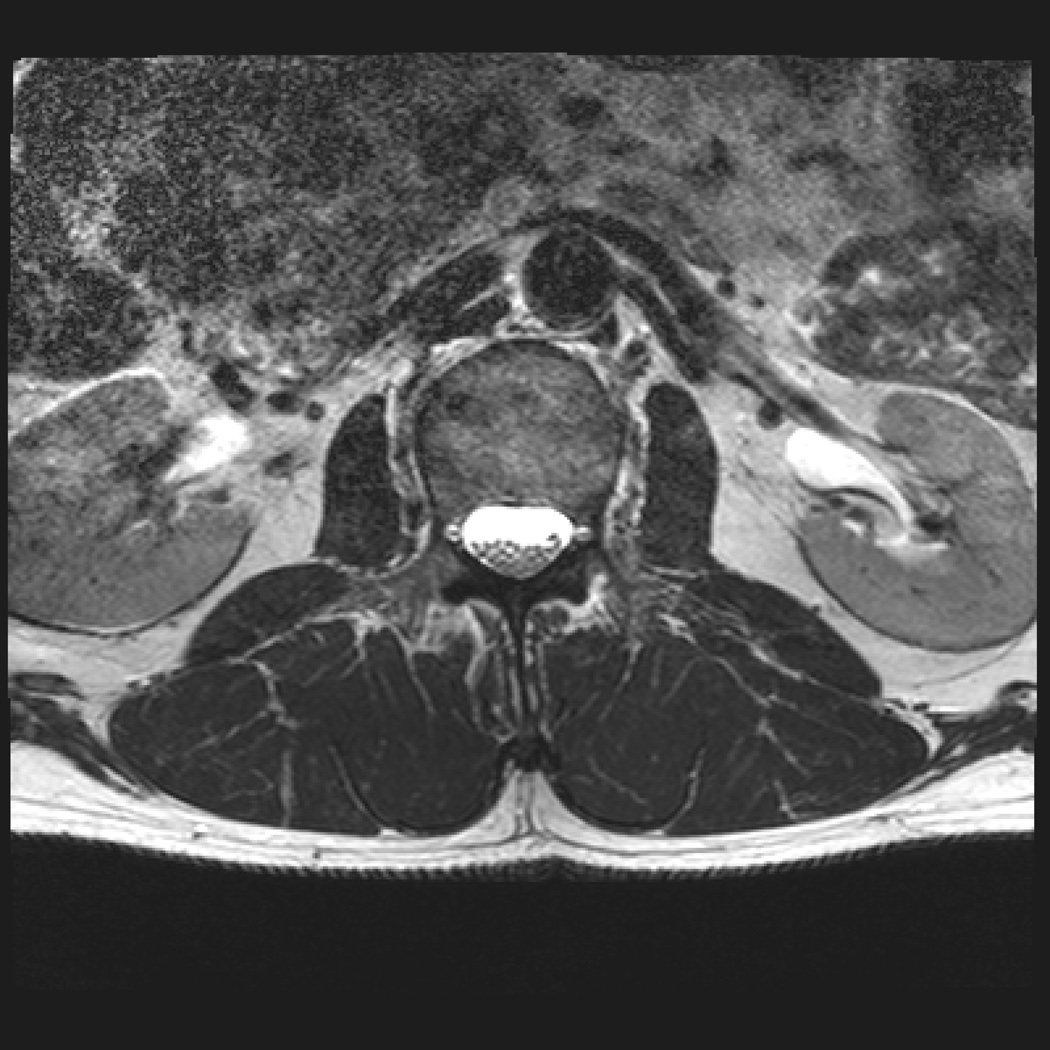
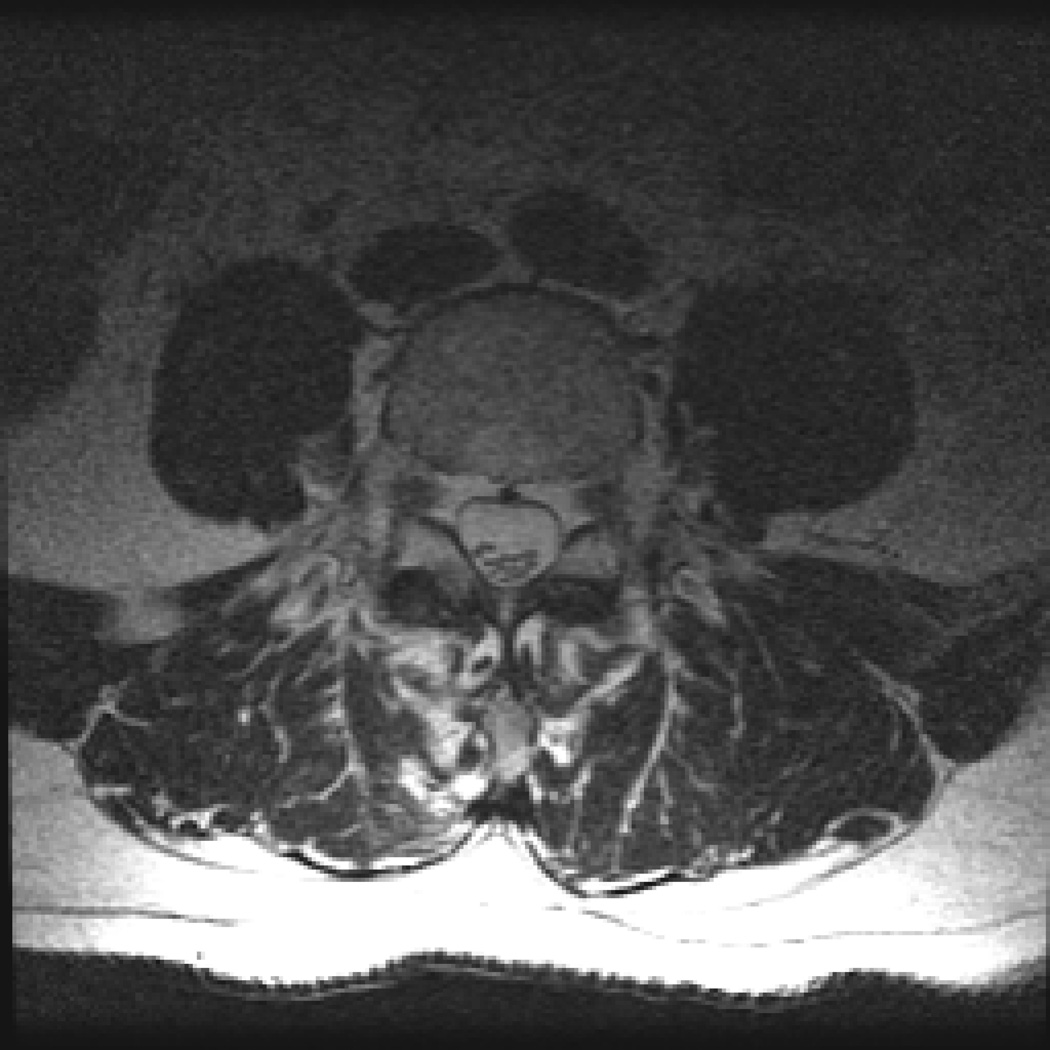
Images from 148 subjects were rated (67 LSS, 31 low back pain, 4 vascular claudication, and 46 asymptomatic controls). The number of positive ratings by diagnosis can be found in Table 1. Sensitivity, specificity and positive predictive value for each of the three raters can be found in Table 2. Sensitivity, specificity and positive predictive value for all images with a CSA <80mm2 can be found in Table 3. Table 5 demonstrates the number of LSS cases correctly identified by lumbar level. Figure 1 presents images for positive and negative Signs in LSS subjects, as well as images rated 'positive Sign without room' and 'positive Sign with room'. Figure 2 presents images for positive and negative Signs in LBP subjects, and Figure 3 in asymptomatic subjects. For all images presented, all three raters agreed on the rating. Each of the presented images was selected because it was a clear representative case of the indicated rating. Note is made that data from the L1/2 level was omitted as only 2 patients demonstrated stenosis at that level.
Table 1.
Number of positive Sedimentation Sign ratings for each of the four groups.
| Diagnosis | Number of cases the Sign was positive for raters 1–3, using images above maximal stenosis |
Number of cases the Sign was positive for raters 1–3, using images below maximal stenosis |
|---|---|---|
| LSS | Rater 1: 34/67 (51%) Rater 2: 30/67 (45%) Rater 3: 28/67 (42%) |
Rater 1: 32/67 (48%) Rater 2: 47/67 (70%) Rater 3: 40/67 (60%) |
| Low Back Pain | Rater 1: 15/31 (48%) Rater 2: 12/31 (39%) Rater 3: 11/31 (35%) |
Rater 1: 12/31 (39%) Rater 2: 12:31 (39%) Rater 3: 14/31 (45%) |
| Vascular Claudication | Rater 1: 1/4 (25%) Rater 2: 0/4 (0%) Rater 3: 0/4 (0%) |
Rater 1: 1/4 (25%) Rater 2: 2/4 (50%) Rater 3: 3/4 (75%) |
| Asymptomatic | Rater 1: 9/46 (20%) Rater 2: 10/46 (22%) Rater 3: 7/46 (15%) |
Rater 1: 8/46 (17%) Rater 2: 14/46 (30%) Rater 3: 22/46 (48%) |
Table 2.
Sensitivity, Specificity and Positive Predictive Value (PPV) for all images (n=148) above and below maximal stenosis
| Rater | Sensitivity Images above maximal stenosis |
Sensitivity Images below maximal stenosis |
Specificity Images above maximal stenosis |
Specificity Images below maximal stenosis |
PPV Images above maximal stenosis |
PPV Images below maximal stenosis |
|---|---|---|---|---|---|---|
| Rater 1 | 51% (38–63) | 52% (39–65) | 70% (59–80) | 73% (62–82) | 59% (45–71) | 60% (46–73) |
| Rater 2 | 46% (34–59) | 63% (66–87) | 73% (62–82) | 78% (66–87) | 58% (44–72) | 77% (64–86) |
| Rater 3 | 42% (30–54) | 66% (52–77) | 76% (65–85) | 49% (37–61) | 60% (44–73) | 51% (39–62) |
Values in parentheses represent 95% confidence intervals.
Table 3.
Sensitivity, Specificity and Positive Predictive Value (PPV) for all images with cross sectional area of the dural sac <80mm2, rated above and below maximal stenosis
| Rater | Sensitivity Images above maximal stenosis |
Sensitivity Images below maximal stenosis |
Specificity Images above maximal stenosis |
Specificity Images below maximal stenosis |
PPV Images above maximal stenosis |
PPV Images below maximal stenosis |
|---|---|---|---|---|---|---|
| Rater 1 | 76% (54–90) | 78% (56–92) | 0% (0–69) | 33% (0–87) | 86% (63–96) | 77% (56–90) |
| Rater 2 | 72% (50–87) | 96% (76–99) | 0% (0–69) | 0% (0–69) | 86% (63–96) | 88% (68–97) |
| Rater 3 | 60% (39–78) | 96% (76–99) | 33% (0–87) | 0% (0–69) | 88% (62–98) | 88% (68–97) |
Values in parentheses represent 95% confidence intervals.
Table 5.
Number of LSS cases correctly identified by lumbar level
| Level | Measured above maximal stenosis |
Measured below maximal stenosis |
|---|---|---|
| L2/3 | Rater 1 = 1/2 (50%) Rater 2 = 1/2 (50%) Rater 3 = 0/2 (0%) |
Rater 1 = 1/2 (50%) Rater 2 = 1/2 (50%) Rater 3 = 0/2 (0%) |
| L3/4 | Rater 1 = 9/15 (60%) Rater 2 = 6/15 (40%) Rater 3 = 4/15 (27%) |
Rater 1 = 7/15 (47%) Rater 2 = 9/15 (60%) Rater 3 = 6/15 (40%) |
| L4/5 | Rater 1 = 24/46 (52%) Rater 2 = 22/46 (48%) Rater 3 = 23/46 (50%) |
Rater 1 = 27/44(61%) Rater 2 = 37/44 (84%) Rater 3 = 34/44 (77%) |
L1/2 was not assessed as there were only 2 cases of stenosis at L1/2.
Figure 1.
a. Image from a lumbar spinal stenosis subject with a positive SedSign. Level L4/5, dural CSA of 18 mm2
b. Image from a lumbar spinal stenosis subject with a negative SedSign. Level L4/5, dural CSA of 123 mm2
c. Image from a lumbar spinal stenosis subject with a positive SedSign, with no room available for sedimentation. Level L4/5, dural CSA of 61 mm2
d. Image from a lumbar spinal stenosis subject with a positive SedSign, with room available for sedimentation. Level L4/5, dural CSA of 124mm2
Figure 2.
a. Image from a low back pain subject with a positive SedSign. Level L3/4, dural CSA of 99 mm2
b. Image from a low back pain subject with a negative SedSign. Level L3/4, dural CSA of 93 mm2
Figure 3.
a. Image from an asymptomatic subject with a positive SedSign. Level L4/5, dural CSA of 87 mm2
b. Image from an asymptomatic subject with a negative SedSign. Level L2/3, dural CSA of 238mm2
ANOVA for each of the raters indicated that the SedSign differentiates between groups (p=0.002). Post-hoc analysis revealed that the Sign differentiates (p=0.004) between LSS and asymptomatic controls, but not between LSS and isolated LBP, or between LSS and vascular claudication. Of the 67 LSS cases, 7 were rated positive Sign without room, meaning the Sign was positive, but there did not appear to be enough room in posterior dural sac for sedimentation. Intra-rater reliability for the Sign ranged from kappa of 0.87 to 0.97, and inter-rater reliability ranged from 0.62 to 0.69 (Table 4).
Table 4.
Intra-rater and inter-rater reliability of the sedimentation sign (n=148)
| Rater | Intra-rater reliability (kappa) |
Inter-rater reliability |
|---|---|---|
| Rater 1 | 0.87 | Vs. Rater 2 = 0.69 Vs. Rater 3 = 0.62 |
| Rater 2 | 0.97 | Vs. Rater 1 =0.69 Vs. Rater 3 = 0.67 |
| Rater 3 | Completed one rating | Vs. Rater 1 =0.62 Vs. Rater 2 = 0.67 |
Discussion
Using images from the level above maximal stenosis, raters were able to correctly identify LSS cases 46% of the time. Using images below maximal stenosis, raters identified 59% of LSS cases. These rates of true positives differ substantially from the study by Barz et al.10 who found 94% LSS cases had a positive Sign. Macedo et al.12, who conducted an analysis looking at central and lateral stenosis, found that 54% of central LSS cases had a positive Sign, while only 23% of lateral stenosis cases had a positive Sign. The difference between our findings and those of Barz et al. could be due to case selection bias. The LSS cases in the Barz et al.10 study were carefully selected as being severe with walking distance of <200m and a CSA of the dural sac <80mm2. This notion is supported by results from Macedo et al.12 who found that the rate of true positive SedSigns increased to 82% when the strict criteria of Barz et al.10 for severe LSS were applied. Yet, the use of only severe LSS cases does not represent the real range of individuals with LSS presenting for care. Therefore we used images from individuals with clinically defined LSS, but did not constrain the diagnosis by dural sac area or walking distance. The individuals in our sample were either scheduled for surgery for LSS, or were diagnosed with LSS by an experienced spine specialist physiatrist, who included clinical (history and physical examination) and imaging factors. All patients with LSS had reported neurogenic claudication and walking limitations. It is likely that our sample was more heterogeneous than the sample of Barz et al.10 It is also likely that our patient group better represents the variability in LSS severity in individuals presenting for imaging in clinical practice. Findings from the present study and those of Macedo et al.12 highlight a potential limitation in the use of the SedSign given that the Sign appears to be sensitive in severe LSS cases only.
With regard to severe LSS cases, when examining only those cases with a dural CSA ≤80mm2, the sensitivity of the Sign in the present study increased to 60–96%, and the positive predictive value increased to 77–88%. However, using this group, the specificity dropped to 0–33%. It appears that when the canal is severely narrowed, the Sign is effective in identifying LSS cases, but does not perform well in ruling out non-LSS cases. This suggests that the Sign may be present in the absence of findings of spinal stenosis.
Another possible explanation for the differences in the rate of true positives between our study and those of Barz et al.10 could be the skill of the raters in identifying the Sign. However, this is unlikely given that all three raters in the present study completed a practice set of images and were then involved in a training session and consensus discussion with one of the authors of the original SedSign paper.10 Additionally, we followed the exact same protocol as Barz et al.10 We also included an additional layer of complexity by assessing the Sign both above and below the maximal stenosis at each spinal level for each case.
We examined the sensitivity and specificity of the Sign using both images obtained at the level above the maximal stenosis, and also below. The proportion of positive Signs appears to increase when ratings are taken using images from below the maximal stenosis. While the rate of correctly identified LSS cases increases using these images, so does the rate of positive Signs in the non-LSS groups.
The sensitivity of the Sign was fairly low, ranging from 42–51% using images obtained at the level above the maximal stenosis, and increased to 52–66% when using images obtained below. Specificity was higher than sensitivity, correctly ruling out LSS between 70–76% of the time, when using images obtained at the level above the maximal stenosis, and between 49–78% using images obtained below. These results suggest that when possible, evaluating the Sign below the maximum stenosis will result in more true positive ratings.
LSS vs. LBP
The present study showed a relatively high number of positive Signs (41%) in individuals with LBP. This differs from the study by Barz et al.10 who found that 0/100 LBP patients without LSS had a positive Sign. The LBP group in the Barz study had no leg pain, claudication or neurologic deficit; they had CSA of the dural sac >120mm2 and were able to walk a distance >1000m. We did not define our LBP group using dural sac CSA or walking distance, however the other criteria for defining LBP were the same. It is possible that by including individuals with walking distances <1000m or CSA <120 mm2 our sample was less clearly defined with respect to LBP vs. LSS. It is also possible that the individuals with LBP are simply patients identified earlier on in the development of degenerative changes, and will potentially develop symptomatic LSS in the future. Finally, ANOVA revealed that the Sign did not differentiate between LSS and LBP. This, combined with the rate of false positive Signs in the LBP group is not ideal, given that LBP is common in LSS patients. Patients with LSS need clear differentiation from those with mechanical LBP because the treatment options may be different.
LSS vs. Vascular Claudication and Asymptomatic Patients
This is the first study of which we are aware to examine the SedSign in people with vascular claudication, and asymptomatic individuals. The Sign was shown to differentiate between LSS cases and asymptomatic controls, but not between LSS and vascular cases. When examining the vascular group, the rate of positive Signs was as high as 75%, suggesting that the Sign may not differentiate between LSS and vascular claudication. However, the number of vascular patients was small (n=4), so we can draw limited conclusions regarding the ability of the Sign to differentiate between LSS and vascular claudication. The rate of positive Signs in asymptomatic controls was approximately 19%, with one rater identifying 48% of asymptomatic control images as being positive. This is not necessarily surprising given that radiologic LSS was identified in 21% of asymptomatic patients over the age of 60 in a previous study.14
Reliability
Both intra-rater and inter-rater reliability for the SedSign were acceptable, with a range for intra-rater reliability of Kappa 0.87–0.97, and 0.62–0.69 for inter-rater reliability. The values for intra-rater reliability are similar to Barz et al.10 who found a kappa of 1.0. However, the values in the present study for inter-rater reliability are considerably lower compared to Barz et al.10 (0.93), and Macedo et al.12 (0.89). These lower values for inter-rater reliability may be related to the heterogeneity of the images in our sample.
Conclusions
The SedSign was shown to have high intra-rater reliability and acceptable inter-rater reliability in the present study. It was able to differentiate between LSS and asymptomatic controls, but not between LSS and LBP, or between LSS and vascular claudication. The Sign appears most sensitive in defining severe LSS cases, yet may not add any specific diagnostic information beyond the traditional history, physical examination and imaging studies that are standard in LSS diagnosis. The authors of the original SedSign study have recently commented that the utility of the Sign may lie in providing additional clinically significant information for patients who meet current diagnostic criteria for LSS to define subgroups that may respond to different treatment protocols, including surgery.15 It may be that the SedSign is related to treatment outcome for individuals with LSS, yet more research is warranted to determine whether or not this is the case.
Key Points.
The sedimentation sign was shown to have high intra-rater reliability and acceptable inter-rater reliability in the present study.
The sign was able to differentiate between LSS and asymptomatic groups, but not between LSS and low back pain or between LSS and vascular claudication.
The sign appears most sensitive in defining severe LSS cases.
Sensitivity and specificity of the sign increase when using images taken from below the level of maximal stenosis.
The sign may not add any specific diagnostic information beyond the traditional history, physical examination and imaging studies that are standard in LSS diagnosis.
Acknowledgements
We would like to thank Dr. Thomas Barz for their assistance in training our raters for this study. This study was approved by the University of Michigan Institutional Review Board. The content is solely the responsibility of the authors and does not necessarily represent the official views of the Eunice Kennedy Shriver National Institute Of Child Health & Human Development or the National Institutes of Health, U.S. Department of Health & Human Services.
The Manuscript submitted does not contain information about medical device(s)/drug(s). Eunice Kennedy Shriver National Institute of Child Health & Human Development funds were received to support this work. Relevant financial activities outside the submitted work: expert testimony and payment for lectures.
Footnotes
Publisher's Disclaimer: This is a PDF file of an unedited manuscript that has been accepted for publication. As a service to our customers we are providing this early version of the manuscript. The manuscript will undergo copyediting, typesetting, and review of the resulting proof before it is published in its final citable form. Please note that during the production process errors may be discovered which could affect the content, and all legal disclaimers that apply to the journal pertain.
Reference List
- 1.Watters WC, III, Baisden J, Gilbert TJ, et al. Degenerative lumbar spinal stenosis: an evidence-based clinical guideline for the diagnosis and treatment of degenerative lumbar spinal stenosis. Spine J. 2008;8:305–310. doi: 10.1016/j.spinee.2007.10.033. [DOI] [PubMed] [Google Scholar]
- 2.Arnoldi CC, Brodsky AE, Cauchoix J, et al. Lumbar spinal stenosis and nerve root entrapment syndromes. Definition and classification. Clin. Orthop. Relat Res. 1976;115:4–5. [PubMed] [Google Scholar]
- 3.Atlas SJ, Delitto A. Spinal stenosis: surgical versus nonsurgical treatment. Clin. Orthop. Relat Res. 2006;443:198–207. doi: 10.1097/01.blo.0000198722.70138.96. [DOI] [PubMed] [Google Scholar]
- 4.Chad DA. Lumbar spinal stenosis. Neurol. Clin. 2007;25:407–418. doi: 10.1016/j.ncl.2007.01.003. [DOI] [PubMed] [Google Scholar]
- 5.Arbit E, Pannullo S. Lumbar stenosis: a clinical review. Clin. Orthop. Relat Res. 2001;384:137–143. [PubMed] [Google Scholar]
- 6.Binder DK, Schmidt MH, Weinstein PR. Lumbar spinal stenosis. Semin. Neurol. 2002;22:157–166. doi: 10.1055/s-2002-36539. [DOI] [PubMed] [Google Scholar]
- 7.Porter RW. Spinal stenosis and neurogenic claudication. Spine. 1996;21:2046–2052. doi: 10.1097/00007632-199609010-00024. [DOI] [PubMed] [Google Scholar]
- 8.Lurie JD, Tosteson AN, Tosteson TD, et al. Reliability of readings of magnetic resonance imaging features of lumbar spinal stenosis. Spine. 2008;33:1605–1610. doi: 10.1097/BRS.0b013e3181791af3. [DOI] [PMC free article] [PubMed] [Google Scholar]
- 9.Hamanishi C, Matukura N, Fujita M, et al. Cross-sectional area of the stenotic lumbar dural tube measured from the transverse views of magnetic resonance imaging. J Spinal Disord. 1994;7:388–393. [PubMed] [Google Scholar]
- 10.Barz T, Melloh M, Staub LP, et al. Nerve root sedimentation sign: evaluation of a new radiological sign in lumbar spinal stenosis. Spine. 2010;35:892–897. doi: 10.1097/BRS.0b013e3181c7cf4b. [DOI] [PubMed] [Google Scholar]
- 11.Staub LP, Barz T, Melloh M, et al. Clinical validation study to measure the performance of the Nerve Root Sedimentation Sign for the diagnosis of lumbar spinal stenosis. Contemp. Clin. Trials. 2011;32:470–474. doi: 10.1016/j.cct.2011.01.015. [DOI] [PubMed] [Google Scholar]
- 12.Macedo Gazzi ML, Wang Y, Battie MC. The sedimentation sign for differential diagnosis of lumbar spinal stenosis. Spine. 2012;38(10):827–831. doi: 10.1097/BRS.0b013e31827e8ecd. [DOI] [PubMed] [Google Scholar]
- 13.Haig AJ, Tong HC, Yamakawa KS, et al. Spinal stenosis, back pain, or no symptoms at all? A masked study comparing radiologic and electrodiagnostic diagnoses to the clinical impression. Arch Phys. Med Rehabil. 2006;87:897–903. doi: 10.1016/j.apmr.2006.03.016. [DOI] [PubMed] [Google Scholar]
- 14.Boden SD, Davis DO, Dina TS, et al. Abnormal magnetic-resonance scans of the lumbar spine in asymptomatic subjects. A prospective investigation. J Bone Joint Surg. Am. 1990;72:403–408. [PubMed] [Google Scholar]
- 15.Melloh M, Lord SJ, Staub LP, et al. Letter. Spine. 2013;38(11):968. doi: 10.1097/BRS.0b013e31828fca2c. [DOI] [PubMed] [Google Scholar]


