Abstract
The complete iron vibrational spectrum of the five-coordinate high-spin complex [Fe(OEP)(2-MeHIm)], where OEP = octaethylporphyrinato and 2-MeHIm = 2-methylimidazole, has been obtained by oriented single-crystal nuclear resonance vibrational spectroscopy (NRVS) data. Measurements have been made in three orthogonal directions, which provides quantitative information for all iron motion. These experimental data, buttressed by DFT calculations, have been used to define the effects of the axial ligand orientation. Although the axial imidazole removes the degeneracy in the in-plane vibrations, the imidazole orientation does not appear to control the direction of the in-plane iron motion. This is in contrast to the effect of the imidazolate ligand, as defined by DFT calculations, which does have substantial effects on the direction of the in-plane iron motion. The axial NO ligand has been found to have the strongest orientational effect (Angew. Chem., Int. Ed., 2010, 49, 4400). Thus the strength of the directional properties are in the order NO > imidazolate > imidazole, consistent with the varying strength of the Fe–ligand bond.
Introduction
Iron porphyrinate derivatives or hemes are involved in a wide variety of biological processes including oxygen storage and transport, oxygen utilization, catalysis, and electron transport. Given the large variety of processes, it is surprising to realize that almost all systems utilize the same porphyrin ligand, protoporphyrin IX. Thus the question immediately arises, how can fine control be achieved when the essential macrocycle does not change? A probable issue leading to control is the manipulation of iron electronic structure, i.e., variation of the population and energies of the d electron manifold. In this paper, we have explored one aspect, out of many, that could influence the physico-chemical properties of heme derivatives, namely, the effect of axial ligand orientation. Prior studies of six-coordinate complexes have shown that the specific and relative orientations of planar axial ligands with respect to the coordinate system defined by the Fe–Np1 directions of the macrocycle have profound effects on the electronic structure including spin states.
In the earliest study, Scheidt and coworkers showed that for the iron(III) system [Fe(OEP)(3-ClPy)2]ClO4 different crystalline polymorphs with the same relative orientation of the planar pyridine ligands (parallel to each other) but differing absolute orientations led to different spin states for iron.2–4 Analysis of the system by X-ray structure determinations, magnetic susceptibility, and Mössbauer spectroscopy made clear that the absolute ligand orientation was the defining factor in the spin state differences.
Blumberg and Peisach’s5, 6 analysis, as well as that of others,7–10 of the low-spin iron(III) heme EPR spectra has shown that the spectral parameters are sensitive to the identity of axial ligands. These EPR parameters are readily analyzed in terms of crystal field parameter, showing a connection to changing electronic structure features. Subsequently, a series of studies demonstrated that EPR parameters (and electronic and structural details) are also sensitive to the relative and absolute orientation of planar axial ligands (both imidazoles and pyridines). This is seen for systems with bulky imidazole ligands that give rise to an unusual EPR signal now termed the large gmax signal.11–13 Structure analysis14, 15 showed that this is the result of the two ligands having relative perpendicular orientations.
A study with imidazole itself, combined X-ray structural and EPR studies,14, 16 showed that the relative orientation of parallel aligned planar ligands lead to distinct EPR signals. These could be interpreted in terms of differing g-values, rhombicities, and tetragonalities. These results and conclusions were further confirmed by a single-crystal EPR study.17 A later analysis defined a relationship between the dihedral angle of parallel imidazole planes and the closest Fe–Np vector.18 Further orientation effects were analyzed in a series of complexes prepared by Safo.19–21 Later additional derivatives led to further elaboration of these orientation effects.22–30
Thus for six-coordinate iron(III) species, spectroscopic and structural studies demonstrate that the axial ligand orientations have real effects on electronic structure. The same orientation effects on electronic structure are probable for six-coordinate iron(II) species. Similar relative and absolute orientations of axial ligands can be formed with the iron(II) species, although achieving relative perpendicular orientations in the solid state proved challenging.31 Most have parallel axial ligand planes.32, 33 Unfortunately, only Mössbauer can readily interrogate the iron(II) species that show distinctly different structures.31–33 These species do show distinctly different Mössbauer spectra consistent with changes in orientation and bonding that also has a core conformation component.31
Another class of complexes where axial ligand orientation is clearly important are the five-coordinate species [M(Por)(Im)] where Por and Im are generalized porphyrins and imidazoles respectively. In these derivatives, the preferred orientation for the imidazole plane has the imidazole plane close to eclipsing an Fe–Np bond.34–42 In an early theoretical study based on iterative Hückel calculations, Chipman and Scheidt provided a bonding rationalization for the preferred orientation, which extends to metals other than iron.43
These axial ligand orientational results have led us to carry out a detailed oriented single-crystal vibrational study of [Fe(OEP)(2-MeHIm)] to study the possible effects of ligand orientation for the in-plane motion of iron. This five-coordinate, high-spin molecule and several related species are models for the heme site of deoxymyoglobin and deoxyhemoglobin. Vibrational spectroscopy is widely applied to probe the structure, dynamics and reactivity of biological molecules, particularly resonance Raman44–51 and infrared difference,52, 53 far-infrared,54 and synchrotron-based far-infrared55 spectroscopies. However, selection rules inherent to infrared and Raman spectroscopies prevent the observation of many important active-site vibrations. Importantly, the in-plane vibrations of the heme iron related to the determination of the Fe–pyrrole bond strength (Fe–Np) have not been identified in resonance Raman spectra. However, Nuclear Resonance Vibrational Spectroscopy (NRVS) or Nuclear Inelastic Scattering (NIS) allows measurement of the complete set of iron vibrational modes over a wide energy range (0–800 cm−1). Moreover, the NRVS intensity is directly related to the magnitude and direction of the iron motion, so the method has a unique quantitative component in the measured vibrational spectrum.56–60 We have previously used oriented single-crystal measurements of heme derivatives to assign the in-plane and out-of-plane vibrations, utilizing this directional feature of the vibrational spectrum. Peripheral substituents can have a large effect on the dynamics of the iron, especially for in-plane motions.61, 62 In addition, we have shown that the in-plane anisotropy is related to the orientation of the axial NO in [Fe(OEP)(NO)],64 confirming the possibility of observable anisotropy based on the first-principle calculation of NRVS.65
In earlier vibrational investigations of high-spin five-coordinate iron(II) imidazole and imidazolate species, we had examined the nature of the out-of-plane and generalized in-plane vibrations by NRVS.66, 67 In this paper, we expand on this earlier work to the maximal extent experimetnally feasible with more detailed investigations of axial ligand control of the directions of iron motion. We have explored the iron motion of [Fe(OEP)(2-MeHIm)] in specific directions. Single-crystal measurements probed two in-plane, orthogonal directions: x, parallel to the imidazole plane, and y, perpendicular to the imidazole, thus providing unique information on the effects of imidazole orientation on the vibrational spectrum.
Experimental Section
General Information
All reactions and manipulations for the preparation of the iron(II) porphyrin derivatives were carried out under argon using a double manifold vacuum line, Schlenkware, and cannula techniques. Dichloromethane, toluene and hexanes were distilled under argon from CaH2 and sodium/benzophenone, respectively. Chlorobenzene was purified by washing with concentrated sulfuric acid, then with water until the aqueous layer was neutral, dried with sodium sulfate and distilled twice over P2O5. Ethanethiol (ACROS) was used as received, 2-methylimidazole was purchased from Aldrich, recrystallized from toluene and dried under vacuum. 95% 57Fe2O3 was purchased from Cambridge Isotopes. H2OEP was synthesized by literature methods.68 [57Fe(OEP)]2O was prepared by washing a solution of [57Fe(OEP)Cl] in dichloromethane with 2M aqueous sodium hydroxide solution, drying the collected organic layers with sodium sulfate followed by recrystallization from dichloromethane/hexanes. 57Fe-enriched [Fe(OEP)Cl] was prepared using the metalation method described by Landergren and Baltzer.69 [57Fe(OEP)(2-MeHIm)] was synthesized and crystallized according to Hu et al.39
Crystal Alignment
[57Fe(OEP)(2-MeHIm)] crystallizes in the triclinic system with two molecules per cell that are related by an inversion center.39 There is thus a single molecule in the asymmetric unit. This solid-state feature allows the best arrangements for the oriented crystal NRVS experiments, which is to have the porphyrin plane parallel and the imidazole plane parallel or perpendicular with respect to the incident beam. This orientation permits the recording of the vibrational spectrum parallel and perpendicular to the imidazole plane. The Miller indices of the target planes were calculated in Mercury 2.2. The Miller indices of the porphyrin and imidazole planes, defined by 24 and 5 atoms, were determined to be (3, 3, 8) and (−6, −4, 3), respectively. A second crystal and crystal mounting is required to obtain the out-of-plane measurement, which has been obtained from a previous study.66
A crystal of [Fe(OEP)(2-MeHIm)] was mounted in a 0.8 mm diameter, thin-walled, boron-rich, X-ray diffraction capillary tube in an inert-atmosphere drybox. The crystal was immobilized in the capillary tube with a small amount of Apiezon grease. The capillary tube was sealed and glued to the end of a copper wire affixed to a goniometer head pin with epoxy resin. The wire was adjusted so that the crystal would be within a few millimeters of the X-ray beam when the assembly was affixed to the diffractometer. After an initial indexing, the dihedral angle between the porphyrin plane (3, 3, 8) and the plane perpendicular to the goniometer head phi axis was calculated in the “oriented scan” portal of APEX II software using an “up” designation. The wire was then adjusted in the direction required to achieve 0° for this dihedral angle, followed by reindexing at the new position. After several adjustments of the copper wire, the dihedral angle was less than 10°, and then adjustments were made using the goniometer head arcs until the the angle was 0°±0.5°.
The φ rotation required to align the imidazole plane perpendicular to the beam was calculated by inputting its Miller index (−6, −4, 3) into the “oriented scans” portal of the APEX II software using a “toward source” designation, this position and a 90° rotation around the goniometer axis give the two desired orientations, corresponding to perpendicular and parallel orientations of the 2-methylimidazole plane with respect to the incident X-ray beam.
NRVS Measurements
Measurements were conducted at sector 3-ID of the Advanced Photon Source, Argonne National Laboratory. The polycrystalline powder sample of [Fe(OEP)(2-MeHIm)] was prepared by mixing with a small amount of Apiezon N grease and placing in a sealed cell which was directly mounted onto a He flow cryostat, and cooled to 20 K. For the single crystal measurements, the oriented crystal of [Fe(OEP)(2-MeHIm)] was mounted so that the rotation axis of the goniometer head was parallel or perpendicular to the incident beam. Vibration spectra were measured using an in-line high-resolution monochromator operating at 14.4125 keV with 1.0 meV bandwith scanning the energy of incident X-ray beam.63 Spectra were recorded between −50 and 80 meV in steps of 0.25 meV, and all scans were normalized to the intensity of the incident beam and added. NRVS raw data were converted to the vibrational density of states (VDOS) using the program Phoenix.57,70
Vibrational Predictions
All calculations including structure optimizations and frequency analysis have been performed on [Fe(OEP)] and [Fe(OEP)(2-MeHIm)] complexes using the Gaussian09 program package71 without constraints and using the spin unrestricted DFT method. The reported structure with the high-spin state (S = 2) for [Fe(OEP)(2-MeHIm)] was used for the initial geometries for structure optimizations. Structural optimization of [Fe(OEP)(2-MeHIm)] was explored with several different functionals. A comparison of the optimized geometry for the different functionals and the observed structure are given in the Results. Final results utilized the GGA functional BP8672 with the triple-ζ valence basis set with polarization (TZVP)73 for iron and 6-31G* for C, H and N atoms.74 Frequency calculations were performed on the fully optimized structures at the same basis level to obtain the vibrational frequencies with the 57Fe isotope set.
The Gaussian09 output files from DFT calculation can be used to generate predicted mode composition factors with our scripts.76 The mode composition factors for atom j and frequency α are the fraction of total kinetic energy contributed by atom j (here: 57Fe, a NRVS active nucleus). The normal mode calculations are obtained from the atomic displacement matrix together with the equation:
| (1) |
where the sum over i runs over all atoms of the molecule, mi is the atomic mass of atom i and ri is the absolute length of the Cartesian displacement vector for atom i. The polarized mode composition factors are defined in terms of two distinct in-plane directions, which can be calculated from a projection of the atomic displacement vectors x or y (eq. 2, shown for x).77
| (2) |
The out-of-plane atomic displacement perpendicular to the porphyrin plane for a normal mode is obtained from a projection of the atomic displacement vector z (eq. 2). The x, y and z components of the iron normal mode energy for [Fe(OEP)(2-MeHIm)] (HS) with are given in Tables S1 and S2 (SI) referred to different definitions of the coordinate system.
Results
NRVS spectra were collected on oriented single crystals of [Fe(OEP)(2-MeHIm)] in two distinct sets of experiments. These specially oriented spectra are possible because [Fe(OEP)(2-MeHIm)] crystallizes in the triclinic space group P1̄ with a single molecule in the asymmetric unit. This requires that any molecular plane is parallel to all other such planes in all molecules of the entire crystal. This includes both the porphyrin and imidazole planes. Moreover, the Fe–Np vectors are collinear in the crystal.
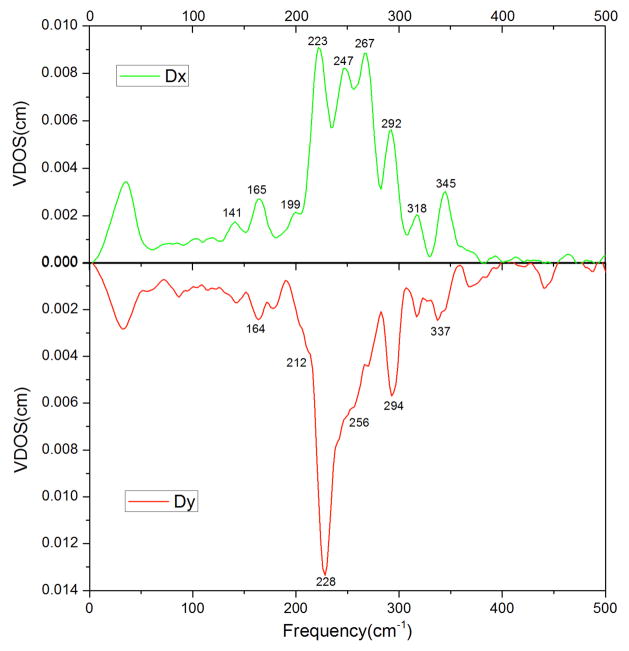
The first measurement aligned the porphyrin plane perpendicular to the exciting X-ray beam, which provides information on the out-of-plane iron motion, and has been reported previously.66 The second set of measurements has the porphyrin plane collinear with the exciting X-ray beam and with the coordinated imidazole plane either parallel or perpendicular to the X-ray beam. This provides detailed information on the in-plane iron motion. These in-plane spectra, taken in orthogonal directions, are shown in Figure 1. The two in-plane spectra are clearly distinct and demonstrate that the planar axial ligand has removed the degeneracy of the fourfold symmetric metalloporphyrin. A major objective for taking these in-plane measurements was to understand the anisotropic nature of the spectra including the effects of the imidazole orientation on the in-plane motion of the iron.
Figure 1.
Comparison of the Fe VDOS in [Fe(OEP)(2-MeHIm)] in the directions parallel (top panel) and perpendicular (bottom panel) to the imidazole plane.
We used DFT calculations for help with spectral assignments. We performed comparisons of the crystal structure with the predicted structures with several DFT functionals and basis sets as shown in Table 1. The basis set generally used was 6-31G* for H, C and N, and TZVP for Fe. For a BP86 calculation we also used the diffuse function 6-31+G* added to N to better allow for molecular polarity and possible partial change on the donor atoms. The comparison of the structural predictions and the experimentally determined structure are given in Table 1.
Table 1.
Comparison of Calculated, Energy-Minimized DFT Structures for [Fe(OEP)(2-MeHIm)].
| Method(Ref.) | Fe–Npa | avea,b | Fe–NIma | ΔN4a,c | NIm–Fe–Npd,e | Ref. | |||
|---|---|---|---|---|---|---|---|---|---|
| crystal structure | 2.072 | 2.074 | 2.076 | 2.087 | 2.077(7) | 2.135(3)/2.182f | 0.34 | 19.5 | 39 |
| BP86/TZVP/6-31G*(72) | 2.084 | 2.086 | 2.092 | 2.095 | 2.089(5) | 2.180 | 0.32 | 23.6 | tw |
| BP86/TZVP/6-31+G*(72) | 2.085 | 2.086 | 2.097 | 2.094 | 2.090(6) | 2.178 | 0.31 | 24.5 | tw |
| B3LYP/TZVP/6-31G*(78) | 2.101 | 2.104 | 2.117 | 2.118 | 2.110(9) | 2.206 | 0.39 | 34.8 | 75 |
| M06/TZVP/6-31G*(79) | 2.096 | 2.099 | 2.097 | 2.095 | 2.097(2) | 2.148 | 0.40 | 23 | tw |
| M06L/TZVP/6-31G*(80) | 2.075 | 2.077 | 2.076 | 2.076 | 2.076(1) | 2.194 | 0.29 | 31.1 | tw |
Distances in Å.
Averaged value for the four Fe–Np distances.
Displacement of iron from the plane of the four nitrogen atoms
Value in degrees.
Dihedral angle between NIm–Fe–Np plane and the imidazole plane.
Two positions of imidazole.
The calculations reproduce the experimentally observed Fe–Np bond distances to within 0.02 Å except the B3LYP functional, although the majority of the calculations slightly over-estimate this parameter. The Fe-N(Im) bond distance is predicted by the BP86 functional to within 0.01 Å compared with the crystal structure. The B3LYP functional provides poor results for several of the geometric parameters and can therefore not be recommended for the systems under study here.83 The BP86 functional performs better with respect to agreement with experimental data within 0.015 Å for all bonds. The out-of-plane displacement from the four nitrogen atom plane, ΔN4, is an important feature of the molecular structure likely to influence the NRVS spectrum. The BP86 functional calculations predicts this to within 0.02 Å, better than other functionals. All functional/basis set combinations overestimate the NIm–Fe–Np dihedral angle, perhaps due to limitations of the single molecular model in the calculations. The BP86 calculation predicts this dihedral angle to within 5° of the experimental value of 19.5°. Better predictions were obtained from the BP86 functionals with a suitable basis set, with good agreement with experimental data; the addition of the diffuse function 6-31+G* for the improvement of the calculations is negligible. The BP86 predictions in the three measured directions are given in Figures S2 to S4 of the SI. The prediction of the vibrational spectra given by the various models are displayed in Figures S5 to S8 of the SI and the better fits between experiment and predictions shown by the BP86 functional are apparent.
Discussion
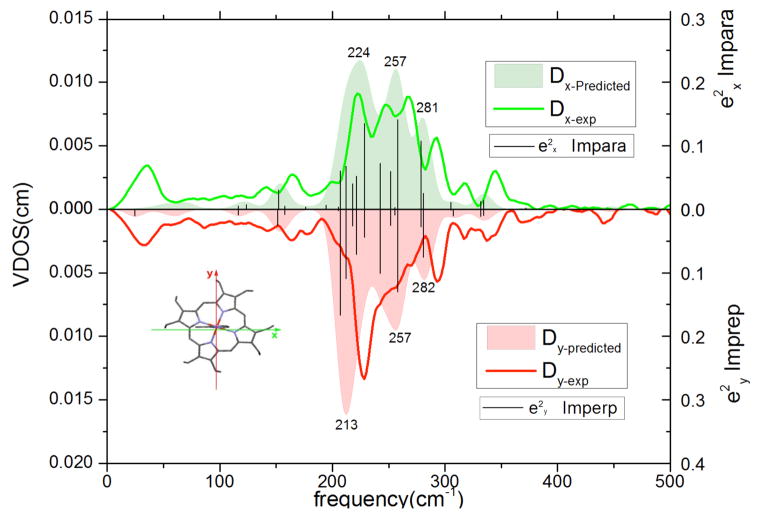
The NRVS spectra of the high-spin five-coordinate iron(II) complexes have been noted to be very strongly overlapped and require the use of oriented crystal spectra in order to resolve the various spectral components. The experimental NRVS data in the two orthogonal in-plane directions are compared with the predicted vibrational spectra (x and y directions defined in the molecule) in Figure 2. The most striking feature of the experimental spectra are in the 220–270 cm−1 region where three broad features (with approximately equal intensity) are seen in the spectrum taken parallel to the imidazole plane whereas there is only a single broad peak (with shoulder) in the spectrum taken perpendicular to the imidazole plane.
Figure 2.
Directional contributions to the VDOS of [Fe(OEP)(2-MeHIm)] for the x and y directions. For x (top panel), the exciting beam is parallel to the porphyrin plane and the imidazole plane, for y (bottom panel), the beam is parallel to the porphyrin plane and perpendicular to the imidazole plane. In each panel, the solid bars represent the DFT-predicted values; the solid line is the experimentally observed spectrum and the filled spectrum is the predicted spectrum based on the sum of 15 cm−1 (FWHH) Gaussians with areas determined by the e2 values. The numbers on the filled (predicted) spectra are the values of the apparent peak maxima.
The central issue of this investigation was to understand the significance of the axial imidazole ligand and possible orientation effects on the in-plane vibrational spectrum and the origins of the loss of x, y degeneracy. We had previously shown that the orientation of the axial NO ligand in [Fe(OEP)(NO)] dominated the direction of the in-plane iron motion and not the in-plane Fe–Np bonds.64 This led to in-plane iron vibrations that were largely parallel and perpendicular to the projection of the FeNO group on the porphyrin plane, e.g., the iron motion directions are approximately 45° away from the in-plane Fe–Np (bond) directions. Could the same effect be present in the five-coordinate imidazole derivatives?
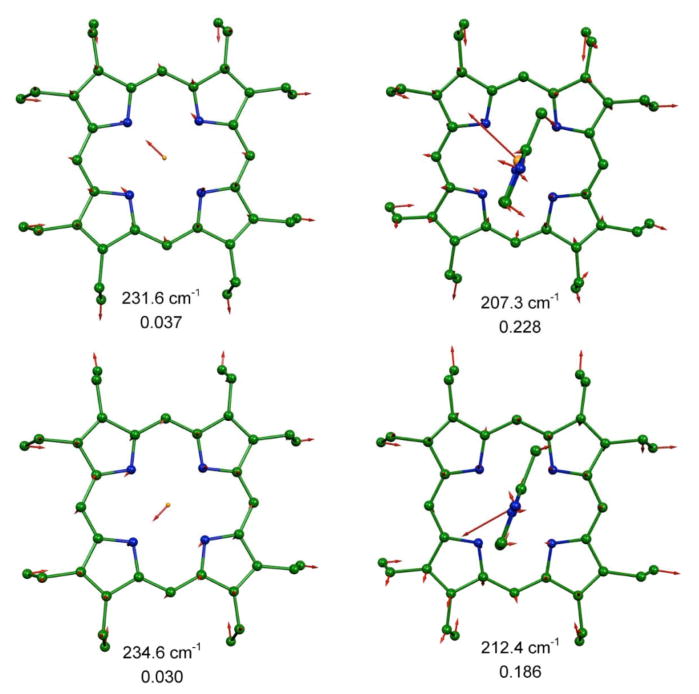
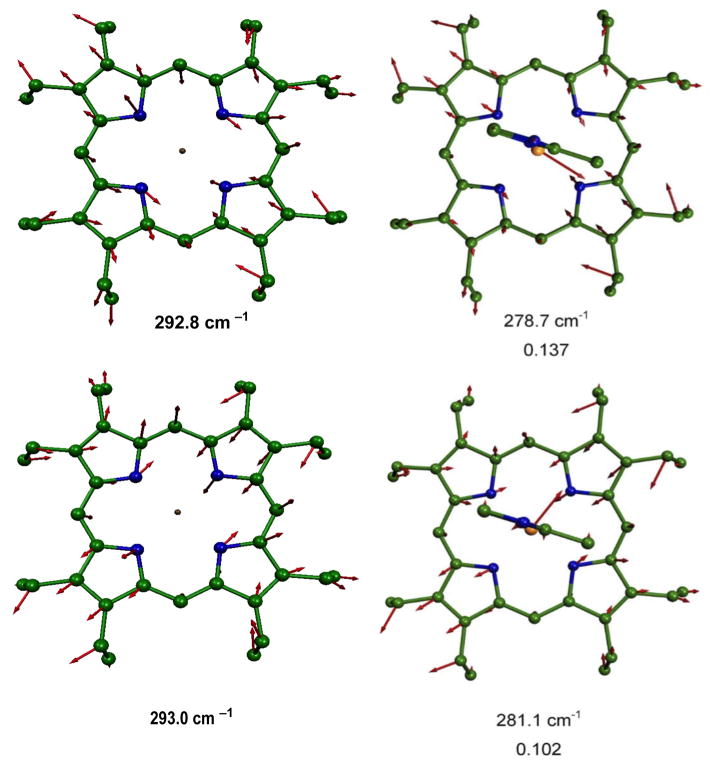
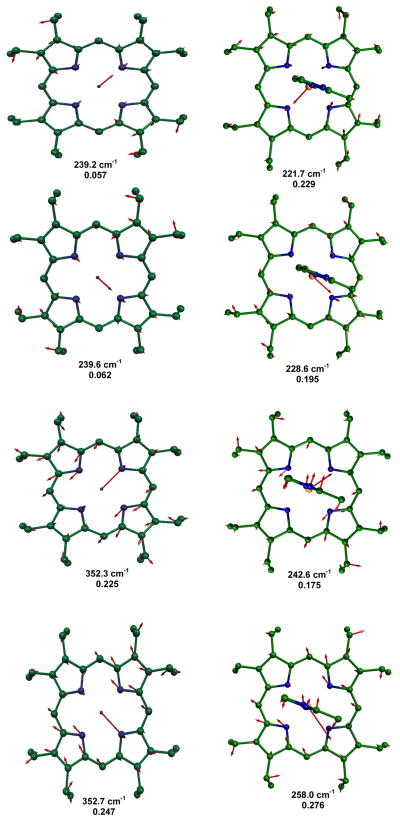
To aid in understanding the probable directional properties of the vibrational spectrum, we compare the predicted in-plane vibrations of [Fe(OEP)(2-MeHIm)] with the analogous predicted vibrations in four-coordinate [Fe(OEP)] which exhibits approximate x, y degeneracy. In Figures 3 to 5, we compare modes in [Fe(OEP)] and [Fe(OEP)(2-MeHIm)] that involve similar atomic motions on the basis of vibrational correlational analysis.62, 81, 82 In all illustrations the iron motion is exactly in the porphyrin plane, or nearly so, and the porphyrin plane is parallel to the page. We note that in [Fe(OEP)] the iron motion is exactly along the Fe–Np bond directions, as expected, but in [Fe(OEP)(2-MeHIm)] the motion deviates from these directions. However, the deviations are not completely consistent with the imidazole directing the iron motion either parallel or perpendicular to the imidazole plane. We can conclude that the iron–imidazole interactions have some effect on iron motion but not as dramatic as the effects from Fe–NO interactions in [Fe(OEP)(NO)].
Figure 3.
MOLEKEL illustration showing the two predicted lowest frequency in-plane modes for [Fe(OEP)(2-MeHIm)] and their comparison with the similar modes in [Fe(OEP)]. In all MOLEKEL illustrations, arrows represent the mass-weighted displacements of the individual atoms. For ease of visualization each arrow is 100 (mj/mF e)1/2 times longer than the zero-point vibration amplitude of atom j. e2 values are listed below each frequency. Color scheme: cyan = iron, green = carbon, blue = nitrogen. In this and other figures, hydrogens are omitted for clarity.
Figure 5.
MOLEKEL illustration showing the two predicted highest frequency in-plane modes for [Fe(OEP)(2-MeHIm)] and their comparison with the similar modes in [Fe(OEP)]. e2 values are listed below each frequency.
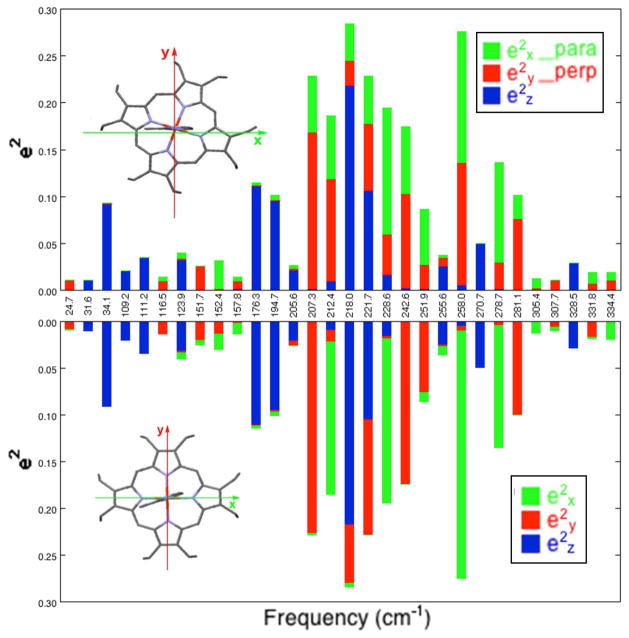
To best illustrate the direction of iron motion, we show in Figure 6 the direction of the predicted iron motion in terms of two different coordinate systems, both defined in the molecular structure. In the top panel of Figure 6, the coordinate system is defined with x and y parallel and perpendicular to the axial imidazole plane, whereas in the bottom panel x and y are defined along the Fe–Np bond directions. The two coordinate systems are also illustrated in the figure. Figures 3 to 6 clearly shows that the predicted motions of the iron are close to but not exactly along the Fe–Np bonds.
Figure 6.
Bar graph showing DFT-predicted directional characteristics of all 30 modes of the imidazole complex [Fe(OEP)(2-MeHIm)] with e2Fe > 0.01 for two different definitions of the orthogonal coordinate system. In the top panel x is defined as parallel to the imidazole plane and y is defined as perpendicular to the imidazole plane, whereas in the bottom panel x and y are defined along the Fe–Np bond directions. (Coordinate directions also shown in the porphyrin outlines.) Color code: , green; , red; , blue.
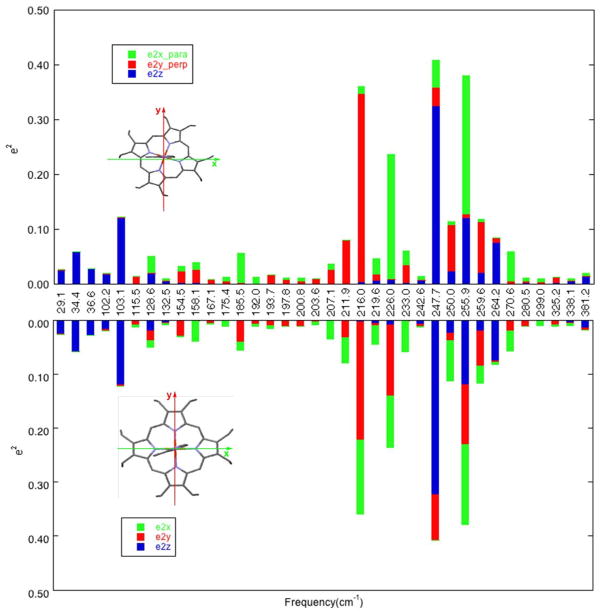
We thus conclude that the effects of the imidazole ligand orientation on the direction of the in-plane iron motion in [Fe(OEP)(2-MeHIm)] are modest, even though the imidazole–iron interactions do lead to a loss of the in-plane x, y degeneracy.88 This is in distinct contrast to the predictions for the imidazolate complex where the iron–imidazolate interactions not only lead to the loss of the x, y degeneracy but also to distinct shifts in the directions of the in-plane iron motion. For the imidazolate complex, [Fe(OEP)(2-MeIm−)]−, the DFT predictions show that the direction of the in-plane iron motions are along the directions parallel and perpendicular to the imidazolate plane, and far from being along Fe–Np directions.67, 89 This is illustrated in Figure 7, which is analogous to Figure 6. As can be seen, there is a strong reversal of the orientation of the iron motion directions with respect to the orientation of the axial ligand. Unfortunately, the crystal system for the imidazolate complexes did not permit an experimental verification of the DFT predictions. As we have noted previously,67 the iron in-plane motions are found to shift to lower frequencies for the imidazolate derivatives, consistent with stronger Fe–ligand π bonding in the imidazolate. This comparison is found for both the OEP and TPP derivatives of imidazole and imidazolate.
Figure 7.
Bar graph showing DFT-predicted directional characteristics of all 36 modes of the imidazolate complex [Fe(OEP)(2-MeIm−)]− with e2Fe > 0.01 for two different definitions of the orthogonal coordinate system. In the top panel x is defined as parallel to the imidazolate plane and y is defined as perpendicular to the imidazolate plane, whereas in the bottom panel x and y are defined along the Fe–Np bond directions. (Coordinate directions also shown in the porphyrin outlines.) Color code: , green; , red; , blue.
Summary
The series of the three complexes ([Fe(OEP)(L)], L = NO, imidazolate, and imidazole) for which we have explored iron motion directionality show that the axial ligand effects on direction of the in-plane iron motion follows the order NO > imidazolate > imidazole. This series follows the order of the importance of iron to ligand π-backbonding, with the smallest π-bonding in the imidazole complex.75 The axial Fe–N bond distances in the three systems are 1.722,90 2.058,91 and 2.147 Å,39 respectively.
Supplementary Material
Figure 4.
MOLEKEL illustration showing the four predicted mid-frequency range in-plane modes for [Fe(OEP)(2-MeHIm)] and their comparison with the similar modes in [Fe(OEP)]. e2 values are listed below each frequency. The 221.7 cm−1 mode has a modest amount of out-of-plane character.
Acknowledgments
We thank the National Institutes of Health for support of this research under Grant GM-38401 to WRS, the National Natural Science Foundation of China (No. 21271133) for support of this research to CH, and the NSF under CHE-1026369 to JTS. Use of the Advanced Photon Source, an Office of Science User Facility operated for the US Department of Energy (DOE) Office of Science by Argonne National Laboratory, was supported by the U.S. DOE under Contract No. DE-AC02-06CH11357. We thank Lili Gao for assistance with NRVS data reduction.
Footnotes
Abbreviations used: OEP, dianion of octaethylporphyrinate; TPP, dianion of tetraphenyl-porphyrinate; TpivPP, dianion of picket fence porphyrinate; Por, dianion of generalized porphyrinate 3-ClPy, 3-chloropyridine; 2-MeHIm, 2-methylimidazole; 2-MeIm−, 2-methylimidazolate; Im, generalized imidazole; EPR, electron paramagnetic resonance; Np, porphyrinate nitrogen atom; NRVS, nuclear resonance vibrational spectroscopy,
Supporting Information Available. Tables S1–S3 give predicted frequencies and e2 values for iron in [Fe(OEP)(2-MeHIm)] and [Fe(OEP)]. Table S4 provides the calculated Cartesian coordinates. Figures S1–S9 show experimental and calculated NRVS spectra for [Fe(OEP)(2-MeHIm)] and Figure S10 shows the experimental in-plane asymmetry for [Fe(TpivPP)(2-MeHIm)]. This material is available free of charge via the Internet at http://pubs.acs.org.
References and Notes
- 2.Scheidt WR, Geiger DK. J Chem Soc, Chem Commun. 1979:1154. [Google Scholar]
- 3.Scheidt WR, Geiger DK, Haller KJ. J Am Chem Soc. 1982;104:495. [Google Scholar]
- 4.Scheidt WR, Geiger DK, Hayes RG, Lang G. J Am Chem Soc. 1983;105:2625. [Google Scholar]
- 5.Blumberg WE, Peisach J. Adv Chem Ser. 1971;100:271.1. [Google Scholar]
- 6.Peisach J, Blumberg WE, Adler AD. Ann NY Acad Sci. 1973;206:310. doi: 10.1111/j.1749-6632.1973.tb43219.x. [DOI] [PubMed] [Google Scholar]
- 7.Taylor CPS. Biochim Biophys Acta. 1977;491:137. doi: 10.1016/0005-2795(77)90049-6. [DOI] [PubMed] [Google Scholar]
- 8.Palmer G. Biochem Soc Trans. 1985;13:548. doi: 10.1042/bst0130548. [DOI] [PubMed] [Google Scholar]
- 9.Muhoberac BB, Wharton DC. J Biol Chem. 1983;258:3019. [PubMed] [Google Scholar]
- 10.Brautigan DL, Feinberg BA, Hoffman BM, Margoliash E, Peisach J, Blumberg WE. J Biol Chem. 1977;252:574. [PubMed] [Google Scholar]
- 11.Migita CT, Iwaizumi M. J Am Chem Soc. 1981;103:4378. [Google Scholar]
- 12.Carter KR, Tsai AL, Palmer G. FEBS Lett. 1981;132:243. doi: 10.1016/0014-5793(81)81170-2. [DOI] [PubMed] [Google Scholar]
- 13.Walker FA, Reis D, Balke VL. J Am Chem Soc. 1984;106:6888. [Google Scholar]
- 14.Walker FA, Huynh BH, Scheidt WR, Osvath SR. J Am Chem Soc. 1986;108:5288. [Google Scholar]
- 15.Scheidt WR, Kirner JF, Hoard JL, Reed CA. J Am Chem Soc. 1987;109:1963. [Google Scholar]
- 16.Scheidt WR, Osvath SR, Lee YJ. J Am Chem Soc. 1987;109:1958. [Google Scholar]
- 17.Quinn R, Valentine JS, Byrn MP, Strouse CE. J Am Chem Soc. 1987;109:3301. [Google Scholar]
- 18.Soltis SM, Strouse CE. J Am Chem Soc. 1988;110:2824. [Google Scholar]
- 19.Safo MK, Gupta GP, Walker FA, Scheidt WR. J Am Chem Soc. 1991;113:5497. [Google Scholar]
- 20.Safo MK, Gupta GP, Watson CT, Simonis U, Walker FA, Scheidt WR. J Am Chem Soc. 1992;114:7066. [Google Scholar]
- 21.Safo MK, Walker FA, Raitsimring AM, Walters WP, Dolata DP, Debrunner PG, Scheidt WR. J Am Chem Soc. 1994;116:7760. [Google Scholar]
- 22.Munro OQ, Serth-Guzzo JA, Turowska-Tyrk I, Mohanrao K, Shokhireva TKh, Walker FA, Debrunner PG, Scheidt WR. J Am Chem Soc. 1999;121:11144. [Google Scholar]
- 23.Higgins TB, Safo MK, Scheidt WR. Inorg Chim Acta. 1990;178:261. [Google Scholar]
- 24.Hatano K, Safo MK, Walker FA, Scheidt WR. Inorg Chem. 1991;30:1643. [Google Scholar]
- 25.Little RG, Dymock KR, Ibers JA. J Am Chem Soc. 1975;97:4532. doi: 10.1021/ja00849a014. [DOI] [PubMed] [Google Scholar]
- 26.Munro OQ, Marques HM, Debrunner PG, Mohanrao K, Scheidt WR. J Am Chem Soc. 1995;117:935. [Google Scholar]
- 27.Medforth CJ, Muzzi CM, Shea KM, Smith KM, Abraham RJ, Jia S, Shelnutt JA. J Chem Soc, Perkin Trans 2. 1997:833. [Google Scholar]
- 28.Ogura H, Yatsunyk L, Medforth CJ, Smith KM, Barkigia KM, Renner MW, Melamed D, Walker FA. J Am Chem Soc. 2001;123:6564. doi: 10.1021/ja004053s. [DOI] [PubMed] [Google Scholar]
- 29.Yatsunyk LA, Carducci MD, Walker FA. J Am Chem Soc. 2003;125:15986. doi: 10.1021/ja036398r. [DOI] [PubMed] [Google Scholar]
- 30.Teschner T, Yatsunyk L, Schünemann V, Paulsen H, Winkler H, Hu C, Scheidt WR, Walker FA, Trautwein AX. J Am Chem Soc. 2006;128:1379. doi: 10.1021/ja056343k. [DOI] [PMC free article] [PubMed] [Google Scholar]
- 31.Hu C, Noll BC, Schulz CE, Scheidt WR. Inorg Chem. 2005;44:4346. doi: 10.1021/ic050320p. [DOI] [PMC free article] [PubMed] [Google Scholar]
- 32.Safo MK, Scheidt WR, Gupta GP. Inorg Chem. 1990;29:626. [Google Scholar]
- 33.Safo MK, Nesset MJM, Walker FA, Debrunner PG, Scheidt WR. J Am Chem Soc. 1997;119:9438. [Google Scholar]
- 34.Hoard JL. personal communication. See also Hoard JL, Scheidt WR. Proc Natl Acad Sci USA. 1973;70:3919. doi: 10.1073/pnas.70.12.3919.
- 35.Hu C, Roth A, Ellison MK, An J, Ellis CM, Schulz CE, Scheidt WR. J Am Chem Soc. 2005;127:5675. doi: 10.1021/ja044077p. [DOI] [PMC free article] [PubMed] [Google Scholar]
- 36.Ellison MK, Schulz CE, Scheidt WR. Inorg Chem. 2002;41:2173. doi: 10.1021/ic020012g. [DOI] [PubMed] [Google Scholar]
- 37.Jameson GB, Molinaro FS, Ibers JA, Collman JP, Brauman JI, Rose E, Suslick KS. J Am Chem Soc. 1980;102:3224. [Google Scholar]
- 38.Momenteau M, Scheidt WR, Eigenbrot CW, Reed CA. J Am Chem Soc. 1988;110:1207. [Google Scholar]
- 39.Hu C, An J, Noll BC, Schulz CE, Scheidt WR. Inorg Chem. 2006;45:4177. doi: 10.1021/ic052194v. [DOI] [PMC free article] [PubMed] [Google Scholar]
- 40.Hu C, Noll BC, Piccoli PMB, Schulz AJ. J Am Chem Soc. 2008;130:3127. doi: 10.1021/ja078222l. [DOI] [PMC free article] [PubMed] [Google Scholar]
- 41.Hu C, Noll BC, Schulz CE, Scheidt WR. Inorg Chem. 2008;47:8884. doi: 10.1021/ic8009496. [DOI] [PMC free article] [PubMed] [Google Scholar]
- 42.Hu C, Noll BC, Schulz CE, Scheidt WR. Inorg Chem. 2010;49:10984. doi: 10.1021/ic101469e. [DOI] [PMC free article] [PubMed] [Google Scholar]
- 43.Scheidt WR, Chipman DM. J Am Chem Soc. 1986;108:1163. [Google Scholar]
- 44.Spiro TG, editor. Biological Application of Raman Spectroscopy; Wiley-Interscience; New York: 1998. [Google Scholar]
- 45.Smulevich G, Hu S, Rodgers KR, Goodin DB, Smith KA, Spiro TG. Biospectroscopy. 1996;2:365. [Google Scholar]
- 46.Smulevich G, Feis A, Howes BD. Acc Chem Res. 2005;38:433. doi: 10.1021/ar020112q. [DOI] [PubMed] [Google Scholar]
- 47.Argade PV, Sassaroli M, Rousseau DL, Inubushi T, Ikeda-Saito M, Lapidot A. J Am Chem Soc. 1984;106:6593. [Google Scholar]
- 48.Teraoka J, Kitagawa T. J Biol Chem. 1981;256:3969. [PubMed] [Google Scholar]
- 49.Argade PV, Ching YC, Rousseau DL. Science. 1984;255:329. doi: 10.1126/science.6330890. [DOI] [PubMed] [Google Scholar]
- 50.Shepherd M, Barynin V, Lu C, Bernhardt PV, Wu G, Yeh SR, Egawa T, Sedelnikova SE, Rice DW, Wilson JL, Poole RK. J Biol Chem. 2010;285:12747. doi: 10.1074/jbc.M109.084509. [DOI] [PMC free article] [PubMed] [Google Scholar]
- 51.Franzen S, Roach MP, Chen YP, Dyer BR, Woodruff WH, Dawson JH. J Am Chem Soc. 1998;120:4658. [Google Scholar]
- 52.Barth A, Zscherp C. Q Rev Biophys. 2002;35:369. doi: 10.1017/s0033583502003815. [DOI] [PubMed] [Google Scholar]
- 53.Marboutin L, Desbois A, Berthomieu C. J Phys Chem B. 2009;113:4492. doi: 10.1021/jp810774g. [DOI] [PubMed] [Google Scholar]
- 54.Dörr S, Schade U, Hellwig P, Ortolani M. J Phys Chem B. 2007;111:14418. doi: 10.1021/jp076666y. [DOI] [PubMed] [Google Scholar]
- 55.El Khoury Y, Hellwig P. Chem Phys Chem. 2011;12:2669. doi: 10.1002/cphc.201100165. [DOI] [PubMed] [Google Scholar]
- 56.Seto M, Yota Y, Kikuta S, Zhang XW, Ando M. Phys Rev Lett. 1995;74:3828. doi: 10.1103/PhysRevLett.74.3828. [DOI] [PubMed] [Google Scholar]
- 57.Sturhahn W, Toellner TS, Alp EE, Zhang XW, Ando M, Yoda Y, Kikuta S, Seto M, Kimball CW, Dabrowski B. Phys Rev Lett. 1995;74:3832. doi: 10.1103/PhysRevLett.74.3832. [DOI] [PubMed] [Google Scholar]
- 58.Sturhahn W, Kohn VG. Hyperfine Interact. 1999;123:357. [Google Scholar]
- 59.Mao HK, Xu J, Struzhkin VV, Shu J, Hemley RJ, Sturhahn W, Hu MY, Alp EE, Vocadlo L, Alfe D, Price GD, Gillan MJ, Schwoerer-Bohning M, Hansermann D, Eng P, Shen G, Giefers H, Lubbers R, Wortmann G. Science. 2001;292:914. doi: 10.1126/science.1057670. [DOI] [PubMed] [Google Scholar]
- 60.Scheidt WR, Durbin SM, Sage JT. J Inorg Biochem. 2005;99:60. doi: 10.1016/j.jinorgbio.2004.11.004. [DOI] [PubMed] [Google Scholar]
- 61.Leu BM, Zgierski Wyllie GRA, Scheidt WR, Sturhahn W, Alp EE, Durbin SM, Sage JT. J Am Chem Soc. 2004;126:4211. doi: 10.1021/ja038526h. [DOI] [PMC free article] [PubMed] [Google Scholar]
- 62.Barabanschikov A, Demidov A, Kubo M, Champion PM, Sage JT, Zhao J, Sturhahn W, Alp EE. J Chem Phys. 2011;135:015101. doi: 10.1063/1.3598473. [DOI] [PMC free article] [PubMed] [Google Scholar]
- 63.Toellner TS. Hyperfine Interact. 2000;125:3, 1. [Google Scholar]
- 64.Pavlik JW, Barabanschikov A, Oliver AG, Alp EE, Sturhahn W, Zhao J, Sage JT, Scheidt WR. Angew Chem, Int Ed Engl. 2010;49:4400. doi: 10.1002/anie.201000928. [DOI] [PMC free article] [PubMed] [Google Scholar]
- 65.Petrenko T, Sturhahn W, Neese F. Hyperfine Interact. 2007;175:165. [Google Scholar]
- 66.Hu C, Barabanschikov A, Ellison MK, Zhao J, Alp EE, Sturhahn W, Zgierski MZ, Sage JT, Scheidt WR. Inorg Chem. 2012;51:1359. doi: 10.1021/ic201580v. [DOI] [PMC free article] [PubMed] [Google Scholar]
- 67.Hu C, Peng Q, Silvernail NJ, Barabanschikov A, Zhao J, Alp EE, Sturhahn WJ, Sage JT, Scheidt WR. Inorg Chem. 2013;52:3170. doi: 10.1021/ic3026396. [DOI] [PMC free article] [PubMed] [Google Scholar]
- 68.Milgram BC, Eskildsen K, Richter SM, Scheidt WR, Scheidt KA. J Org Chem. 2007;72:3941. doi: 10.1021/jo070389+. [DOI] [PMC free article] [PubMed] [Google Scholar]
- 69.Landergren M, Baltzer L. Inorg Chem. 1990;29:556. [Google Scholar]
- 70.Sage JT, Paxson C, Wyllie GRA, Sturhahn W, Durbin SM, Champion PM, Alp EE, Scheidt WR. J Phys: Condens Matter. 2001;13:7707. [Google Scholar]
- 71.Frisch MJ, Trucks GW, Schlegel HB, Scuseria GE, Robb MA, Cheeseman JR, Scalmani G, Barone V, Mennucci B, Petersson GA, Nakatsuji H, Caricato M, Li X, Hratchian HP, Izmaylov AF, Bloino J, Zheng G, Sonnenberg JL, Hada M, Ehara M, Toyota K, Fukuda R, Hasegawa J, Ishida M, Nakajima T, Honda Y, Kitao O, Nakai H, Vreven T, Montgomery JA, Jr, Peralta JE, Ogliaro F, Bearpark M, Heyd JJ, Brothers E, Kudin KN, Staroverov VN, Kobayashi R, Normand J, Raghavachari K, Rendell A, Burant JC, Iyengar SS, Tomasi J, Cossi M, Rega N, Millam JM, Klene M, Knox JE, Cross JB, Bakken V, Adamo C, Jaramillo J, Gomperts R, Stratmann RE, Yazyev O, Austin AJ, Cammi R, Pomelli C, Ochterski JW, Martin RL, Morokuma K, Zakrzewski VG, Voth GA, Salvador P, Dannenberg JJ, Dapprich S, Daniels AD, Farkas O, Foresman JB, Ortiz JV, Cioslowski J, Fox DJ. Gaussian09, Revision A.02. Gaussian, Inc; Wallingford CT: 2009. [Google Scholar]
- 72.(a) Becke AD. Phys Rev. 1988;A38:3089. [Google Scholar]; (b) Perdew J. Phys Rev B. 1986;33:8822. doi: 10.1103/physrevb.33.8822. [DOI] [PubMed] [Google Scholar]
- 73.Schaefer A, Horn H, Ahlrichs RJ. J Phys Chem. 1992;97:2571. [Google Scholar]
- 74.Although we have not analyzed the electronic structure in detail from these calculations, we observe that it is closely similar to that reported in reference 75, where the nature of the doubly occupied iron orbital was carefully analyzed.
- 75.Hu C, Sulok CD, Paulat F, Lehnert N, Twigg AI, Hendrich MP, Schulz CE, Scheidt WR. J Am Chem Soc. 2010;132:3737. doi: 10.1021/ja907584x. [DOI] [PMC free article] [PubMed] [Google Scholar]
- 76.Peng Q, Pavlik JW, Scheidt WR, Wiest O. J Chem Theory Comput. 2012;8:214. doi: 10.1021/ct2006456. [DOI] [PMC free article] [PubMed] [Google Scholar]
- 77.Note: There are two possible definitions of the x and y coordinate system for this molecule. One has the x and y coordinates along the iron–nitrogen bonds (4N-inplane), the other has x parallel to the imidazole plane and y perpendicular to the imidazole plane.
- 78.(a) Becke AD. Phys Rev. 1988;A38:3098. doi: 10.1103/physreva.38.3098. [DOI] [PubMed] [Google Scholar]; (b) Becke AD. J Chem Phys. 1993;98:1372. [Google Scholar]; (c) Becke AD. J Chem Phys. 1993;98:5648. [Google Scholar]; (d) Lee C, Yang W, Parr RG. Phys Rev. 1988;B37:785. doi: 10.1103/physrevb.37.785. [DOI] [PubMed] [Google Scholar]
- 79.Zhao Y, Truhlar DG. Theor Chem Acc. 2008;120:215. [Google Scholar]
- 80.Zhao Y, Truhlar DG. J Chem Phys. 2006;125:194101. doi: 10.1063/1.2370993. [DOI] [PubMed] [Google Scholar]
- 81.Grafton AK, Wheeler RA. J Comput Chem. 1998;19:1663. [Google Scholar]
- 82.Grafton AK. J Comput Chem. 2007;28:1290. doi: 10.1002/jcc.20642. [DOI] [PubMed] [Google Scholar]
- 83.Although the B3LYP functional has been used for many studies of porphyrin complexes, the limitations of the DFT calculations utilizing the B3LYP functional has been noted several times.84–87
- 84.Ghosh A. J Biol Inorg Chem. 2006;11:712. doi: 10.1007/s00775-006-0135-4. [DOI] [PubMed] [Google Scholar]
- 85.Strickland N, Harvey JN. J Phys Chem B. 2007;111:841. doi: 10.1021/jp064091j. [DOI] [PubMed] [Google Scholar]
- 86.Rydberg P, Olsen L. J Phys Chem A. 2009;113:11949. doi: 10.1021/jp9035716. [DOI] [PubMed] [Google Scholar]
- 87.Kepp KP. J Inorg Biochem. 2011;105:1286. doi: 10.1016/j.jinorgbio.2011.07.012. [DOI] [PubMed] [Google Scholar]
- 88.We have also measured the oriented crystal spectra for [Fe(TpivPP)(2-MeHIm)] and the results are shown in Figure S10. Detailed analysis was not performed.
- 89.MOLEKEL illustrations of the predicted in-plane motion for [Fe(OEP)(2-MeIm−)]− is given in Figures S5 and S6 of the SI for reference 67. The differences in the direction of the iron motion between the imidazole and imidazolate complexes is clear.
- 90.(a) Ellison MK, Scheidt WR. J Am Chem Soc. 1997;119:7404. [Google Scholar]; (b) Scheidt WR, Duval HF, Neal TJ, Ellison MK. J Am Chem Soc. 2000;122:4651. [Google Scholar]
- 91.Hu C, Noll BC, Schulz CE, Scheidt WR. J Am Chem Soc. 2005;127:15018. doi: 10.1021/ja055129t. [DOI] [PMC free article] [PubMed] [Google Scholar]
Associated Data
This section collects any data citations, data availability statements, or supplementary materials included in this article.


