Abstract
Ribavirin (1, 2, 4-triazole-3-carboxamide riboside) is a well-known antiviral drug. Ribavirin has also been reported to inhibit human S-adenosyl-L-homocysteine hydrolase (Hs-SAHH), which catalyzes the conversion of S-adenosyl-L-homocysteine to adenosine and homocysteine. We now report that ribavirin, which is structurally similar to adenosine, produces time-dependent inactivation of Hs-SAHH and Trypanosoma cruzi SAHH (Tc-SAHH). Ribavirin binds to the adenosine-binding site of the two SAHHs and reduces the NAD+ cofactor to NADH. The reversible binding step of ribavirin to Hs-SAHH and Tc-SAHH has similar KI values (266 and 194 μM), but the slow inactivation step is five fold faster with Tc-SAHH. Ribavirin may provide a structural lead for design of more selective inhibitors of Tc-SAHH as potential anti-parasitic drugs.
Keywords: AdoHcy hydrolases, ribavirin, selective inhibitor, Trypanosoma cruzi
Introduction
In both mammals and parasites, S-adenosyl-l-homocysteine hydrolase (SAHH)1, 2 catalyzes the hydrolysis of S-adenosyl-l-homocysteine (AdoHcy) to adenosine (Ado) and l-homocysteine (Hcy). AdoHcy is a product of all transmethylation reactions that utilize S-adenosylmethionine (AdoMet) as a methyl donor. Because AdoHcy is a product inhibitor of AdoMet-dependent transmethylations, SAHH plays a crucial role in regulating methylation of macromolecules and small molecules.3 Inhibitors of parasite SAHHs (e.g., those of Leishmania,4 Plasmodium,5 Trypanosoma2) are potential anti-parasitic agents, if their inhibitory activity is weaker for Hs-SAHH. This study addresses Tc-SAHH, the SAHH of Trypanosoma cruzi, the organism which causes Chagas disease in humans.6
Both Hs-SAHH7 and Tc-SAHH (unpublished data of Drs. Q.-S. Li and W. Huang) are homotetramers. Each monomer contains a substrate binding domain and a cofactor (NAD+/NADH) binding domain. The enzyme containing the cofactor (NAD+) has an “open” conformation (from X-ray crystallographic structure of the rat-liver enzyme,8 which shows 97 % sequence identity to Hs-SAHH) while the enzyme containing the cofactor (NADH) and the oxidized form of the inhibitor (DHCeA1 or NepA9) has a “closed” conformation [from X-ray crystallographic structures of Hs-SAHH1, 9 and Tc-SAHH (unpublished data of Q.-S. Li and W. Huang)]. Hs-SAHH has 432 residues per subunit1 while Tc-SAHH has 437 residues per subunit2. Hs-SAHH and Tc-SAHH share 74 % amino acid identity and the X-ray structures show no significant differences between the two enzymes. The kinetics and thermodynamics of binding of NAD+ and NADH are qualitatively similar but quantitatively different for Hs-SAHH and Tc-SAHH.10 The nicotinamide cofactors are involved in a redox step of the catalytic mechanism of SAHHs,11 so that the different binding properties suggest a possible role in achieving differential inhibition of Tc-SAHH over Hs-SAHH for substrate analogs that undergo the redox reaction.
However, the situation appears more complex. A screen of 122 substrate analogs kindly provided by Drs. Morris Robins and Stanley Wnuk (unpublished work) resulted in some selective inhibition of Tc-SAHH by only 12 (only one similar in activity to ribavirin, considered below) while the remainder showed no inhibition of either enzyme (89), roughly equivalent inhibition of both enzymes (10) or stronger inhibition of Hs-SAHH (11).
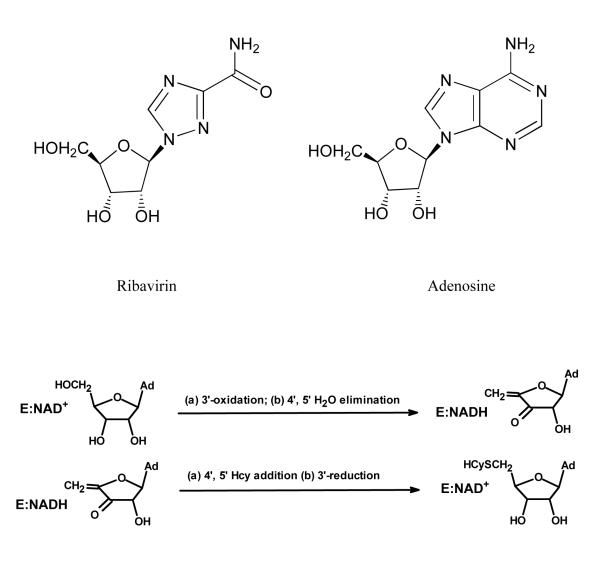
Ribavirin (Figure 1), an antiviral drug12, which is an analog of adenosine, has been reported to exhibit inhibition of Hs-SAHH.13 In this study we report the selective inactivation by ribavirin of Tc-SAHH over Hs-SAHH and some of its kinetic features.
Figure 1.
Top: Structures of ribavirin and adenosine. Bottom: Catalytic cycle of SAHHs in the synthetic direction, showing 3′-oxidation of substrate by the tightly-bound NAD+ in the reactions leading to the intermediate, followed by 3′-reduction in the reactions leading from the intermediate to the final product.
Materials and Methods
Overexpression and Purification of Hs-SAHH and Tc-SAHH
Recombinant Hs-SAHH and Tc-SAHH plasmids were each transformed into the competent E. coli strain JM109 (Sigma). The cell culture and purification procedures are as described in previous work.10 The procedure for preparation of the cell-free extract is also similar to that previously described2 with modifications as follows. The harvested cells from a 2 liter culture were lysed on ice for 4-8 hours with 2.5 mg/mL lysozyme (Sigma) in a 20 mL Tris-HCl buffer [40 mM Tris-HCl, pH 7.4, 6 mM MgCl2, 1 mM NAD+, proteinase inhibitor Apotinin 0.2 TIU/mL (Sigma), Pefabloc SC 1.25 mM (Fluka), DNAse I 10 U/mL (Roche)]. The solution was stirred until no cell clumps were visible, after which cell lysis was completed by three freeze-thawing cycles. The cell lysate was centrifuged at 18,000 rpm for 40 min at 4 °C and the cell-free extract was loaded onto a FPLC system for purification.
Preparation of apo-Hs-SAHH and apo-Tc-SAHH
The apo form of SAHH was prepared as previously described14 with the entire procedure being conducted at 4 °C.
Purified Hs-SAHH was first precipitated twice with 80 % (v/v) saturated acid ammonium sulfate, pH 2.92, 5 mM DTT, and the precipitated proteins were collected and dissolved in 25 mM phosphate buffer, pH 7.2, 1 mM EDTA, 5 mM DTT. A third precipitation followed with 80 % (v/v) saturated acid ammonium sulfate, pH 7.2, 2 mM DTT, and the precipitated proteins were collected and dissolved in 50 mM phosphate buffer, pH 7.2, 1 mM EDTA to afford the apo-form of Hs-SAHH. Apo-Tc-SAHH was prepared similarly except the first precipitation was carried out at pH 2.92, the second at pH 3.12.
Reconstitution of the NAD+ form and NADH form of Hs-SAHH and Tc-SAHH
Apo-SAHH (10 mg/mL) was incubated with 1 mM NAD+ in 50 mM phosphate buffer, pH 7.2, 1 mM EDTA (or 1 mM NADH in 50 mM phosphate buffer, pH 8.5, 1 mM EDTA) for 12 hours at 4 °C. Then the reconstituted NAD+ (or NADH) forms of Hs-SAHH and Tc-SAHH were purified using a Hiload Superdex 200 (16/60) column (Amersham Biosciences).
Activity assay of the NAD+ forms of Hs-SAHH and Tc-SAHH
Concentrations of apo-enzymes and holo-enzymes are expressed as molarity of monomeric subunits. SAHH activity in the hydrolytic direction (AdoHcy to Ado + Hcy) was followed as previously described.15 Briefly, the reaction was driven to completion by the deamidation of Ado catalyzed by Ado deaminase. The rate of Hcy formation was then coupled to the generation of the intensely yellow TNB2− from DTNB. TNB2− was determined spectroscopically at 412 nm using an extinction coefficient of TNB2− (13,600 M−1cm−1).15 The buffer for these measurements was 50 mM phosphate buffer, pH 7.2, including 1 mM EDTA, 40 μM DTNB, 1 U/mL ADA (Roche), 200 μM AdoHcy. The temperature was controlled by a circulating water bath at 22 °C.
SAHH activity in the synthetic direction was measured as the rate of AdoHcy production from Ado and Hcy using HPLC. The buffer for these measurements was 50 mM phosphate buffer, pH 7.2, 1 mM EDTA, 0.5 mM Ado, 0.5 mM Hcy, 10 μM NAD+. The synthetic reaction was performed at 37 °C for 12 min and was stopped by addition of 125 mM HClO4. AdoHcy was separated by use of a reversed-phase HPLC C-18 column with UV detection at the absorption wavelength of 258 nm as previously described.2
Measurement of NADH content vs. fraction of inactivation of enzyme activity
A set of ten samples of 120 μL 100 μM SAHH was incubated with 400 μM ribavirin (Sigma, R9644) in 50 mM phosphate buffer, pH 7.2, 1 mM EDTA, 100 μM NAD+ at 37 °C for 4-9 hours. SAHH activity was measured at times roughly corresponding to 25, 50, 75 and 100 % inactivation. Once the hydrolytic activity was reduced to a chosen level, the solution was immediately frozen with dry ice/ethanol. Just before analysis, the frozen solution was thawed and 90 μL of solution was transferred into a new tube and 10 μL of 1 M Na2CO3/NaHCO3 at pH 10.75 was added immediately. A volume of 700 μL of 95 % ethanol was added to denature the protein and release the NADH into solution. The precipitated proteins were removed by centrifugation and the supernatant was subjected to a fluorescence assay to determine the concentration of NADH released. The NADH released from SAHH that had been inactivated by NepA was measured as a control (100% NAD+ reduced to NADH by NepA).
Fluorescence assay
The fluorescence intensity of NADH was measured by a Photon Technologies QM-3 scanning luminescence spectrophotometer. The excitation wavelength was 340 nm and the emission wavelength was 450 nm. NADH powder (Sigma) was dissolved in 100 mM Na2CO3/NaHCO3 pH 10.75 and its concentration was determined by UV spectroscopy (εmM = 6.22, λmax = 340 nm). A series of diluted NADH standards ranging from 0.1-20 μM was prepared to make a standard curve of NADH fluorescence intensity vs. concentration. The fluorescence intensity of enzyme-bound NADH was measured by the same method and instrumentation as above but in a 50 mM phosphate buffer, pH 7.2, including 1 mM EDTA.
LC ESI+/MS analysis of SAHHs fully inactivated by ribavirin
A volume of 60 μL 100 μM SAHH was incubated with 400 μM ribavirin in 50 mM phosphate buffer, pH 7.2, 1 mM EDTA, 100 μM NAD+ at 37 °C for 4-9 hours which roughly 100 % inactivated the activity of SAHH. ESI spectra were acquired on a Q-Tof-2 (Micromass Ltd, Manchester UK) hybrid mass spectrometer operated in MS mode and acquiring data with the time-of-flight analyzer. The instrument was operated for maximum sensitivity with all lenses optimized while infusing a sample of lysozyme. The cone voltage was 60 eV and Ar was admitted to the collision cell. Spectra were acquired at 11364 Hz pusher frequency covering the mass range 800 to 3000 amu and accumulating data for 5 seconds per cycle. Time-to-mass calibration was made with CsI cluster ions acquired under the same conditions. Samples were desalted on a short column (3 cm × 1 mm ID) of reverse phase C18 resin (Zorbax, 5 μM, 300 Å). Proteins (2.5 μg) were loaded onto the reverse phase column from H2O, washed in same and eluted with H2O directly into the ESI source. The resulting suite of charge states in the ESI spectrum were subject to charge state deconvolution to present a “zero” charge mass spectrum using the MaxEnt1 routine in MassLynxs software. Samples were also analyzed using a different (acidic) buffer system: loading buffer and washing buffer were 1% formic acid solution and elution buffer was 90% methanol and 0.5% formic acid.
Kinetic model for enzyme inactivation by ribavirin
The kinetic model used for the reaction between ribavirin and the NAD+ form of SAHH is shown in Scheme 1.16 The velocity v of inactivation is given by eq 1, where [E]0 represents the total concentration of enzyme in all forms.
| (1) |
Scheme 1.

a a E(NAD) represents the NAD+ form of SAHH; E-I(NAD) represents the complex of ribavirin bound to the NAD+ form of SAHH; E’I’(NADH) represents the complex of the oxidized ribavirin bound to the NADH form of SAHH; KI represents the equilibrium dissociation constant { KI = [E(NAD)][I]/[E-I(NAD)]}.
Equilibrium affinity of NADH forms of SAHHs for ribavirin
The equilibrium binding of ribavirin (R) to the enzymes reconstituted with NADH (E(NADH)) generates a complex E-R(NADH) shown in Scheme 2. The equilibrium dissociation constant KR (= [E(NADH)][R]/[E-R(NADH)]) could serve to some degree to estimate the relative affinity of Hs-SAHH and Tc-SAHH for the unoxidized drug.
Scheme 2.

The fluorescence intensity F0 of E(NADH) is greater than F, the fluorescence intensity in the presence of ribavirin. Assuming the fluorescence intensity is reduced by quenching in the complex E-R(NADH), F at a concentration [R] of ribavirin will be given by FE [E(NADH)] + FER [E-R(NADH)] where FE and FER are the intrinsic fluorescence intensities of the two forms of the enzyme and brackets denote concentrations. The normalized decrease in fluorescence intensity ΔF/[E]0 is then given by eq 2, where [E]0 is as above, the total concentration of enzyme in all forms:
| (2a) |
| (2b) |
| (2c) |
Measurement of ΔF as a function of [R] will therefore yield FE, FER and KR.
Results
Inhibition by ribavirin of Tc-SAHH and Hs-SAHH is time-dependent
Figure 2 shows that ribavirin inactivates both enzymes in a first-order reaction (ribavirin in 100-fold excess over enzyme). The first-order rate constant at this concentration of ribavirin is about six-fold larger for Tc-SAHH than for Hs-SAHH (caption of Figure 2).
Figure 2.
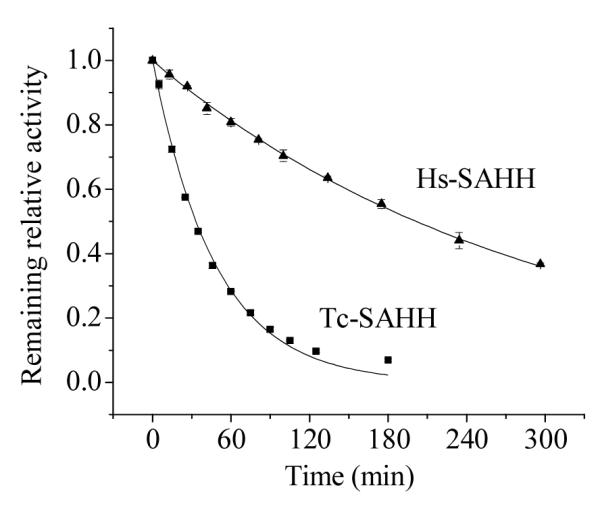
Time-dependent loss of activity of Tc-SAHH and Hs-SAHH during incubation with ribavirin. Tc-SAHH and Hs-SAHH, both 1 μM, fully reconstituted with NAD+, were incubated with 50 μM NAD+ and 100 μM ribavirin in phosphate buffer (pH 7.2) at 37 °C. The activity of the enzymes was measured in the hydrolytic direction. The exponential curves shown yield first-order rate constants of (3.48 ± 0.08) × 10−4 s−1 for Tc-SAHH and (0.57 ± 0.005) × 10−4 s−1 for Hs-SAHH.
Inactivation by ribavirin of Hs-SAHH and Tc-SAHH is accompanied by an increase in fluorescence
Figure 3 presents the time course of fluorescence emission at 450 nm (excitation 340 nm) as Hs-SAHH and Tc-SAHH are incubated with ribavirin. Fits of the data to eq 3 yield first-order rate constants of 4.05 ± 0.002 ×10⁻⁴ s−1 for Tc-SAHH and 7.54 ± 0.006 ×10⁻⁵ s−1 for Hs-SAHH, corresponding to the solid lines in Figure 3.
| (3) |
Figure 3.
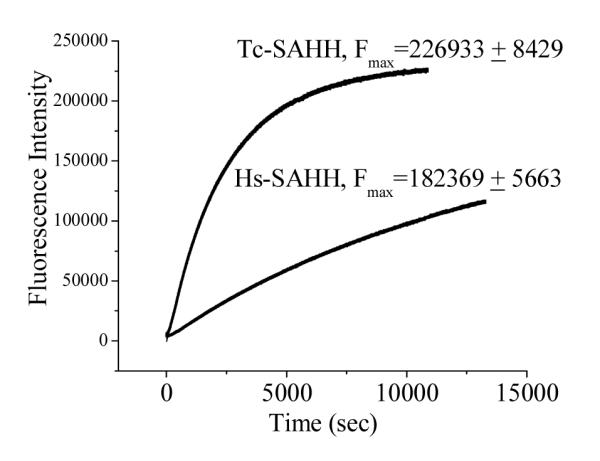
Time course of the development of fluorescence during incubation of Tc-SAHH and Hs-SAHH with ribavirin. Reconstituted NAD+ forms of Tc-SAHH and Hs-SAHH (10 μM) were incubated with 200 μM ribavirin and 100 μM NAD+ in 50 mM phosphate buffer (pH 7.2), 1 mM EDTA at 37 °C. The wavelengths of excitation (340 nm) and emission (450 nm) are consistent with the conversion of NAD+ to NADH. The solid line represent fits of the data to a first-order relationship (eq 3), which yields F0 = −549 ± 49 (Tc-SAHH), 2196 ± 11 (Hs-SAHH); k = (4.05 ± 0.002) × 10−4 s−1 (Tc-SAHH), (7.54 ± 0.006) × 10−5 s−1 (Hs-SAHH); and the values of Fmax are shown in the figure.
The values of Fmax/E0 are 2.27 ± 0.08 × 10¹⁰ M−1 for Tc-SAHH and 1.82 ± 0.06 × 10¹⁰ M−1 for Hs-SAHH. Taking the value of the molar fluorescence of the enzymes reconstituted with NADH (3.13 ± 0.14 × 10¹⁰ M−1 for Tc-SAHH and 2.20 ± 0.044 × 10¹⁰ M−1 for Hs-SAHH; see below in connection with Figure 6) as a standard of 100 %, the values of Fmax/E0 represent 72.5 ± 4.1 % (Tc-SAHH) and 82.7 ± 3.2 % (Hs-SAHH) of the fluorescence of ENADH. As a control experiment, Tc-SAHH and Hs-SAHH were incubated with NepA and the final fluorescence values determined. These were, compared to ENADH, 5.4 ± 0.3 % for Tc-SAHH and 2.4 ± 0.05 % for Hs-SAHH.
Figure 6.
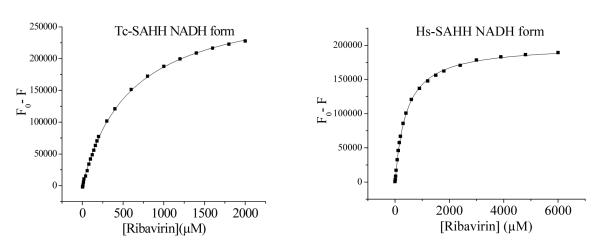
Dependence of the loss of NADH fluorescence of Tc-SAHH and Hs-SAHH, both reconstituted with NADH, on the concentration of ribavirin. The enzymes (10 μM) were incubated with various concentrations of ribavirin (0-6 mM) in 50 mM phosphate buffer (pH 7.2), 1 mM EDTA at 37 °C. Data were fit to the hyperbolic saturation model (eq 2c) and results are shown in Table S1 of the supporting information.
The fractional conversion of NAD+ to NADH in Tc-SAHH and Hs-SAHH equals the fractional degree of inactivation by ribavirin
In order to ascertain whether the increase in fluorescence that accompanies ribavirin inactivation arises from the conversion of NAD+ to NADH in the course of inactivation, samples were quenched at specific levels of inactivation and the amount of NADH present was determined. Figure 4 shows a plot of the fractional conversion to NADH vs. the fractional level of inhibition for both Hs-SAHH and Tc-SAHH. A linear fit to the total data set yields an intercept of 0.09 ± 0.04 and slope of 0.89 ± 0.07, a linear fit to the data for Hs-SAHH yields an intercept of 0.15 ± 0.06 and slope of 0.76 ± 0.08 and a linear fit to the data for Tc-SAHH yields an intercept of 0.01 ± 0.07 and slope of 0.99 ± 0.09. Thus the fractional conversion of NAD+ to NADH is equal to the fractional degree of inactivation for Tc-SAHH and probably for Hs-SAHH (predicted intercept 0.0 and slope 1.0).
Figure 4.
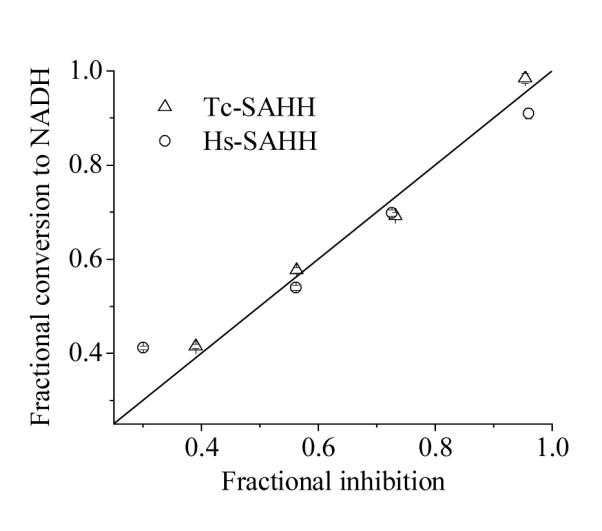
Comparison with the fractional loss of enzyme activity with the fractional conversion of enzyme-bound NAD+ to NADH in the course of ribavirin-induced inactivation of Tc-SAHH and Hs-SAHH. Tc-SAHH and Hs-SAHH (100 μM, reconstituted with NAD+) were incubated with 400 μM ribavirin and 100 μM NAD+ in 50 mM phosphate buffer (pH 7.2), 1 mM EDTA at 37 °C. Samples frozen at various fractions of inhibition were later thawed and both activity in the hydrolytic direction and NADH content determined, the latter by liberation and fluorescence determination. The data for Tc-SAHH, for Hs-SAHH, and for both enzymes together are in reasonable agreement with the expectation for an equivalence of NADH formation and inhibition (see text for calculated slopes and intercepts). The straight line shown is for intercept =0 and slope = 1.
Time-dependent inactivation by ribavirin of Hs-SAHH and Tc-SAHH conforms to a model of reversible binding followed by a slow inhibitory reaction
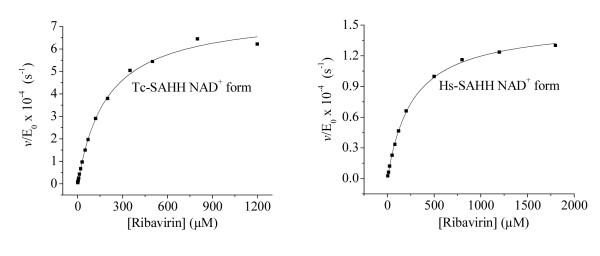
Figure 5 shows plots of the first-order rate constants at various ribavirin concentrations for the time-dependent inactivation by ribavirin of Hs-SAHH and Tc-SAHH. The curves of v/[E]0 vs. concentration of ribavirin [I] are described by the hyperbolic function of eq 4. This expression corresponds to a reversible-binding step (equilibrium constant KI) followed by a slow development of inhibition with rate constant kinact and also corresponds to various more complex models.16 The parameters obtained from the fit of the data to eq 4 are shown in Table 1.
| (4) |
Figure 5.
Dependence of the rate constant for slow inhibition of Tc-SAHH and Hs-SAHH on the concentration of ribavirin. Tc-SAHH and Hs-SAHH (9.07 μM, reconstituted with NAD+) were incubated with various concentrations of ribavirin (0-1.8 mM) and 50 μM NAD+ in 50 mM phosphate buffer (pH 7.2), 1 mM EDTA at 37 °C. The initial velocity of the development of NADH was measured by use of fluorescence (excitation at 340 nm and emission at 450 nm). Data were fit to the hyperbolic saturation model (eq 4) and results are shown in Table 1.
Table 1.
aParameters describing the rate of slow inhibition at pH 7.2 and 37 °C of Tc-SAHH and Hs-SAHH by ribavirin as a function of the concentration of ribavirin (eq 4). Experimental data and fitted curves are shown in Figure 5.
| Parameters of eq 4 | Tc-SAHH | Hs-SAHH |
|---|---|---|
| KI(μM) | 194 ± 12 | 266 ± 8 |
| kinact (s−1) | 7.6 ± 0.16 × 10⁻⁴ | 1.5 ± 0.02 × 10⁻⁴ |
| kinact/KI (M−1s−1) | 3.92 ± 0.26 | 0.56 ± 0.017 |
Tc-SAHH and Hs-SAHH fully reconstituted with NAD+ (both enzymes at 9.07 μM) were incubated with ribavirin (0-1.8 mM) and 50 μM NAD+ in 50 mM phosphate buffer (pH 7.2), 1 mM EDTA at 37 °C.
Ribavirin shows almost no discrimination in equilibrium binding to the NADH forms of Hs-SAHH and Tc-SAHH
Figure 6 shows that incubation of Hs-SAHH and Tc-SAHH, both reconstituted with NADH, with ribavirin leads to quenching of the NADH fluorescence. No NADH was released from the enzyme, so the quenching is presumably caused by binding of ribavirin adjacent to the NADH molecule in the active site. The data were fitted to the hyperbolic-saturation model of eq 2c. The dissociation constant KR of ribavirin from the ENADH:ribavirin complex was 407 ± 6 μM for Hs-SAHH and 586 ± 12 μM for Tc-SAHH (see Supporting Information, Table S1). The initial molar fluorescence of ENADH were 3.13 ± 0.14 × 10¹⁰ M−1 for Tc-SAHH and 2.20 ± 0.044 × 10¹⁰ M−1 for Hs-SAHH; the final values for the complexes with unoxidized ribavirin were 1.69 ± 0.05 × 10⁹ M−1 (5.4 ± 0.27 % of the value for ENADH) for Tc-SAHH and 1.90 ± 0.08 × 10⁹ M−1 (8.6 ± 0.4 % of the value for ENADH) for Hs-SAHH.
LC ESI+/MS analysis shows no evidence of covalent bond between ribavirin and SAHHs
The deconvoluted mass spectra show that the molecular weight of SAHHs fully inactivated by ribavirin is exactly the same as that of native SAHHs (see Supporting Information, Figure S1).
Discussion
Ribavirin exhibits time-dependent inhibition of both Hs-SAHH and Tc-SAHH with Tc-SAHH reacting about six-fold faster
Figure 2 shows that both enzymes react in a first-order fashion with ribavirin (in 100-fold excess), resulting in a completely inhibited enzyme after several hours for Tc-SAHH and considerably longer for Hs-SAHH (37 °C, pH 7.2). The ratio of first-order rate constants is around six, with Tc-SAHH reacting faster.
Inactivation of Hs-SAHH and Tc-SAHH by ribavirin is accompanied by reduction of NAD+ to NADH
Figure 3 shows that the fluorescence of the solution at a wavelength characteristic of NADH increases in the presence of ribavirin with rate constants that are similar to those seen for the development of inhibition (the differences are very likely related to the somewhat different reaction conditions required for the fluorescence experiment). NADH is not released into the solution, so that the reduced cofactor remains bound to the enzyme. When the inhibition experiment was interrupted and the enzyme denatured to release NADH, the data shown in Figure 4 are obtained. The figure shows that for both enzymes, the fractional degree of reduction of cofactor is essentially equal to the fractional degree of inhibition of the enzyme: thus cofactor reduction and enzyme inhibition are parallel events. This suggests that ribavirin is a Type I inhibitor according to the classification of Wolfe and Borchardt (Scheme 3),17 reacting as a substrate through the initial redox reaction. The same behavior is observed in the presence or absence of Hcy (see Supporting Information, Table S3), giving some indication that, on this time scale (12 min), ribavirin undergoes 3′-oxidation but not the 4′,5′-elimination reaction which would have allowed Hcy to carry it through the catalytic cycle and restore the enzyme activity. This is characteristic of other Type I inhibitors such as DHCeA and NepA, which are tightly bound in the oxidized form.
Scheme 3.

Typical type I inactivation mechanism shown by inhibitor NepA.
The Kinetics of ribavirin inactivation of Hs-SAHH and Tc-SAHH correspond to the common model of time-dependent inhibition
Figure 5 shows that the rate constants for time-dependent inhibition obey the general hyperbolic model for time-dependent inactivation (Scheme 1) which in this case corresponds to a rapid, reversible binding step (equilibrium constant KI) followed by the essentially irreversible oxidation step with rate constant kinact. The values of these parameters are given in Table 1. The initial binding is weak in both enzymes, approaching millimolar values with the affinity slightly greater for Tc-SAHH. The oxidation step is about five-fold faster for Tc-SAHH and the second-order rate constant reflecting both affinity and oxidation rates is about seven-fold greater for Tc-SAHH. There is no real suggestion from the crystallographic structures (1, 9, unpublished data of Q.-S. Li and W. Huang) of the structural origins of these rate differences.
Fluorescence differences upon binding and oxidation distinguish ribavirin from DHCeA and NepA
Both DHCeA and NepA in their oxidized forms quench the fluorescence of the NADH cofactor in the active site to about 2-5 % of its fluorescence in ENADH with no other ligand. This behavior is seen with both Hs-SAHH and Tc-SAHH. Roughly the same is true if ribavirin itself (in the reduced form) is bound to the NADH form of either enzyme. In contrast the enzyme-inhibitor complexes of ribavirin continue to exhibit around 70-80% of the fluorescence of ENADH. This origin of this effect is unknown but one possibility is that the oxidized ribavirin is unstable in the active site and decomposes to generate compounds that do not quench the NADH fluorescence. The matter is under investigation.
LC ESI+/MS analysis excludes the possibility of irreversible covalent bond between ribavirin and SAHHs
The LC/MS analyses were performed both in H2O and in an acidic (1 % formic acid) environment. Water was chosen to avoid the possible acid-catalyzed degradation of the exposed ribavirin that may be covalently bound to SAHHs. Compared to native SAHHs, there is no increase of protein molecular weight in the deconvoluted mass spectrum of SAHHs fully inactivated by ribavirin. This observation shows there is no ribavirin (oxidized or reduced) or any fragment thereof covalently attached to the SAHHs. The information we have to date indicates that the conversion of NAD+ to NADH in the SAHH active site by 3′-oxidation of ribavirin is not accompanied by or succeeded by irreversible covalent bond formation to the enzyme. Among the possible circumstances are: (a) the oxidized ribavirin, intact or as its decomposition products, either remains in the active site or departs, with the main cause of inhibition being irreversible conversion of the enzyme to the non-physiological form with NADH as the cofactor, a species which is normally restored to the NAD+ form in the second part of the catalytic cycle (Figure 1); (b) reversible covalent binding (e.g., 3′-Schiff’s base formation with lysine) is partially responsible for inhibition, the main reason still being “stalling” of the enzyme with cofactor in the wrong oxidation state.
Summary
Ribavirin shows weak inhibitory selectivity for Tc-SAHH over Hs-SAHH in its time-dependent action. It also appears to inhibit the SAHH of P. falciparum selectively (see Supporting Information, Table S2) and may therefore be useful in proceeding toward more selective inhibitors.
Supplementary Material
Acknowledgement
This study was supported by grant no. GM-29332 from the National Institute of General Medical Sciences. The authors thank Dr. Todd D. Williams and Mr. Robert Drake, both from Mass Spectrometry Laboratory, The University of Kansas, for help with the LC ESI+/MS analysis.
aAbbreviations
- 2 × YT
2 × yeast extract tryptone
- Ado
adenosine
- AdoHcy
S-adenosyl-L-homocysteine
- DTT
DL-Dithiothreitol
- EDTA
ethylenediaminetetraacetic acid
- FPLC
fast protein liquid chromatography
- Hcy
L-homocysteine
- HPLC
high performance liquid chromatography
- Hs-SAHH
SAHH from Homo sapiens (human placenta)
- NAD+
β-nicotinamide adenine dinucleotide
- NADH
β-nicotinamide adenine dinucleotide, reduced form
- P. falciparum
Plasmodium falciparum
- SAHH
S-adenosyl-L-homocysteine hydrolase, EC 3.1.1.1
- Tc-SAHH
SAHH from Trypanosoma cruzi
- T. cruzi
Trypanosoma cruzi
- DHCeA
(1’R, 2’S, 3’R)-9-(2′, 3′-dihydroxycyclopent-4′-enyl)adenine
- NepA
neplanocin A
- DTNB
5,5′-Dithiobis(2-nitrobenzoic acid)
- ESI+/MS
electrospray ionization in positive ion mode/mass spectrometry
Footnotes
Supporting Information Available. Figure S1, Table S1, Table S2 and Table S3.
Publisher's Disclaimer: This is a PDF file of an unedited manuscript that has been accepted for publication. As a service to our customers we are providing this early version of the manuscript. The manuscript will undergo copyediting, typesetting, and review of the resulting proof before it is published in its final citable form. Please note that during the production process errors may be discovered which could affect the content, and all legal disclaimers that apply to the journal pertain.
References
- 1.Turner MA, Yang X, Yin D, Kuczera K, Borchardt RT, Howell PL. Cell Biochem Biophys. 2000;33(2):101–25. doi: 10.1385/CBB:33:2:101. [DOI] [PubMed] [Google Scholar]
- 2.Parker NB, Yang X, Hanke J, Mason KA, Schowen RL, Borchardt RT, Yin DH. Exp Parasitol. 2003;105(2):149–58. doi: 10.1016/j.exppara.2003.10.001. [DOI] [PubMed] [Google Scholar]
- 3.Chiang PK. Pharmacol Ther. 1998;77(2):115–34. doi: 10.1016/s0163-7258(97)00089-2. [DOI] [PubMed] [Google Scholar]
- 4.Yang X, Borchardt RT. Arch Biochem Biophys. 2000;383(2):272–80. doi: 10.1006/abbi.2000.2087. [DOI] [PubMed] [Google Scholar]
- 5.Creedon KA, Rathod PK, Wellems TE. J Biol Chem. 1994;269(23):16364–70. [PubMed] [Google Scholar]
- 6.Teixeira RA, Nitz N, Guimaro MC, Gomes C, Santos-Buch CA. Postgrad Med J. 2006;82(974):788–798. doi: 10.1136/pgmj.2006.047357. [DOI] [PMC free article] [PubMed] [Google Scholar]
- 7.Turner MA, Yuan CS, Borchardt RT, Hershfield MS, Smith GD, Howell PL. Nat Struct Biol. 1998;5(5):369–76. doi: 10.1038/nsb0598-369. [DOI] [PubMed] [Google Scholar]
- 8.Hu Y, Komoto J, Huang Y, Gomi T, Ogawa H, Takata Y, Fujioka M, Takusagawa F. Biochemistry. 1999;38(26):8323–33. doi: 10.1021/bi990332k. [DOI] [PubMed] [Google Scholar]
- 9.Yang X, Hu Y, Yin DH, Turner MA, Wang M, Borchardt RT, Howell PL, Kuczera K, Schowen RL. Biochemistry. 2003;42(7):1900–9. doi: 10.1021/bi0262350. [DOI] [PubMed] [Google Scholar]
- 10.Li Q-S, Cai S, Borchardt RT, Fang J, Kuczera K, Middaugh CR, Schowen RL. Biochemistry. 2007;46(19):5798–5809. doi: 10.1021/bi700170m. [DOI] [PubMed] [Google Scholar]
- 11.Palmer JL, Abeles RH. J. Biol. Chem. 1979;254:1217–1226. [PubMed] [Google Scholar]
- 12.Bougie I, Bisaillon M. The Journal of Biological Chemistry. 2004;279(21):22124–30. doi: 10.1074/jbc.M400908200. [DOI] [PubMed] [Google Scholar]
- 13.Fabianowska-Majewska K, Duley JA, Simmonds HA. Biochem Pharmacol. 1994;48(5):897–903. doi: 10.1016/0006-2952(94)90360-3. [DOI] [PubMed] [Google Scholar]
- 14.Gomi T, Takata Y, Fujioka M. Biochim Biophys Acta. 1989;994(2):172–9. doi: 10.1016/0167-4838(89)90157-x. [DOI] [PubMed] [Google Scholar]
- 15.Yuan CS, Ault-Riche DB, Borchardt RT. J Biol Chem. 1996;271(45):28009–16. doi: 10.1074/jbc.271.45.28009. [DOI] [PubMed] [Google Scholar]
- 16.Cook PF, Cleland WW. Enzyme Kinetics and Mechanism. Garland Sciences Publishing; New York and London: 2007. pp. 196–204. [Google Scholar]
- 17.Wolfe MS, Borchardt RT. J Med Chem. 1991;34(5):1521–30. doi: 10.1021/jm00109a001. [DOI] [PubMed] [Google Scholar]
Associated Data
This section collects any data citations, data availability statements, or supplementary materials included in this article.


