

Abstract
Nonalcoholic fatty liver disease (NAFLD) is related to risk factors of coronary artery disease, such as dyslipidemia, diabetes, and metabolic syndrome, which are closely linked with visceral adiposity. The aim of this study was to investigate whether NAFLD was associated with coronary artery calcification (CAC), which is used as a surrogate marker for coronary atherosclerosis independent of computed tomography (CT)-measured visceral adiposity. Out of 5,648 subjects who visited one of health screening centers between 2003 and 2008, we enrolled 4,023 (mean age 56.9 ± 9.4 years, 60.7% males) subjects without known liver disease or a history of ischemic heart disease. CAC score was evaluated by the Agatston method. In univariate analyses, the presence of CAC (score >0) was significantly associated with age, sex, body mass index, aspartate aminotransferase, alanine aminotransferase, high-density lipoprotein cholesterol, triglycerides and increased odds of diabetes, hypertension, smoking, and NAFLD. Increasing CAC scores (0, <10, 10-100, ≥100) were associated with higher prevalence of NAFLD (OR 1.84, 95% CI 1.61-2.10, P<0.001). Multivariate ordinal regression analysis adjusted for traditional risk factors, and CT-measured visceral adipose tissue area in a subgroup of subjects showed that the increased CAC scores were significantly associated with the presence of NAFLD (OR 1.28, 95% CI 1.04-1.59, P=0.023) independent of visceral adiposity.
CONCLUSIONS
Patients with NAFLD are at increased risk for coronary atherosclerosis independent of classical coronary risk factors, including visceral adiposity. These data suggest that NAFLD per se might be an independent risk factor for coronary artery disease.
Keywords: Coronary Artery Disease, Coronary Artery Calcium, Hepatic Steatosis, Visceral Obesity, Visceral Adipose Tissue
Introduction
With an estimated prevalence of 20-30%, nonalcoholic fatty liver disease (NAFLD) is recognized as the most prevalent liver disease in the general population.(1) Recently, a series of studies reported that NAFLD is not only a hepatic manifestation of metabolic syndrome,(2) but is also associated with an increased risk of cardiovascular disease,(3) including coronary artery disease. Similarly, subjects with NAFLD have an elevated risk of increased carotid intima media thickness,(4-6) elevated estimated ten-year risk of developing coronary artery disease,(7, 8) reduced endothelial function,(9) and increased prevalence of vulnerable coronary plaques.(10) The association between NAFLD and increased carotid intima media thickness, a marker of carotid atherosclerosis, was independent of traditional risk factors, metabolic syndrome, and insulin resistance.(4-6) Despite these results, it remains unclear whether NAFLD is merely a marker of a risk of coronary artery disease or an independent, pathogenetic mediator that promotes a systemic proatherogenic and inflammatory state.
Recently, the coronary artery calcification (CAC), which has been focused to be an indicator of subclinical coronary artery disease, strongly correlated with the extent of atherosclerosis and the risk of cardiac events.(11-13) Like carotid intima media thickness, CAC represents the atherosclerotic burden in arterial beds. Whereas carotid intima media thickness is recognized as an indicator of generalized atherosclerosis,(14) CAC is a more specific predictor of coronary artery disease,(15) including subclinical disease.(16, 17)
To date, studies investigating the relationship between NAFLD and coronary artery disease have not adequately evaluated visceral adipose tissue (VAT) as a major contributor to the metabolic syndrome, and atherosclerosis.(10, 18-20) The purpose of the present study was to evaluate the relationship between NAFLD and CAC taking into account of the risk factors for coronary artery disease, including VAT in a large apparently healthy population.
Materials and Methods
Subjects and Study Design
This cross-sectional study retrospectively enrolled a total of 5,648 adults who visited two health screening centers, the Seoul National University Hospital, Gangnam Healthcare Center (SNUH-HCS), and Bundang Hospital’s Health Promotion Center (SNUBH-HPC), for a comprehensive health evaluation (including CAC) between October 2003 and December 2008. Some subjects voluntarily paid for a general health check, and others were supported by their employer. This screening program included a calcium-scoring computed tomography (CT) with or without an abdominal fat CT as well as hepatic ultrasonography on the same day.
Out of the 5,648 subjects, we excluded 419 subjects who had a history of heart attack, coronary artery disease including acute myocardial infarction, angina, or congestive heart failure. We also excluded 1,206 subjects with at least one potential cause of chronic liver disease: 701 subjects with excessive alcohol consumption (≥ 20 g/day), 241 with positive hepatitis B surface antigen, 54 with positive hepatitis C antibody, and 42 with other history of hepatitis or liver disease (e.g., hemochromatosis, primary biliary cirrhosis, autoimmune hepatitis, Wilson’s disease etc). In addition, we excluded 168 subjects who had taken medications with known hepatotoxicity, such as estrogens, tamoxifen, glucosteroids, amiodarone, methotrexate, diltiazem, and valproate during the previous year. Altogether, 4,023 subjects were enrolled in the study, and 1,854 out of whom had a CT measurement of their abdominal fat.
The study protocol conformed to the ethical guidelines of the 1975 Declaration of Helsinki and was approved by the Institutional Review Board of Seoul National University Hospital.
Clinical and Laboratory Evaluations
In addition to a laboratory examination, each subject underwent a questionnaire assessment, and an anthropometric assessment. Systolic and diastolic blood pressures were measured twice on the same day, and the mean of the two values was used in the analysis. Height and body weight were measured using a digital scale. Body mass index was calculated with the following formula: body mass index = weight (kg)/height squared (m2). The waist circumference was measured (using a tape measure to the nearest millimeter) at the midpoint between the lower costal margin and the iliac crest by a well-trained nurse. Current smokers were defined as those who had smoked at least one cigarette per day during the previous year. Physical activity was measured by self report using the questionnaire and addressed ‘times (hours) of exercise per week’. Laboratory evaluations included aspartate aminotransferase (AST), alanine aminotransferase (ALT), gamma-glutamyl transpeptidase (GGT), total serum cholesterol, serum triglycerides (TG), serum high-density lipoprotein (HDL) cholesterol, fasting glucose, serum creatinine, C-reactive protein, hepatitis B surface antigen, and an antibody to hepatitis C virus. Venous blood samples were taken from all subjects before 10 AM after a 12-h overnight fast. All laboratory determinations were carried out using standard laboratory methods.
We have calculated estimated glomerular filtration rate according to the Modification of Diet in Renal Disease (MDRD) equation as following: glomerular filtration rate (mL/min/1.73 m2) = 186 × serum creatinine−1.154 × age−0.203 × 0.742 (if female) × 1.210 (if African American).(21) Systolic blood pressure ≥140 mmHg or diastolic blood pressure ≥90 mmHg and/or previous use of antihypertensive medication were used to define hypertension. Subjects with fasting plasma glucose levels ≥126 mg/dl and/or treatment with a hypoglycemic agent or insulin were defined as having diabetes mellitus. We divided participants with ultrasonography diagnosed NAFLD depending on the status of ALT (elevated ALT was defined as ALT > 30 U/L for men and > 19 U/L for women).(22)
Ultrasonographic Examinations
Hepatic ultrasonographies were examined by experienced radiologists who were blinded to the laboratory and clinical details of the subjects at the time of the procedure. Hepatic ultrasonography (Acuson, Sequoia 512, Siemens, Mountain View, CA) was used to diagnose fatty liver. The diagnosis of fatty liver was made on the basis of characteristic ultrasonographic features consistent with “bright liver” and evident contrast between hepatic and renal parenchyma, vessel blurring, focal sparing, and narrowing of the lumen of the hepatic veins.(23-25)
Measurement of CAC by Multi-Detector CT
A CT scan of the coronary artery was performed using a 16-slice multi-detector CT system (Somatom Sensation 16; Siemens Medical Solutions, Forchheim, Germany) at SNUH-HCS and a 64-channel multi-detector CT system (Brilliance 64; Philips Medical Systems, Best, Netherlands) at SNUBH-HPC. CAC scans were acquired using the standard procedure of prospective ECG-triggered scan acquisition with a tube voltage of 120 kV and 110 effective mAs with a 200-mm field of view.(26) The data were reconstructed to a 3-mm-thick slice with a 400-ms acquisition window. The CAC score was calculated using a CT software program (Rapidia 2.8; INFINITT, Seoul, Korea) with the Agatston method.(27)
Measurement of Abdominal Adipose Tissue Areas
We used a previously described method for VAT area measurement in cross-sectional CT images.(28) Briefly, the subjects were examined with a 16-detector row CT scanner (Somatom Sensation 16; Siemens Medical Solutions, Forchheim, Germany) in the supine position. The area was measured with commercially available CT software (Rapidia 2.8; INFINITT, Seoul, Korea), which electronically determined the adipose tissue area by setting the attenuation values for a region of interest within a range of −250 to −50 Housefield units.
Statistical Analysis
The outcome variable was the CAC score in this study. We used chi-squared tests for categorical variables and Student’s t-test or the Mann-Whitney test and ANOVA or Kruskal-Walis test for continuous variables. Because a large proportion of the subjects had a CAC score of zero, CAC scores were dichotomized as presence of CAC (score >0) vs. absence, ≥10 vs. <10, and ≥100 vs. <100 for binary logistic regression analysis. We also separated CAC into four categories: 0, 1 to 10, 11 to 100, ≥100 for use in ordinal logistic regression analysis to determine if NAFLD was associated with increased CAC scores. The logistic regression analysis was used to analyze the association between NAFLD and CAC while controlling for potential confounders. Covariates in the multivariable model, chosen for clinical importance as well as statistical significance included age, sex, body mass index, waist circumference, daily alcohol consumption, smoking status, physical activity, diabetes, hypertension, total cholesterol, TG, HDL cholesterol, and C-reactive protein. To investigate the associations between NAFLD and subclinical coronary atherosclerosis, the primary analysis included the entire cohort, and a secondary analysis focused on the individuals with VAT data. Analyses were conducted using SPSS 12.0 (SPSS, Inc., Chicago, IL, USA), and SAS 9.2 (SAS institute, Cary, NC, USA).
Results
There were a total of 4,023 subjects that met the inclusion criteria for the study. The majority of the subjects had no demonstrable calcification in the coronary arteries (CACS=0, n=2,737), whereas the remaining 1,286 had evidence of coronary calcification (presence of CAC), and the largest group of which were those with CACS between 10 and 100. The characteristics of the study subjects are shown in Table 1. The majority of the overall group comparisons were statistically significantly different. Some of the more noticeable differences were seen in the mean age, gender, and the prevalence of diabetes and hypertension, as well as body mass index, waist circumference, and serum levels of AST, GGT, and fasting glucose.
Table 1.
Comparison of Baseline Characteristics Between Coronary Artery Calcification Score Cut-off.
| CACS=0 (n=2,737) |
0-10 (n=251) |
≥10-100 (n=601) |
≥100 (n=434) |
P-value | |
|---|---|---|---|---|---|
| Age (years) | 54.5 ± 9.0 | 59.2 ± 8.1 | 60.9 ± 7.8 | 64.7 ± 8.2 | <0.001 |
| Male (%) | 1,465 (53.5) | 161 (64.1) | 461 (76.7) | 355 (81.8) | <0.001 |
| Smoking (%) | 507 (18.5) | 59 (23.5) | 154 (25.6) | 106 (24.4) | <0.001 |
| Diabetes mellitus (%) |
265 (9.7) | 28 (11.2) | 122 (20.3) | 103 (23.7) | <0.001 |
| Diabetes medication (%) |
200 (7.3) | 22 (8.8) | 94 (15.6) | 80 (18.4) | <0.001 |
| Hypertension (%) | 775 (28.3) | 114 (45.4) | 279 (46.4) | 262 (60.4) | <0.001 |
| Systolic blood pressure |
117.8 ± 15.6 |
123.2 ± 15.9 |
123.4 ± 16.3 |
126.0 ± 17.4 |
<0.001 |
| Diastolic blood pressure |
76.3 ± 11.8 | 79.7 ± 11.4 | 79.2 ± 11.5 | 79.6 ± 11.7 | <0.001 |
| Hypertension medication (%) |
530 (19.4) | 83 (33.1) | 223 (37.1) | 214 (49.3) | <0.001 |
| Lipid-lowering medication (%) |
249 (9.1) | 30 (12.0) | 69 (11.5) | 62 (14.3) | 0.004 |
| Body mass index (kg/m2) |
23.80 ± 2.83 |
24.40 ± 2.60 |
24.49 ± 2.61 |
24.61 ± 2.82 |
<0.001 |
| Waist circumference (cm) |
85.31 ± 8.05 |
87.60 ± 7.13 |
88.07 ± 7.26 |
88.97 ± 7.88 |
<0.001 |
| AST (IU/L) | 23.0 (20.0- 28.0) |
24.0 (20.0- 29.0) |
25.0 (20.0- 29.0) |
25.0 (21.0- 31.0) |
<0.001 |
| ALT (IU/L) | 23.0 (17.0- 33.0) |
24.0 (17.0- 37.0) |
26.0 (19.0- 34.0) |
25.5 (18.0- 36.0) |
<0.001 |
| GGT (IU/L) | 23.0 (16.0- 37.0) |
25.0 (16.0- 38.0) |
28.0 (19.0- 44.0) |
29.0 (20.0- 44.0) |
<0.001 |
| Cholesterol (mg/dL) |
202.0 ± 33.2 |
200.7 ± 34.8 |
202.5 ± 34.0 |
198.1 ± 37.4 |
0.146 |
| Triglycerides (mg/dL) |
98.0 (70.3- 141.0) |
112.0 (78.0- 170.0) |
108.0 (78.0- 158.0) |
114.0 (81.0- 156.0) |
<0.001 |
| HDL cholesterol (mg/dL) |
56.3 ± 14.3 | 52.4 ± 14.1 | 51.3 ± 12.5 | 52.3 ± 13.3 | <0.001 |
| Fasting glucose (mg/dL) |
98.1 ± 18.7 | 101.9 ± 19.6 |
105.9 ± 25.9 |
110.6 ± 30.2 |
<0.001 |
| C-reactive protein (mg/L) |
0.01 (0.01- 0.15) |
0.04 (0.01- 0.18) |
0.05 (0.01- 0.16) |
0.05 (0.01- 0.15) |
<0.001 |
| Creatinine (mg/dL) | 1.00 (0.90- 1.20) |
1.10 (0.90- 1.20) |
1.10 (1.00- 1.20) |
1.10 (1.00- 1.20) |
<0.001 |
| Glomerular filtration rate (mL/min/1.73m2) |
71.0 ± 10.1 | 69.3 ± 10.6 | 69.0 ± 11.2 | 68.4 ± 12.0 | <0.001 |
| Physical activity (hr/wk) |
2.55 ± 2.85 | 2.86 ± 2.75 | 2.70 ± 2.86 | 2.92 ± 3.18 | 0.033 |
| Daily alcohol consumption (gram) |
3.64 ± 5.82 | 3.81 ± 6.14 | 4.78 ± 6.79 | 5.54 ± 7.10 | <0.001 |
| NAFLD (%) | 968 (35.4) | 119 (47.4) | 305 (50.7) | 225 (51.8) | <0.001 |
CACS, coronary artery calcification score; AST, aspartate aminotransferase; ALT, alanine aminotransferase; GGT, gamma-glutamyl transferase; HDL, high-density lipoprotein; NAFLD, nonalcoholic fatty liver disease;.
Data are shown as the mean ± SD or median (IQR).
Of the study subjects, 1,617 had ultrasonographically-diagnosed NAFLD (40.2%). Table 2 compares individuals with and without NAFLD. The two groups were statistically significantly different in majority of the variables evaluated. The differences are in the expect direction that clinical features associated with insulin resistance is more prevalent in subjects with NAFLD.
Table 2.
Comparison of Baseline Characteristics between Subjects With and Without NAFLD.
| NAFLD (n=1,617) | Control (n=2,406) | P-value | |
|---|---|---|---|
| Age (years) | 57.5 ± 9.0 | 56.4 ± 9.6 | <0.001 |
| Male (%) | 1,180 (73.0) | 1,262 (52.5) | <0.001 |
| Smoking (%) | 380 (23.5) | 446 (18.5) | <0.001 |
| Diabetes mellitus (%) | 276 (17.1) | 242 (10.1) | <0.001 |
| Diabetes medication (%) | 198 (12.2) | 198 (8.2) | <0.001 |
| Hypertension (%) | 706 (43.7) | 724 (30.1) | <0.001 |
| Systolic blood pressure (mmHg) | 122.7 ± 15.5 | 118.0 ± 16.4 | <0.001 |
| Diastolic blood pressure (mmHg) | 79.8 ± 11.5 | 75.6 ± 11.7 | <0.001 |
| Hypertension medication (%) | 531 (32.8) | 519 (21.6) | <0.001 |
| Lipid-lowering medication (%) | 179 (11.1) | 231 (9.6) | 0.131 |
| Body mass index (kg/m2) | 25.09 ± 2.70 | 23.31 ± 2.64 | <0.001 |
| Waist circumference (cm) | 89.23 ± 7.43 | 84.26 ± 7.73 | <0.001 |
| AST (IU/L) | 27.0 (23.0-34.0) | 22.0 (19.0-26.0) | <0.001 |
| ALT (IU/L) | 33.0 (27.0-43.0) | 19.0 (15.8-24.0) | <0.001 |
| GGT (IU/L) | 33.0 (23.0-50.0) | 20.0 (15.0-30.0) | <0.001 |
| Cholesterol (mg/dL) | 203.9 ± 35.4 | 200.0 ± 32.8 | <0.001 |
| Triglycerides (mg/dL) | 122.0 (86.0-175.0) | 91.0 (67.0-128.0) | <0.001 |
| HDL cholesterol (mg/dL) | 51.1 ± 13.0 | 57.3 ± 14.3 | <0.001 |
| Fasting glucose (mg/dL) | 105.6 ± 24.7 | 97.6 ± 19.1 | <0.001 |
| C-reactive protein (mg/L) | 0.08 (0.01-0.18) | 0.01 (0.01-0.13) | <0.001 |
| Creatinine (mg/dL) | 1.10 (1.00-1.20) | 1.00 (0.90-1.20) | <0.001 |
| Glomerular filtration rate (mL/min/1.73m2) |
70.2 ± 10.3 | 70.4 ± 10.7 | 0.595 |
| Physical activity (hr/wk) | 2.69 ± 2.93 | 2.60 ± 2.90 | 0.359 |
| Daily alcohol consumption (gram) |
4.81 ± 6.76 | 3.49 ± 5.69 | <0.001 |
| CAC score | 71.88 ± 266.10 | 43.32 ± 198.90 | <0.001 |
NAFLD, nonalcoholic fatty liver disease; AST, aspartate aminotransferase; ALT, alanine aminotransferase; GGT, gamma-glutamyl transferase; HDL, high-density lipoprotein; CAC, coronary artery calcification.
Data are shown as the mean ± SD or median (IQR).
Figure 1 illustrates the relation between CACS score and NAFLD - the proportion of patients with NAFLD progressively increased from 35% in subjects with CACS=0 to 52% in those with CACS ≥100. A formal analysis for the relation between NAFLD and CAC score is shown in Table 3. In univariate analysis, NAFLD was associated with 86% increase in the risk of coronary calcification (presence of CAC versus absence of CAC). The odds ratio (OR) for NAFLD associated with one step increase was similar between severity categories, including that from the ordinal logistic regression analysis (OR 1.84, 95% confidence interval [CI] 1.61-2.10). As expected, this effect of NAFLD became attenuated in multivariable analyses, when other well established risk factors of coronary artery disease were taken into account. In those models, NAFLD remained statistically and clinically significant. The effect size of NAFLD was similar to that of diabetes (OR 1.39, 95% CI 1.13-1.72), reduced plasma concentrations of HDL-cholesterol (OR 1.26, 95% CI 1.05-2.10), and smoking (OR 1.42, 95% CI 1.18-1.72) (Supplementary Table 1).
Fig. 1.
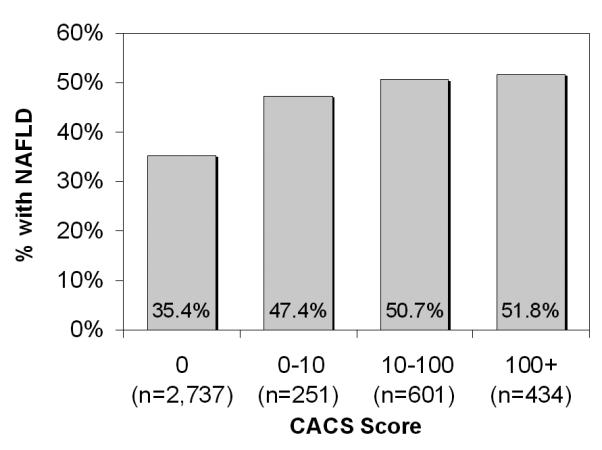
Prevalence of nonalcoholic fatty liver disease by coronary artery calcification score cutoff.
Table 3.
Univariate and Multivariable Binary and Ordinal Analyses of the Risk for Coronary Artery Calcification in subjects with versus without NAFLD
| CAC Score | Univariate analysis |
Multivariable model 1 |
Multivariable model 2 |
|||
|---|---|---|---|---|---|---|
| OR (95% CI) |
P- value |
OR (95% CI) |
P- value |
OR (95% CI) |
P- value |
|
| 0 (reference) >0 |
1.86 (1.63-2.13) | <0.001 | 1.35 (1.15-1.59) | <0.001 | 1.34 (1.14-1.58) | <0.001 |
| <10 (reference) ≥10 |
1.84 (1.59-2.12) | <0.001 | 1.33 (1.12-1.58) | 0.001 | 1.32 (1.12-1.57) | 0.001 |
| <100 (reference) ≥100 |
1.70 (1.39-2.08) | <0.001 | 1.26 (1.002-1.59) | 0.048 | 1.25 (0.99-1.57) | 0.065 |
| 0 0-10 ≥10-100 ≥100 |
1.84 (1.61-2.10) | <0.001 | 1.34 (1.15-1.56) | <0.001 | 1.33 (1.14-1.54) | <0.001 |
NAFLD, nonalcoholic fatty liver disease; CAC, coronary artery calcification; OR, odds ratio; CI, confidence interval.
The multivariable model 1 was adjusted for age, sex, body mass index, waist circumference, daily alcohol consumption, smoking status, physical activity, diabetes, hypertension, total cholesterol, triglycerides, and high-density lipoprotein (HDL) cholesterol.
The multivariable model 2 includes C-reative protein in addition to the variables addressed in model 1.
Figure 2 illustrates that NAFLD is more associated with presence of CAC in the group without known coronary risk factors (women, younger age, normal-overweight, non-hypertensive, non smoker, non-dyslipidemic, and non-diabetes) than in the groups with risk factors.
Fig. 2.
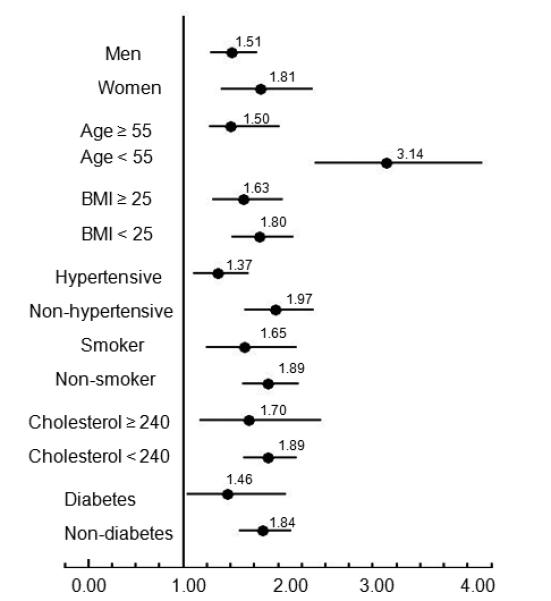
Forest plot shows the ORs of the association between NAFLD and presence of CAC in different subgroups of participants: men versus women, older (age ≥55 years) versus younger (age <55), obese (BMI ≥25) versus nonobese (BMI <25), hypertensive versus nonhypertensive, smokers versus nonsmokers, dyslipidemic (total cholesterol ≥240) versus nondyslipidemic (total cholesterol <240). ORs are represented by black circles; 95% CIs are denoted by horizontal whiskers.
NAFLD with elevated ALT were found to have higher risk of CAC than NAFLD with normal ALT by the trend test in age, sex adjusted model. In multivariable analysis, these associations were attenuated, but remained statistically and clinically significant with a P value for the test of trend of odds (Table 4).
Table 4.
Age, Sex-adjusted and Multivariable Analyses of the Risk for Coronary Artery Calcification in NAFLD with or without Elevated ALT versus Control.
| CAC Score | Age, sex-adjusted analysis | Multivariable analysis | ||
|---|---|---|---|---|
| OR (95% CI) | P-value | OR (95% CI) | P-value | |
| 0, >0 Control |
1 | <0.001* | 1 | 0.001* |
| NAFLD with Normal ALT | 1.47 (1.17-1.84) | 0.001 | 1.32 (1.05-1.67) | 0.019 |
| NAFLD with Elevated ALT | 1.65 (1.38-1.97) | <0.001 | 1.37 (1.13-1.67) | 0.001 |
| <10, ≥10 Control |
1 | <0.001* | 1 | 0.002* |
| NAFLD with Normal ALT | 1.39 (1.10-1.76) | 0.006 | 1.26 (0.99-1.61) | 0.060 |
| NAFLD with Elevated ALT | 1.62 (1.34-1.95) | <0.001 | 1.37 (1.12-1.68) | 0.003 |
| <100, ≥100 Control |
1 | 0.001* | 1 | 0.056* |
| NAFLD with Normal ALT | 1.20 (0.88-1.64) | 0.255 | 1.09 (0.78-1.50) | 0.621 |
| NAFLD with Elevated ALT | 1.53 (1.19-1.96) | 0.001 | 1.31 (1.00-1.71) | 0.054 |
| 0, >0-10, ≥10-100, ≥100 Control |
1 | <0.001* | 1 | 0.001* |
| NAFLD with Normal ALT | 1.38 (1.12-1.70) | <0.001 | 1.24 (1.00-1.54) | 0.055 |
| NAFLD with Elevated ALT | 1.65 (1.40-1.95) | <0.001 | 1.39 (1.16-1.67) | <0.001 |
NAFLD, nonalcoholic fatty liver disease; ALT, alanine aminotransferase; CAC, coronary artery calcification; OR, odds ratio; CI, confidence interval.
P-value for test of trend of odds
The multivariable model was adjusted for age, sex, body mass index, waist circumference, daily alcohol consumption, smoking status, physical activity, diabetes, hypertension, total cholesterol, triglycerides, and high-density lipoprotein (HDL) cholesterol.
We next evaluated the role of visceral adiposity assessment in the association between CAC and NAFLD. Abdominal fat CT data were available in 1,854 subjects (46.1%). Supplementary Table 2 compares individuals with and without VAT data. Those with the data were older (mean 59 years versus 55 years) and had a larger waist circumference (mean 87 versus 86 cm) and higher prevalence of hypertension (39% versus 33%) than those without. There were minor differences in other characteristics between the two groups although some of them reached statistical significance because of the large sample size.
Of the 1,854 subjects with VAT data, 770 had NAFLD (Supplementary Table 3). Compared to those without NAFLD, NAFLD patients had a significantly larger area of total abdominal adiposity (difference in means=50.4 cm2), which was mainly attributable to differences in VAT (38.5 cm2) rather than subcutaneous adiposity (11.8 cm2). Figure 3 illustrates that VAT, not subcutaneous adiposity, is correlated with the CAC score. Finally, Table 5 repeats the multivariable analysis correlating CAC with predictors, including NAFLD, VAT, and other existing variables. Compared to subjects without NAFLD, subjects with NAFLD had a higher OR of increased CAC scores like entire cohort (OR 1.60, 95% CI 1.32-1.93). When NAFLD and VAT were jointly considered in the full multivariable models, the association between NAFLD and both the presence of CAC (OR 1.29, 95% CI 1.03-1.62) and the increased CAC scores of 0, 1 to 10, 10 to 100, ≥100 (OR 1.28, 95% CI 1.04-1.59) attenuated, but remained significant; however, NAFLD was not statistically significantly associated with CAC scores ≥100 (OR 1.30, 95% CI 0.94-1.80).
Fig. 3.


Visceral adipose tissue area and subcutaneous adipose tissue area between coronary artery calcification score cutoff. (A) As coronary artery calcification score increases, visceral adipose tissue area increases dose-dependently. (B) Associations between CAC score and subcutaneous adipose area were not statistically significant. The horizontal line in each box represents the median. The top and bottom of each box represent the 25th and 75th percentiles (interquartile range).
Table 5.
Multivariable Logistic Regression Analyses for Association Between Coronary Artery Calcification and NAFLD among subjects with VAT data.
| CAC Score | Model 1 | Model 2 | ||
|---|---|---|---|---|
| OR (95% CI) | P-value | OR (95% CI) | P-value | |
| 0 (reference) >0 |
1.32 (1.07-1.66) | 0.015 | 1.29 (1.03-1.62) | 0.027 |
| <10 (reference) ≥10 |
1.27 (1.001-1.61) | 0.049 | 1.25 (0.99-1.59) | 0.066 |
| <100 (reference) ≥100 |
1.30 (0.94-1.79) | 0.114 | 1.30 (0.94-1.80) | 0.116 |
| 0 0-10 ≥10-100 ≥100 |
1.30 (1.05-1.60) | 0.016 | 1.28 (1.04-1.59) | 0.023 |
NAFLD, nonalcoholic fatty liver disease; VAT, visceral adipose tissue area; CAC, coronary artery calcification; OR, odds ratio; CI, confidence interval.
Model 1 was adjusted for age, sex, smoking status, diabetes, hypertension, and visceral adipose tissue area.
Model 2 includes total cholesterol, triglycerides, and high-density lipoprotein (HDL) cholesterol in addition to the variables addressed in model 1.
Discussion
The main finding of this large population-based study was a strong relationship between NAFLD and CAC, the latter being an established surrogate marker for coronary atherosclerosis. Importantly, this association was independent of the traditional risk factors for coronary artery disease as well as visceral adiposity.
The association of NAFLD with CAC may be indirect and due to generalized obesity or ectopic fat, including VAT. However, CT measured visceral adiposity attenuated but did not eliminate the relationship between NAFLD and CAC. This study gave us the unique opportunity to assess the relationship between NAFLD and subclinical coronary atherosclerosis above and beyond VAT. An increasing number of studies have suggested that NAFLD is an independent risk factor for coronary artery disease and mortality.(3, 5, 6, 9) This hypothesis has been supported by community-, population-, and hospital-based studies.(29-31) Recent large prospective cohort study reported that in patients with clinical indications for coronary angiogram, NAFLD is associated with coronary artery disease independently of other metabolic factors.(32) However, most of the previous studies that have suggested an independent association between NAFLD and coronary artery disease did not directly measure abdominal VAT. Most of these studies indirectly measured VAT using waist circumference, which has been shown to be more closely correlated with subcutaneous adipose tissue than with VAT.(33) Because of this, multivariable analysis adjusted for waist circumference is not sufficient to demonstrate an independent relationship between NAFLD and coronary artery disease above and beyond VAT. Recent studies have reported that the VAT is the abdominal fat that is most intimately associated with metabolic disease, myocardial infarction, stroke, and overall mortality.(34-36) The cardiovascular risk in NAFLD may be attributed in part to underlying VAT.(37) Therefore, we examined the relative contributions of hepatic fat and VAT to subclinical coronary atherosclerosis. Multivariable regression analysis proved that the relationship between NAFLD and CAC score was significant, even after adjusting for age, sex, traditional coronary risk factors, and VAT. Therefore, we suggest that NAFLD per se might be an independent risk factor for subclinical coronary atherosclerosis. In addition, NAFLD together with elevated ALT, which might indicate suspected nonalcoholic steatohepatitis, was more associated with CAC than NAFLD with normal ALT in a dose-dependent manner. These findings suggest that CAC is associated with both nonalcoholic steatohepatitis and NAFLD.
Because the CAC score indicates the presence and extent of coronary atherosclerosis, it is not surprising that many studies have reported that a high CAC score is a marker for an increased risk of coronary events.(38) Thus, a CAC score of zero is associated with a very low risk of subsequent coronary events,(38, 39) whereas an elevated CAC score is related to a stepwise increase in the risk of subsequent coronary events.(11, 38) CAC scores have been shown to be highly predictive of future cardiovascular events independent of traditional risk factors.(11, 40, 41) Thus, in this study, we utilized the CAC score as an outcome variable to predict future coronary heart disease in individuals with NAFLD.
Currently, three published papers address the relationship between NAFLD and CAC. But, these results conflict with each other. As part of the Diabetes Heart Study, McKimmie et al.(42) suggested that hepatic steatosis is less likely to be a direct mediator of cardiovascular disease and may be described as an epiphenomenon. The preponderance of diabetes (82.8%) and the nature of the Diabetes Heart Study as a family study, however, may limit the generalizability of these results. On the contrary, Chen et al.(43) reported a significant relationship between NAFLD and CAC in Taiwan, but the possibility of selection bias was raised because of the exclusion of a large number of subjects without hepatic imaging. Jung et al.(44) also suggested that hepatic steatosis and increased ALT are associated with CAC. They used less stringent criteria to define ALT elevation for women and only single cutoff point of CAC (>100). Importantly, two studies did not include VAT data in multivariate analysis.
Although the pathogeneses that relate NAFLD and coronary artery disease have not been thoroughly investigated, several possible explanations have been offered. A low-grade systemic and hepatic inflammatory milieu may link NAFLD to atherosclerosis, which increases the risk of coronary artery disease.(45, 46) In NAFLD, reactive oxygen radicals may induce the production of cytokines, such as tumor necrosis factor-alpha and interleukin-6,(47) and add further atherogenic stimuli to the already high oxidative and pro-inflammatory status that is closely related to metabolic syndrome.(48, 49) In addition, such conditions favor the up-regulation of hepatic C-reactive protein levels, which may link NAFLD to coronary atherosclerosis.(45, 50) Furthermore, subjects with NAFLD have shown reduced serum adiponectin levels, which are inversely related to the severity of NAFLD histology.(3, 51) Low serum adiponectin levels may also play an important role in the pathogenesis between NAFLD and subclinical coronary atherosclerosis.
The strengths of our study are the utilization of CAC scores, CT-measured VAT, with a high degree of validity and reproducibility, high-quality data collected by trained personnel with a systematic protocol, wealth of metabolic variables, and a large number of subjects. In addition, we simultaneously measured CAC, hepatic ultrasonography, and VAT on the same day. Moreover, we believe that the subjects in our study are representatives of general population, given the nature of the screening program which is tailored for healthy, asymptomatic individuals. Finally, we utilized the CAC score as an outcome variable to predict future coronary artery disease in individuals with NAFLD. The suggested relationship between CAC score and coronary artery disease is rational because the CAC score reflects the actual presence and severity of atherosclerosis, whereas risk factors, risk scores, and biomarkers reflects only likelihood of coronary artery disease.(38)
Some limitations of our study merit comment. First, the cross-sectional design makes it difficult to determine causal or temporal relationships between NAFLD and the development of subclinical coronary atherosclerosis. Second, hepatic ultrasonography was used to diagnose NAFLD, and this technique cannot identify fatty infiltration below 30% (52) and have intra- and inter-obsever variability in making diagnosis. The advantages of ultrasonography, however, include its safety, low cost, repeatability, satisfied sensitivity, and specificity.(53) Based on these characteristics, ultrasonography is the first-line imaging technique for both clinical practice and epidemiological studies.(54) Third, VAT data was not available to all study subjects. Although they are likely representative of the whole study population, the anthropometric and laboratory data of subjects with VAT data may have differed in some way from subjects without VAT data. Fourth, we did not have data on fasting insulin and did not have information on insulin resistance for our cohort due to retrospective design. In addition, this study was conducted at health screening centers, which introduces the possibility of selection process.
In this largest study conducted to date, patients with NAFLD are at high risk for coronary atherosclerosis regardless of classical cardiovascular risk factors, especially visceral adiposity. Detection of NAFLD should signal the existence of an increased coronary artery disease risk independent of visceral adiposity.
Supplementary Material
Acknowledgments
Grant Support This work was supported by grant 04-2009-055 from the Seoul National University Hospital Research Fund. The funding organizations had no role in the design and conduct of the study, in the collection, management, analysis, and interpretation of the data, or in the preparation, review, or approval of the manuscript.
Lists of Abbreviations
- ALT
alanine aminotransferase
- AST
aspartate aminotransferase
- CAC
coronary artery calcification
- CI
confidence interval
- CT
computed tomography
- GGT
gamma-glutamyl transpeptidase
- HDL
high-density lipoprotein
- NAFLD
nonalcoholic fatty liver disease
- OR
odds ratio
- SAT
subcutaneous adipose tissue
- TAT
total adipose tissue
- TG
triglycerides
- VAT
visceral adipose tissue
Footnotes
Disclosures There are no conflicts of interest to disclosure.
References
- 1.Browning JD, Szczepaniak LS, Dobbins R, Nuremberg P, Horton JD, Cohen JC, Grundy SM, et al. Prevalence of hepatic steatosis in an urban population in the United States: impact of ethnicity. Hepatology. 2004;40:1387–1395. doi: 10.1002/hep.20466. [DOI] [PubMed] [Google Scholar]
- 2.Marchesini G, Brizi M, Bianchi G, Tomassetti S, Bugianesi E, Lenzi M, McCullough AJ, et al. Nonalcoholic fatty liver disease: a feature of the metabolic syndrome. Diabetes. 2001;50:1844–1850. doi: 10.2337/diabetes.50.8.1844. [DOI] [PubMed] [Google Scholar]
- 3.Targher G, Marra F, Marchesini G. Increased risk of cardiovascular disease in non-alcoholic fatty liver disease: causal effect or epiphenomenon? Diabetologia. 2008;51:1947–1953. doi: 10.1007/s00125-008-1135-4. [DOI] [PubMed] [Google Scholar]
- 4.Choi SY, Kim D, Kang JH, Park MJ, Kim YS, Lim SH, Kim CH, et al. Nonalcoholic fatty liver disease as a risk factor of cardiovascular disease: relation of non-alcoholic fatty liver disease to carotid atherosclerosis. Korean J Hepatol. 2008;14:77–88. doi: 10.3350/kjhep.2008.14.1.77. [DOI] [PubMed] [Google Scholar]
- 5.Brea A, Mosquera D, Martin E, Arizti A, Cordero JL, Ros E. Nonalcoholic fatty liver disease is associated with carotid atherosclerosis: a case-control study. Arterioscler Thromb Vasc Biol. 2005;25:1045–1050. doi: 10.1161/01.ATV.0000160613.57985.18. [DOI] [PubMed] [Google Scholar]
- 6.Targher G, Bertolini L, Padovani R, Rodella S, Zoppini G, Zenari L, Cigolini M, et al. Relations between carotid artery wall thickness and liver histology in subjects with nonalcoholic fatty liver disease. Diabetes Care. 2006;29:1325–1330. doi: 10.2337/dc06-0135. [DOI] [PubMed] [Google Scholar]
- 7.Choi SY, Kim D, Kim HJ, Kang JH, Chung SJ, Park MJ, Kim YS, et al. The relation between non-alcoholic fatty liver disease and the risk of coronary heart disease in Koreans. Am J Gastroenterol. 2009;104:1953–1960. doi: 10.1038/ajg.2009.238. [DOI] [PubMed] [Google Scholar]
- 8.Ioannou GN, Weiss NS, Boyko EJ, Mozaffarian D, Lee SP. Elevated serum alanine aminotransferase activity and calculated risk of coronary heart disease in the United States. Hepatology. 2006;43:1145–1151. doi: 10.1002/hep.21171. [DOI] [PubMed] [Google Scholar]
- 9.Villanova N, Moscatiello S, Ramilli S, Bugianesi E, Magalotti D, Vanni E, Zoli M, et al. Endothelial dysfunction and cardiovascular risk profile in nonalcoholic fatty liver disease. Hepatology. 2005;42:473–480. doi: 10.1002/hep.20781. [DOI] [PubMed] [Google Scholar]
- 10.Akabame S, Hamaguchi M, Tomiyasu K, Tanaka M, Kobayashi-Takenaka Y, Nakano K, Oda Y, et al. Evaluation of vulnerable coronary plaques and non-alcoholic fatty liver disease (NAFLD) by 64-detector multislice computed tomography (MSCT) Circ J. 2008;72:618–625. doi: 10.1253/circj.72.618. [DOI] [PubMed] [Google Scholar]
- 11.Greenland P, LaBree L, Azen SP, Doherty TM, Detrano RC. Coronary artery calcium score combined with Framingham score for risk prediction in asymptomatic individuals. JAMA. 2004;291:210–215. doi: 10.1001/jama.291.2.210. [DOI] [PubMed] [Google Scholar]
- 12.Pletcher MJ, Tice JA, Pignone M, Browner WS. Using the coronary artery calcium score to predict coronary heart disease events: a systematic review and meta-analysis. Arch Intern Med. 2004;164:1285–1292. doi: 10.1001/archinte.164.12.1285. [DOI] [PubMed] [Google Scholar]
- 13.Taylor AJ, Bindeman J, Feuerstein I, Cao F, Brazaitis M, O’Malley PG. Coronary calcium independently predicts incident premature coronary heart disease over measured cardiovascular risk factors: mean three-year outcomes in the Prospective Army Coronary Calcium (PACC) project. J Am Coll Cardiol. 2005;46:807–814. doi: 10.1016/j.jacc.2005.05.049. [DOI] [PubMed] [Google Scholar]
- 14.Yan LL, Liu K, Daviglus ML, Colangelo LA, Kiefe CI, Sidney S, Matthews KA, et al. Education, 15-year risk factor progression, and coronary artery calcium in young adulthood and early middle age: the Coronary Artery Risk Development in Young Adults study. JAMA. 2006;295:1793–1800. doi: 10.1001/jama.295.15.1793. [DOI] [PubMed] [Google Scholar]
- 15.Terry JG, Carr JJ, Tang R, Evans GW, Kouba EO, Shi R, Cook DR, et al. Coronary artery calcium outperforms carotid artery intima-media thickness as a noninvasive index of prevalent coronary artery stenosis. Arterioscler Thromb Vasc Biol. 2005;25:1723–1728. doi: 10.1161/01.ATV.0000173418.42264.19. [DOI] [PubMed] [Google Scholar]
- 16.Detrano R, Guerci AD, Carr JJ, Bild DE, Burke G, Folsom AR, Liu K, et al. Coronary calcium as a predictor of coronary events in four racial or ethnic groups. N Engl J Med. 2008;358:1336–1345. doi: 10.1056/NEJMoa072100. [DOI] [PubMed] [Google Scholar]
- 17.Greenland P, Bonow RO, Brundage BH, Budoff MJ, Eisenberg MJ, Grundy SM, Lauer MS, et al. ACCF/AHA 2007 clinical expert consensus document on coronary artery calcium scoring by computed tomography in global cardiovascular risk assessment and in evaluation of patients with chest pain: a report of the American College of Cardiology Foundation Clinical Expert Consensus Task Force (ACCF/AHA Writing Committee to Update the 2000 Expert Consensus Document on Electron Beam Computed Tomography) developed in collaboration with the Society of Atherosclerosis Imaging and Prevention and the Society of Cardiovascular Computed Tomography. J Am Coll Cardiol. 2007;49:378–402. doi: 10.1016/j.jacc.2006.10.001. [DOI] [PubMed] [Google Scholar]
- 18.Marchesini G, Bugianesi E, Forlani G, Cerrelli F, Lenzi M, Manini R, Natale S, et al. Nonalcoholic fatty liver, steatohepatitis, and the metabolic syndrome. Hepatology. 2003;37:917–923. doi: 10.1053/jhep.2003.50161. [DOI] [PubMed] [Google Scholar]
- 19.Kotronen A, Yki-Jarvinen H. Fatty liver: a novel component of the metabolic syndrome. Arterioscler Thromb Vasc Biol. 2008;28:27–38. doi: 10.1161/ATVBAHA.107.147538. [DOI] [PubMed] [Google Scholar]
- 20.Picardi A, Vespasiani-Gentilucci U. Association between non-alcoholic fatty liver disease and cardiovascular disease: a first message should pass. Am J Gastroenterol. 2008;103:3036–3038. doi: 10.1111/j.1572-0241.2008.02196.x. [DOI] [PubMed] [Google Scholar]
- 21.Levey AS, Bosch JP, Lewis JB, Greene T, Rogers N, Roth D. A more accurate method to estimate glomerular filtration rate from serum creatinine: a new prediction equation. Modification of Diet in Renal Disease Study Group. Annals of internal medicine. 1999;130:461–470. doi: 10.7326/0003-4819-130-6-199903160-00002. [DOI] [PubMed] [Google Scholar]
- 22.Prati D, Taioli E, Zanella A, Della Torre E, Butelli S, Del Vecchio E, Vianello L, et al. Updated definitions of healthy ranges for serum alanine aminotransferase levels. Annals of internal medicine. 2002;137:1–10. doi: 10.7326/0003-4819-137-1-200207020-00006. [DOI] [PubMed] [Google Scholar]
- 23.Angulo P. Nonalcoholic fatty liver disease. N Engl J Med. 2002;346:1221–1231. doi: 10.1056/NEJMra011775. [DOI] [PubMed] [Google Scholar]
- 24.Day CP. Non-alcoholic fatty liver disease: current concepts and management strategies. Clin Med. 2006;6:19–25. doi: 10.7861/clinmedicine.6-1-19. [DOI] [PMC free article] [PubMed] [Google Scholar]
- 25.Bellentani S, Saccoccio G, Masutti F, Croce LS, Brandi G, Sasso F, Cristanini G, et al. Prevalence of and risk factors for hepatic steatosis in Northern Italy. Ann Intern Med. 2000;132:112–117. doi: 10.7326/0003-4819-132-2-200001180-00004. [DOI] [PubMed] [Google Scholar]
- 26.Choi SY, Kim D, Oh BH, Kim M, Park HE, Lee CH, Cho SH. General and abdominal obesity and abdominal visceral fat accumulation associated with coronary artery calcification in Korean men. Atherosclerosis. 2010;213:273–278. doi: 10.1016/j.atherosclerosis.2010.07.052. [DOI] [PubMed] [Google Scholar]
- 27.Agatston AS, Janowitz WR, Hildner FJ, Zusmer NR, Viamonte M, Jr., Detrano R. Quantification of coronary artery calcium using ultrafast computed tomography. J Am Coll Cardiol. 1990;15:827–832. doi: 10.1016/0735-1097(90)90282-t. [DOI] [PubMed] [Google Scholar]
- 28.Chung SJ, Kim D, Park MJ, Kim YS, Kim JS, Jung HC, Song IS. Metabolic syndrome and visceral obesity as risk factors for reflux oesophagitis: a cross-sectional case-control study of 7078 Koreans undergoing health check-ups. Gut. 2008;57:1360–1365. doi: 10.1136/gut.2007.147090. [DOI] [PubMed] [Google Scholar]
- 29.Matteoni CA, Younossi ZM, Gramlich T, Boparai N, Liu YC, McCullough AJ. Nonalcoholic fatty liver disease: a spectrum of clinical and pathological severity. Gastroenterology. 1999;116:1413–1419. doi: 10.1016/s0016-5085(99)70506-8. [DOI] [PubMed] [Google Scholar]
- 30.Adams LA, Lymp JF, St Sauver J, Sanderson SO, Lindor KD, Feldstein A, Angulo P. The natural history of nonalcoholic fatty liver disease: a population-based cohort study. Gastroenterology. 2005;129:113–121. doi: 10.1053/j.gastro.2005.04.014. [DOI] [PubMed] [Google Scholar]
- 31.Dunn W, Xu R, Wingard DL, Rogers C, Angulo P, Younossi ZM, Schwimmer JB. Suspected nonalcoholic fatty liver disease and mortality risk in a population-based cohort study. Am J Gastroenterol. 2008;103:2263–2271. doi: 10.1111/j.1572-0241.2008.02034.x. [DOI] [PMC free article] [PubMed] [Google Scholar]
- 32.Wong VW, Wong GL, Yip GW, Lo AO, Limquiaco J, Chu WC, Chim AM, et al. Coronary artery disease and cardiovascular outcomes in patients with non-alcoholic fatty liver disease. Gut. 2011;60:1721–1727. doi: 10.1136/gut.2011.242016. [DOI] [PubMed] [Google Scholar]
- 33.Yim JY, Kim D, Lim SH, Park MJ, Choi SH, Lee CH, Kim SS, et al. Sagittal abdominal diameter is a strong anthropometric measure of visceral adipose tissue in the Asian general population. Diabetes Care. 2010;33:2665–2670. doi: 10.2337/dc10-0606. [DOI] [PMC free article] [PubMed] [Google Scholar]
- 34.Kuk JL, Katzmarzyk PT, Nichaman MZ, Church TS, Blair SN, Ross R. Visceral fat is an independent predictor of all-cause mortality in men. Obesity (Silver Spring) 2006;14:336–341. doi: 10.1038/oby.2006.43. [DOI] [PubMed] [Google Scholar]
- 35.Despres JP, Lemieux I. Abdominal obesity and metabolic syndrome. Nature. 2006;444:881–887. doi: 10.1038/nature05488. [DOI] [PubMed] [Google Scholar]
- 36.Rexrode KM, Carey VJ, Hennekens CH, Walters EE, Colditz GA, Stampfer MJ, Willett WC, et al. Abdominal adiposity and coronary heart disease in women. JAMA. 1998;280:1843–1848. doi: 10.1001/jama.280.21.1843. [DOI] [PubMed] [Google Scholar]
- 37.van der Poorten D, Milner KL, Hui J, Hodge A, Trenell MI, Kench JG, London R, et al. Visceral fat: a key mediator of steatohepatitis in metabolic liver disease. Hepatology. 2008;48:449–457. doi: 10.1002/hep.22350. [DOI] [PubMed] [Google Scholar]
- 38.Bonow RO. Clinical practice. Should coronary calcium screening be used in cardiovascular prevention strategies? N Engl J Med. 2009;361:990–997. doi: 10.1056/NEJMcp0902177. [DOI] [PubMed] [Google Scholar]
- 39.Greenland P, Bonow RO. How low-risk is a coronary calcium score of zero? The importance of conditional probability. Circulation. 2008;117:1627–1629. doi: 10.1161/CIRCULATIONAHA.108.767665. [DOI] [PubMed] [Google Scholar]
- 40.Budoff MJ, Achenbach S, Blumenthal RS, Carr JJ, Goldin JG, Greenland P, Guerci AD, et al. Assessment of coronary artery disease by cardiac computed tomography: a scientific statement from the American Heart Association Committee on Cardiovascular Imaging and Intervention, Council on Cardiovascular Radiology and Intervention, and Committee on Cardiac Imaging, Council on Clinical Cardiology. Circulation. 2006;114:1761–1791. doi: 10.1161/CIRCULATIONAHA.106.178458. [DOI] [PubMed] [Google Scholar]
- 41.Manson JE, Allison MA, Rossouw JE, Carr JJ, Langer RD, Hsia J, Kuller LH, et al. Estrogen therapy and coronary-artery calcification. N Engl J Med. 2007;356:2591–2602. doi: 10.1056/NEJMoa071513. [DOI] [PubMed] [Google Scholar]
- 42.McKimmie RL, Daniel KR, Carr JJ, Bowden DW, Freedman BI, Register TC, Hsu FC, et al. Hepatic steatosis and subclinical cardiovascular disease in a cohort enriched for type 2 diabetes: the Diabetes Heart Study. Am J Gastroenterol. 2008;103:3029–3035. doi: 10.1111/j.1572-0241.2008.02188.x. [DOI] [PMC free article] [PubMed] [Google Scholar]
- 43.Chen CH, Nien CK, Yang CC, Yeh YH. Association between nonalcoholic fatty liver disease and coronary artery calcification. Dig Dis Sci. 2010;55:1752–1760. doi: 10.1007/s10620-009-0935-9. [DOI] [PubMed] [Google Scholar]
- 44.Jung DH, Lee YJ, Ahn HY, Shim JY, Lee HR. Relationship of hepatic steatosis and alanine aminotransferase with coronary calcification. Clinical chemistry and laboratory medicine : CCLM / FESCC. 2010;48:1829–1834. doi: 10.1515/CCLM.2010.349. [DOI] [PubMed] [Google Scholar]
- 45.Schindhelm RK, Dekker JM, Nijpels G, Bouter LM, Stehouwer CD, Heine RJ, Diamant M. Alanine aminotransferase predicts coronary heart disease events: a 10-year follow-up of the Hoorn Study. Atherosclerosis. 2007;191:391–396. doi: 10.1016/j.atherosclerosis.2006.04.006. [DOI] [PubMed] [Google Scholar]
- 46.Targher G, Bertolini L, Poli F, Rodella S, Scala L, Tessari R, Zenari L, et al. Nonalcoholic fatty liver disease and risk of future cardiovascular events among type 2 diabetic patients. Diabetes. 2005;54:3541–3546. doi: 10.2337/diabetes.54.12.3541. [DOI] [PubMed] [Google Scholar]
- 47.Kern PA, Ranganathan S, Li C, Wood L, Ranganathan G. Adipose tissue tumor necrosis factor and interleukin-6 expression in human obesity and insulin resistance. Am J Physiol Endocrinol Metab. 2001;280:E745–751. doi: 10.1152/ajpendo.2001.280.5.E745. [DOI] [PubMed] [Google Scholar]
- 48.Targher G, Arcaro G. Non-alcoholic fatty liver disease and increased risk of cardiovascular disease. Atherosclerosis. 2007;191:235–240. doi: 10.1016/j.atherosclerosis.2006.08.021. [DOI] [PubMed] [Google Scholar]
- 49.Eckel RH, Grundy SM, Zimmet PZ. The metabolic syndrome. Lancet. 2005;365:1415–1428. doi: 10.1016/S0140-6736(05)66378-7. [DOI] [PubMed] [Google Scholar]
- 50.Ridker PM, Hennekens CH, Buring JE, Rifai N. C-reactive protein and other markers of inflammation in the prediction of cardiovascular disease in women. N Engl J Med. 2000;342:836–843. doi: 10.1056/NEJM200003233421202. [DOI] [PubMed] [Google Scholar]
- 51.Hui JM, Hodge A, Farrell GC, Kench JG, Kriketos A, George J. Beyond insulin resistance in NASH: TNF-alpha or adiponectin? Hepatology. 2004;40:46–54. doi: 10.1002/hep.20280. [DOI] [PubMed] [Google Scholar]
- 52.Sanyal AJ. AGA technical review on nonalcoholic fatty liver disease. Gastroenterology. 2002;123:1705–1725. doi: 10.1053/gast.2002.36572. [DOI] [PubMed] [Google Scholar]
- 53.Saadeh S, Younossi ZM, Remer EM, Gramlich T, Ong JP, Hurley M, Mullen KD, et al. The utility of radiological imaging in nonalcoholic fatty liver disease. Gastroenterology. 2002;123:745–750. doi: 10.1053/gast.2002.35354. [DOI] [PubMed] [Google Scholar]
- 54.Loria P, Adinolfi LE, Bellentani S, Bugianesi E, Grieco A, Fargion S, Gasbarrini A, et al. Practice guidelines for the diagnosis and management of nonalcoholic fatty liver disease. A decalogue from the Italian Association for the Study of the Liver (AISF) Expert Committee. Dig Liver Dis. 2010;42:272–282. doi: 10.1016/j.dld.2010.01.021. [DOI] [PubMed] [Google Scholar]
Associated Data
This section collects any data citations, data availability statements, or supplementary materials included in this article.