

Abstract
Research has shown a developmental process of “maturing out” of alcohol involvement beginning in young adulthood, but the precise nature of changes characterizing maturing out is unclear. We used latent transition analysis to investigate these changes in a high-risk sample from a longitudinal study of familial alcoholism (N=844; 51% children of alcoholics; 53% male, 71% non-Hispanic Caucasian, 27% Hispanic). Analyses classified participants into latent drinking statuses during late adolescence (ages 17–22), young adulthood (ages 23–28), and adulthood (ages 29–40), and characterized transitions among these statuses over time. The resulting four statuses were abstainers, low-risk drinkers who typically drank less than weekly and rarely binged or showed drinking problems, moderate-risk drinkers who typically binged less than weekly and showed moderate risk for drinking problems, and high-risk drinkers who typically binged at least weekly and showed high risk for drinking problems. Maturing out between late adolescence and young adulthood was most common among initial high-risk drinkers, but they typically declined to moderate-risk drinking rather than to non-risky drinking statuses. This suggests that the developmental phenomenon of maturing out pertains primarily to relatively high-risk initial drinkers, and that many high-risk drinkers who “mature out” merely reduce rather than eliminate their risky drinking.
Keywords: Maturing out, drinking, familial alcoholism
Young adult alcohol involvement is a concern given risk for associated short-term consequences (e.g., injury, risky sexual behavior, interpersonal conflict; Wechsler, Lee, Kuo, & Lee, 2000) and long-term risk for the development of alcohol use disorders (AUDs; O’Neill, Parra, & Sher, 2001). Multiple streams of evidence suggest that alcohol involvement should be considered within a developmental context (Masten, Faden, Zucker, & Spear, 2008; Sher & Gotham, 1999), including clear evidence of age-related changes in alcohol involvement. The current study aimed to characterize the developmental phenomenon of “maturing out”, which refers to age-related declines in alcohol involvement that begin in young adulthood. This objective is important given potential for gaining insights into the etiological processes that drive maturing out and the practical implications of these declines.
A great deal of research has focused on characterizing the developmental phenomenon of maturing out. Some of this work has focused on demonstrating age-related changes in average rates of alcohol involvement from adolescence to adulthood. For indices ranging from alcohol use to AUD symptomatology, studies have shown that alcohol involvement increases during adolescence, peaks around ages 20 to 22, and then steadily declines thereafter (e.g., Chen & Kandel, 1995; Harford, Grant, Yi, & Chen, 2005; Johnston, O’Malley, Bachman, & Schulenberg, 2007a; Johnston, O’Malley, Bachman, & Schulenberg, 2007b). Moving beyond average changes, other studies have addressed heterogeneity by identifying subgroups with different patterns of age-related changes (e.g., Caswell, Pledger, & Pratap, 2002; Jackson & Sher, 2005). These studies commonly identify a subgroup that follows the prototypic maturing out pattern described above, but they also commonly identify a “chronic” subgroup that persists at high levels of alcohol involvement beyond young adulthood and two low-risk groups that persist as light drinkers and abstainers, respectively.
Regarding differences across indices of alcohol involvement, previous research on maturing out suggests that age-related declines are steeper for indicators of excessive or problematic alcohol use (e.g., binge drinking, AUD diagnoses) than for less extreme indicators (e.g., drinking frequency, drinking quantity; Caswell et al., 2002; Jackson & Sher, 2005; Johnston et al., 2007b; see also Figures 3, 4 and 5 in Masten et al., 2008). This suggests that maturing out may primarily reflect declines in problematic drinking rather than declines in drinking per se. Importantly, this also suggests that maturing out may primarily occur among the types of drinkers who display relatively problematic initial patterns of drinking (e.g., frequent binge drinkers, those with AUD symptoms). However, this hypothesis has never been directly tested.
The fact that previous research on maturing out has yet to directly address this question relates to the fact that different drinking-related indices (e.g., drinking frequency, binge drinking, drinking consequences) have typically been studied in separate models, thus requiring a conceptual synthesis of findings across different studies or different analyses in order to infer which types of drinkers are most likely to mature out. However, although this question has not been directly tested, it is important. If maturing out primarily affects relatively high-risk initial drinkers (as suggested above), this could provide insight into the etiological processes that drive maturing out and would perhaps suggest that maturing out should be viewed as a sub-group-specific process rather than a general developmental phenomenon. Further, this would suggest that an understanding of the causes of maturing out may be useful for tailoring clinical interventions to young adult problem drinkers, whereas maturing out would likely have less clinical relevance if declines occurred primarily among individuals who were already low-risk drinkers. Thus, the first question addressed by the current study was whether maturing out occurs primarily among initial high-risk drinkers.
Again related to the fact that previous research has typically studied different drinking-related indices in separate models, previous research is also limited in the extent to which it had identified the types of drinking patterns that are commonly adopted among individuals who have matured out. Those who mature out may subsequently abstain, or they may continue to drink but at more moderate levels, or they may continue to drink at high levels but with fewer drinking-related problems (e.g., fewer AUD symptoms). These alternative outcomes hold different implications regarding the etiological factors that likely drive maturing out and regarding the extent to which risk for drinking-related problems persists following maturing out. Thus, the second question addressed by the current study was whether certain patterns of drinking behaviors are more common than others following maturing out.
The above two questions can be directly addressed through an analytic approach that integrates typological and longitudinal methodology. This approach involves the classification of individuals into groups (typological) and the analysis of transitions that are made among these groups over time (longitudinal; Jackson, O’Neill, & Sher, 2006). This type of an integrative approach can advance previous research by offering a richer characterization of the age-related changes that typify maturing out. To our knowledge, only one study has applied this type of approach to the investigation of maturing out of alcohol involvement. Using latent transition analysis (LTA), Jackson, Sher, Gotham, and Wood (2001) classified participants into four “drinking statuses” based on alcohol consumption and subjective intoxication and then characterized their transitions among theses statuses from age 18 to 24. Regarding the two questions discussed above, although Jackson et al. did not empirically test these specific questions, their descriptive results suggested that (1) declines were more likely for those initially classified into heavier-intoxication statuses and (2) declines typically resulted in transitions to lower-intoxication statuses rather than abstinence.
Although Jackson et al. (2001) made an important contribution to research on developmental changes in alcohol involvement, the present study’s LTA analysis extends their work in important ways. First, Jackson et al. studied an age span that is primarily associated with age-related increases in alcohol involvement (ages 18 to 24). Thus, the declines shown in their study may not capture the more typical declines of maturing out. In contrast, the current study characterized transitions from late adolescence (a period of peaking alcohol involvement) to young adulthood (a period of normative decline) and also characterized later transitions from young adulthood to adulthood. Second, we based our drinking status classifications upon a more comprehensive set of indicators including drinking frequency, drinking quantity, binge drinking, and AUD symptoms. Of particular importance, our inclusion of AUD symptoms enhanced the clinical relevance of our findings by indicating the likelihood of clinically significant drinking problems within each drinking status. Finally, because Jackson et al. did not statistically test whether those who were more alcohol involved were more likely to decline in drinking or whether declines resulted in moderation of drinking more often than abstinence, the current study is the first to empirically evaluate these questions. Based on prior literature and Jackson et al.’s findings, we hypothesized that maturing out transitions (1) would be significantly more common among those with more problematic initial drinking statuses and (2) would result in declines to lower-risk drinking significantly more often than declines to abstinence.
Predictors of Drinking Status Transitions: Familial Alcoholism and Gender
Familial alcoholism
Family history of alcohol disorders is a robust predictor of alcohol involvement (for a review, see Chassin, Beltran, Lee, Haller, & Bountress, in press). However, there have been mixed results from the few studies that have investigated its effects on age-related declines in alcohol involvement during young adulthood (i.e., maturing out). In Jackson et al.’s (2001) LTA study spanning ages 18 to 24 (described above), familial alcoholism predicted a decreased likelihood of declining from the high-intoxication drinking status. In addition, Jackson, Sher, and Wood (2000) found more familial alcoholism in a group with chronic AUDs than in a group with AUDs that remitted during young adulthood. However, other studies have found that, although familial alcoholism predicted greater initial escalation in various indicators of alcohol involvement, it was unrelated to the likelihood of later declines (Jackson & Sher, 2005; Warner, White, & Johnson, 2007). The current study thus tested whether parental alcoholism predicted the likelihood of transitioning to less problematic drinking statuses (i.e., maturing out) between late adolescence and adulthood.
Gender
Not only do males show greater initial escalation than do females in various indicators of alcohol involvement; they also tend to show less dramatic declines over the course of young adulthood (i.e., less maturing out). For example, in Jackson et al.’s (2001) LTA study spanning ages 18 to 24 (described above), males were less likely than were females to decline from the high-intoxication drinking status. Other studies have shown that males either declined less than did females or persisted longer than did females before declining (Bartholow, Sher, & Krull, 2003; Harford et al., 2005; Marmorstein, 2009; Wells, Horwood, & Fergusson, 2006; see also Figure 3 in Masten et al., 2008). Finally, some studies have found more males among groups with chronically high levels of alcohol involvement than among groups with alcohol involvement that declined during young adulthood (Jackson & Sher, 2005; Schulenberg, Wadsworth, O’Malley, Bachman, & Johnston, 1996). However, other studies have found gender to be unrelated to the likelihood of young adult declines in alcohol involvement (Chassin, Flora, & King, 2004; Tanner et al., 2007; Warner et al., 2007). The current study thus tested whether gender predicted the likelihood of transitioning to less problematic drinking statuses (i.e., maturing out) between late adolescence and adulthood.
Method
Participants
Participants were from a larger ongoing longitudinal study of familial alcoholism (Chassin & Barrera, 1993; Chassin et al., 2004; Chassin, Pitts, DeLucia, & Todd, 1999; Chassin, Rogosch & Barrera, 1991). At Wave 1, the total sample (N=454) ranged from age 11 to 15 (M=12.7; SD=1.45) and consisted of 246 children of alcoholics (COAs) and 208 demographically matched non-COAs. Data were collected annually from Wave 1 to Wave 3, and then at five year intervals from Wave 3 to Wave 6. Full-biological siblings were included as additional participants at Waves 4 (n=327), 5 (n=346), and 6 (n=349) if they were within the same age range as the original participants. Sample retention was excellent with 90% of original participants retained at Wave 4 (N=407), 91% of original participants and previously recruited siblings retained at Wave 5 (N=708), and 90% (N=737) of living original participants and previously recruited siblings retained at Wave 6. Retention was unbiased by gender but was slightly poorer for COAs than for non-COAs at Waves 4 and 5, but not 6.
The current sample included all original adolescents and siblings who were interviewed at Wave 4, Wave 5, or Wave 6 (N=844). This sample ranged in age from 17 to 27 at Wave 4 (M=21.1; SD=2.3), from 22 to 33 at Wave 5 (M=26.6; SD=2.6), and from 27 to 40 at Wave 6 (M=32.9; SD=2.7). Also, 51% were COAs, 53% were male, 71% were non-Hispanic Caucasian, 27% were Hispanic, and 29% had graduated college by Wave 6. For analyses, data from Waves 4, 5, and 6 were restructured into three longitudinal age bands: 17 to 22 (age band 1), 23 to 28 (age band 2), and 29 to 40 (age band 3). These age bands were chosen on the basis of previous epidemiologic studies (e.g., Chen & Kandel, 1995; Harford et al., 2005; Johnston et al., 2007b), which have shown that ages 17 to 22 (age band 1) are associated with increasing and peaking alcohol involvement, ages 23 to 28 (age band 2) are associated with decreasing alcohol involvement (i.e., maturing out), and ages 29 to 40 (age band 3) are associated with relative stabilization of alcohol involvement. Prior to constructing these age bands, the above pattern of age-related changes from epidemiologic studies was confirmed in the current sample in the age-specific means for each of the current study’s alcohol-related variables (see Measures section). Further, a variety of alternative age bands were initially constructed, but we found that they showed similar patterns of drinking-related changes and similar overall levels of missing data, so our initial age bands were retained. We refer to age bands 1, 2, and 3 as late adolescence, young adulthood, and adulthood, respectively. Note that, although these terms are often used to describe developmental stages characterized by specific social-contextual circumstances, and although opinions vary regarding the specific age ranges of these stages, we use them simply as terms to refer to our three age bands and the age ranges that they roughly represent.1
Missing Data
Of the current sample, 52.0% (n=439) had data for Waves 4, 5, and 6 that fit into all three age bands (late adolescence, young adulthood, and adulthood). The remaining 48.0% (n=409) were missing data for at least one age band either due to attrition (although data loss from attrition was minimal; see above) or due to having measurements at ages that did not fit into each of the three age bands. For example, participants who were already older than age 22 at Wave 4 had no data that fit into age band 1. Thus, they were treated as missing at age band 1 and their Wave 4 data were instead used for age band 2. When participants had two waves of data fitting into the same age band, we chose the wave at which the participant was closest to the age band’s midpoint age. To more specifically characterize the 48% of the current sample with some missing data, 36.7% of the current sample (n=310) had data that fit two of the three age bands, and 11.3% (n=95) had data that fit one of the three age bands. Also, 69.0% (n=582) of the current sample had data that fit age band 1, 85.2% (n=719) had data that fit age band 2, and 86.6% (n=731) had data that fit age band 3. Analyses used full information maximum likelihood estimation to include participants with one or two missing age bands.
Regarding potential bias resulting from missingness, age band 1 (i.e., late adolescent) missingness was not related to gender, COA status, or AUD symptoms at age band 2 or 3, but was associated with lower age band 2 and 3 drinking frequency (r=−.10, p=.01; r=−.08, p=.03; respectively), lower age band 2 and 3 binge drinking frequency (r=−.08, p=.03; r=−.12, p=.001; respectively), and lower drinking quantity only at age band 3 (r=−.09, p=.01). Age band 2 (i.e., young adult) missingness was not related to gender, COA status, or any of the drinking-related outcomes at age band 1 or 3. Finally, age band 3 (i.e., adult) missingness was not related to AUD symptoms or drinking quantity at age band 1 or 2, but was associated with parental alcoholism (r=.08, p=.01), male gender (r=.09, p=.01), and higher drinking frequency and binge drinking frequency only at age band 2 (r=.09, p=.02; r=.09, p=.02; respectively). However, all significant effects of missingness were small in magnitude (Cohen, 1992), and thus likely had little biasing impact on analyses.
Recruitment
For details of sample recruitment, see Chassin, Barrera, Bech and Kossak-Fuller (1992). COA families were recruited using court records of DUI arrests, health-maintenance organization wellness questionnaires, and community telephone screenings. Computerized structured interviews were used to confirm parental lifetime alcohol abuse or dependence. Reverse directories were used to locate potential non-COA families in the same neighborhoods as COA families, and telephone screening was used to match non-COA families to COA families on ethnicity, family structure, adolescent’s age, and socioeconomic status. Computerized structured interviews were used to confirm that neither parent in potential non-COA families met lifetime criteria for alcohol abuse or dependence (see Measures section).
For details of sample representativeness, see Chassin et al. (1991, 1992). Recruited participants did not differ from non-recruited potential participants on alcoholism indicators from archival records. Further, the alcoholic parents had rates of other psychopathology similar to those of a community-dwelling alcoholic sample (Helzer & Pryzbeck, 1988). However, recruited participants were less likely than non-recruited potential participants to be Hispanic and to be married.
Procedure
At each wave, data were typically collected via in-person interviews and entered into laptop computers by trained project personnel. Family members were typically interviewed simultaneously and in separate rooms to avoid contamination and to increase privacy. Telephone interviews were used for participants who had relocated out-of-state. Confidentiality was reinforced with a Department of Health and Human Services Certificate of Confidentiality. Interviews typically lasted 1–3 hours, and participants were paid up to $70 for each interview.
Measures
As described below, we created observed indicators of latent drinking statuses from measures of drinking frequency, drinking quantity, frequency of binge drinking, and AUD symptoms. This was done using cut-off values that were chosen on substantive grounds, although we also tested various other combinations of alternative cut-off values (see below) and confirmed that these produced very similar results with regard to the latent statuses produced by our latent class models (described later).
Drinking frequency
At Waves 4, 5, and 6, two items asked participants how frequently in the past year they drank hard liquor and beer or wine, respectively. Response options for both items ranged from (0) never to (7) every day. The highest score from these two items was used as a measure of overall drinking frequency. This strategy was chosen as an alternative to summing the two drinking frequency variables in order to avoid over-estimating drinking frequency for participants who tended to drink both hard liquor and beer or wine in a single drinking occasion. This was especially important for the current study because this type of over-estimation would likely confound our measures of drinking frequency and drinking quantity. Final analyses used a trichotomous indicator of overall drinking frequency that classified participants as non-drinkers, less than weekly drinkers, or weekly or more drinkers. As described above, to ensure that our findings were not confined to one set of cut-off values, we tested a variety of other cut-offs including an alternative drinking frequency trichotomization of non-drinkers, less than monthly drinkers, or monthly or more drinkers, with no substantive changes in findings.
Drinking quantity
At Waves 4, 5, and 6, two items asked participants how much hard liquor and beer or wine they drank, respectively, on a typical drinking occasion. Response options for both items ranged from (1) one drink to (8) nine or more drinks. Non-drinkers were assigned a value of zero for both items. The sum of these two items was used as a measure of overall drinking quantity. Final analyses used a trichotomous indicator of overall drinking quantity that classified participants as non-drinkers (overall drinking quantity of 0 drinks), non-binge-drinkers (overall drinking quantity of 1 to 4 drinks), or binge drinkers (overall drinking quantity of 5 or more drinks). As described above, to ensure that our findings were not confined to one set of cut-off values, we tested a variety of other cut-offs including an alternative drinking quantity trichotomization of low, moderate, and high quantity tertiles, with no substantive changes in findings.
Frequency of binge drinking
At Waves 4, 5, and 6, one item asked participants how frequently over the past year they drank 5 or more drinks in one sitting with response options ranging from (0) never to (7) every day. Final analyses used a trichotomous indicator of binge drinking that classified participants as non-binge drinkers, less than weekly binge drinkers, or weekly or more binge drinkers. As described above, to ensure that our findings were not confined to one set of cut-off values, we tested a variety of other cut-offs including an alternative trichotomization of non-binge-drinkers, less than monthly binge drinkers, or monthly or more binge drinkers, with no substantive changes in findings.
AUD Symptoms
The proposed 5th edition of the Diagnostic and Statistical Manual of Mental Disorders (DSM-V; American Psychiatric Association, 2010) includes eleven symptoms of Alcohol Use Disorder (AUD; a single disorder proposed to replace the current system of separate Alcohol Abuse and Alcohol Dependence disorders). Using dichotomous (yes-or-no) items from Waves 4, 5, and 6 that assessed past-year drinking consequences and past-year DSM-III-R (American Psychiatric Association, 1987) alcohol dependence symptoms, we were able to assess nine of the eleven proposed past-year DSM-V AUD symptoms. These nine symptoms were (1) alcohol-related failures in major role obligations, (2) alcohol use in physically hazardous situations, (3) social or interpersonal alcohol-related problems, (4) alcohol tolerance, (5) alcohol withdrawal, (6) alcohol use in larger amounts or over longer periods of time than expected, (7) persistent desire or unsuccessful efforts to control alcohol use, (8) much time spent obtaining, using, or recovering from alcohol use, and (9) alcohol cravings. Consistent with the proposed diagnostic threshold for a DSM-V AUD, final analyses used a dichotomous indicator that classified participants as having less than two or two or more of these nine symptoms. As described above, to ensure that our findings were not confined to one set of cut-off values, we tested a variety of other cut-offs including an alternative dichotomization of less than three or three or more AUD symptoms and an alternative trichotomization of none, one, or two or more AUD symptoms, with no substantive changes in findings.
Regarding validity of these 9 symptoms as indicators of a global AUD construct, single-factor confirmatory factor analysis models supported a unitary factor structure at each of the three age bands (all CFIs ≥ .99; all RMSEAs ≤ .04; standardized factor loadings ranged from .73 to .96). One previous study with a different subsample of the larger parent project has shown these symptoms to relate to genetic risk (OPRM1 μ-opioid receptor variation), parental alcoholism, and peer drinking with genetic moderation (Chassin, Lee et al., in press). Regarding convergent validity, across the three age bands, the dichotomous indicator used for final analyses (see above) was strongly correlated with DSM-III-R alcohol diagnoses (both dependence only and abuse or dependence; rs ranged from .53 to .57, all ps < .001). These DSM-III-R diagnostic variables are derived from the C-DIS, which has excellent reliability (see Parental Alcoholism section below) and has been used widely including numerous times in the larger project (e.g., Chassin et al., 2004; Chassin et al., 1999).
Parental alcoholism
At Wave 1, when participants were on average 12.7 years of age (SDage=1.45), both parents’ lifetime alcoholism diagnoses (abuse or dependence) were obtained using DSM-III criteria (American Psychiatric Association, 1980) with a computerized version of the Diagnostic Interview Schedule (DIS-III; Robins, Helzer, Croughan, & Ratcliff, 1981; Robins, Helzer, Ratcliff, & Seyfried, 1982). The DIS was designed to permit administration by lay interviewers in large epidemiological studies. Initial evaluation studies compared diagnoses obtained by lay interviewers using the DIS to those obtained by psychiatrists who could also ask supplemental questions (Robins et al., 1981; Robins et al.. 1982). Alcohol abuse/dependence had one of the highest levels of agreement (κ=.86) and had excellent sensitivity (κ=.86) and specificity (κ=.98). For non-interviewed parents, alcoholism diagnoses were established using Family History Research Diagnostic Criteria (Endicott, Anderson, & Spitzer, 1975) on the basis of spousal reports. Participants who were classified as COAs had to have at least one biological and custodial parent with a lifetime alcohol abuse or dependence diagnosis, and participants who were classified as non-COAs had to have no biological or custodial parents with lifetime alcohol abuse or dependence diagnoses.
The COA selection criteria that the alcoholic parent had to be both a biological and a custodial parent was used to ensure that COAs had the possibility of being exposed to risk through both biologically- and environmentally-mediated pathways. Lifetime (rather than current) diagnoses were chosen because some of the risk pathways associated with parental alcoholism are genetically mediated (Brown et al., 2008; Kendler, Schmitt, Aggen, & Prescott, 2008). Thus, parental remission of alcoholism does not necessarily eliminate risk in offspring (DeLucia, Belz, & Chassin, 2001; Hussong et al., 2008). This definition of parental alcoholism has significantly predicted a wide range of outcomes in the larger project including adolescent externalizing symptoms, internalizing symptoms, and substance use; young adult substance use disorders; and developmental trajectories of substance use and substance use disorders from adolescence to adulthood (e.g., Chassin et al., 1991; Chassin et al., 1999; Chassin et al., 2004). Moreover, to ensure that the current findings were not confined to one definition of parental alcoholism, we calculated two alternative variables where alcoholic parents either (1) met past-year diagnoses at Wave 1 or (2) remained custodial parents across Waves 1 through 3 (i.e., at least through adolescence; 84% of original COAs). We then correlated our parental alcoholism variable and these alternative parental alcoholism variables with our drinking-related variables (described above). We found extremely similar correlations across parental alcoholism variables, and no correlations for the alternative variables differed significantly from those produced by our original parental alcoholism variable.
Analyses and Results
Both latent class analysis (LCA) and latent transition analysis (LTA) models use observed indicators (i.e., measured variables) to identify distinct latent statuses (i.e., latent classes or groups) of individuals within an overall sample. However, LCA models typically identify latent statuses at a single time-point, whereas LTA models identify latent statuses at multiple time points in order to characterize the transitions that are made among these statuses over time. For the current study, both LCA and LTA models were estimated using Mplus Version 5.21 (Muthén & Muthén, 1998–2007). All models used full information maximum likelihood estimation in order to include participants with incomplete data. The clustering of participants within families in our data would have likely produced minimal bias because design effects were small (ranging from 1.07 to 1.22 across our age bands and drinking-related variables; for simulations of the impact of design effects, see Table 2 of Muthén & Satorra, 1995). Nevertheless, to more appropriately model this data clustering, all models used a robust sandwich estimator (i.e., Mplus option TYPE=COMPLEX) to obtain adjusted standard errors and chi square statistics.
For LTA models, global fit was evaluated using a parametric bootstrap estimated Pearson chi square (χ2) distribution, given problems associated with the theoretical χ2 distribution when data are sparse (Collins, Fidler, Wugalter, & Long, 1993; Langeheine, Pannekoek, & van de Pol, 1996). Prior to testing questions of substantive interest, measurement invariance was evaluated both over time (i.e., across age bands) and between groups (males vs. females; COAs vs. non-COAs) through likelihood ratio (ΔL2) nested model tests of item-response probability constraints. Likelihood ratio (ΔL2) nested model tests were also used for omnibus tests of substantive interest when comparing groups on latent status prevalences and transitional probabilities. Finally, more specific tests of substantive interest (e.g., comparisons among transitional probabilities) were carried out using Wald χ2 tests of equality constraints among model parameters (Muthén & Muthén, 1998–2007). Our general strategy was to conduct omnibus tests of multiple constraints and to conduct more specific follow-up tests only following a significant omnibus test. In addition, specific follow-up tests were grouped into families, and we addressed family-wise alpha (α) inflation by calculating adjusted p-values (padj) for each follow-up test based on modified Bonferroni adjustments (Holm, 1979; McDonald, Seifert, Lorenzet, Givens, & Jaccard, 2002).2 This adjustment adequately controls Type 1 error rates while offering greater statistical power than the traditional Bonferroni method (McDonald et al., 2002).
Preliminary Model Building with Latent Class Analysis
As part of a recommended model-building strategy for LTA models (Nylund, Asparouhov, & Muthén, 2007), preliminary LCA models were estimated at each of the three age bands (late adolescence, young adulthood, and adulthood). In order to capture a broad range of severity of alcohol involvement, observed indicators of latent drinking statuses included drinking frequency, drinking quantity, frequency of binge drinking, and AUD symptoms. We created observed indicators by dichotomizing or trichotomizing the original variables using cut-off values that were chosen on substantive grounds (see Measures for details). We categorized the original variables to maximize clinical relevance of the drinking statuses and to avoid analytic complexity that would result from modeling the original variables as zero-inflated counts. At each age band, we compared LCA models specifying different numbers of latent statuses (ranging from two to six) based on both relative fit indices (e.g., Bayesian information criterion; Schwartz, 1978) and the substantive interpretability of the resulting latent statuses (as recommended by Lanza & Collins, 2008 and Nylund et al., 2007). Across age bands, relative fit indices consistently supported models specifying 4 latent statuses, and these models consistently produced the most parsimonious and interpretable statuses (see below for a description of the latent statuses).
Latent Transition Analysis
Based on the above LCA models, an LTA model was estimated that used the same observed indicators and specified 4 latent drinking statuses at all three age bands (late adolescence, young adulthood, and adulthood). Item-response probabilities were constrained to be equal across the three age bands (i.e., measurement invariance over time) but transitional probabilities were freed to vary. This model was not rejected according to the parametric bootstrap estimated p-value of its Pearson χ2 statistic of overall model fit (χ2(157373)= 4214.82, p = .058). The marginal significance of this test was likely due to the model’s assumption of time-invariant item-response probabilities, given that a likelihood ratio test showed significantly better fit when item-response probabilities were freed to vary across age bands (ΔL2(56) = 119.25, p < .001). However, because the differences in item-response probabilities across age bands appeared small and substantively unimportant, we chose to retain our initial constraints on item-response probabilities in order to preserve the interpretability of results.3
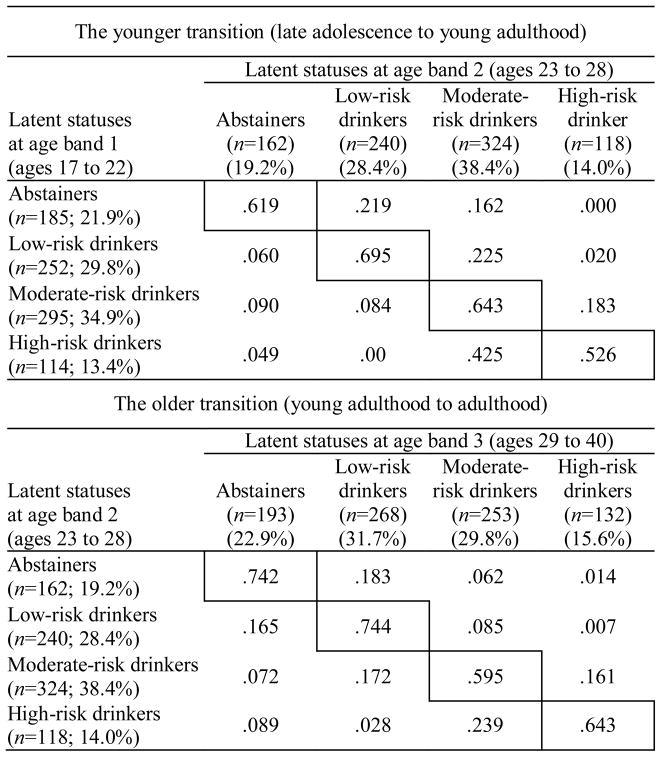
Table 1 presents this LTA model’s item-response probabilities, which characterize the four latent drinking statuses by showing the probabilities of different values on observed indicators for members of each latent status. As indicated by these item-response probabilities, the resulting four latent statuses were highly similar to those produced by the preliminary LCA models described above, and they reflected four substantively distinct and meaningful groups: (1) abstainers who were extremely unlikely to engage in any form of alcohol involvement, (2) low-risk drinkers who tended to drink less than weekly and were at low risk for either binge drinking or having two or more DSM-V AUD symptoms, (3) moderate-risk drinkers who tended to binge drink less than weekly and were at moderate risk (21.9%) for having 2 or more DSM-V AUD symptoms, and (4) high-risk drinkers who tended to binge drink at least weekly and were at high risk (65.3%) for having two or more DSM-V AUD symptoms.
Table 1.
Item-Response Probabilities for the Four Latent Drinking Statuses from the Latent Transition Analysis Model
| Observed latent status indicators | Latent drinking statuses
|
|||
|---|---|---|---|---|
| Abstainers | Low-risk drinkers | Moderate-risk drinkers | High-risk drinkers | |
| DSM-V alcohol use disorder symptoms | ||||
| < 2 | 0.993 | 0.993 | 0.781 | 0.347 |
| ≥ 2 | 0.007 | 0.007 | 0.219 | 0.653 |
| Binge drinking | ||||
| None | 0.995 | 0.750 | 0.078 | 0.000 |
| < weekly | 0.005 | 0.248 | 0.918 | 0.328 |
| ≥ weekly | 0.000 | 0.002 | 0.004 | 0.672 |
| Drinking quantity | ||||
| None | 1.000 | 0.011 | 0.004 | 0.000 |
| 1 to 4 drinks | 0.000 | 0.975 | 0.408 | 0.089 |
| ≥ 5 drinks | 0.000 | 0.014 | 0.587 | 0.911 |
| Drinking frequency | ||||
| None | 0.978 | 0.000 | 0.000 | 0.000 |
| < weekly | 0.022 | 0.932 | 0.720 | 0.096 |
| ≥ weekly | 0.000 | 0.068 | 0.280 | 0.904 |
|
| ||||
| n (% of sample) | ||||
| Age band 1 | 185 (21.9%) | 252 (29.8%) | 295 (34.9%) | 114 (13.4%) |
| Age band 2 | 162 (19.2%) | 240 (28.4%) | 324 (38.4%) | 118 (14.0%) |
| Age band 3 | 193 (22.9%) | 268 (31.7%) | 253 (29.8%) | 132 (15.6%) |
Note. These item-response probabilities characterize the latent drinking statuses by showing the probabilities of different values on observed indicators for members of each status. Only one set of item-response probabilities is presented because item-response probabilities were constrained to be equal across the three age bands. For each status, n reflects the model-estimated status size and the percentage reflects the model-estimated prevalence relative to the overall sample.
Table 2 presents transitional probabilities from this LTA model, which characterize the likelihood of specific transitions among the four latent drinking statuses both between age bands 1 and 2 (late adolescence to young adulthood) and between age bands 2 and 3 (young adulthood to adulthood). We tested differences among transitional probabilities using Wald χ2 tests of equality constraints and conducted specific follow-up tests only when initial omnibus tests were significant. Testing was primarily aimed at evaluating the following two hypotheses: (1) declining transitions (i.e., maturing out) will be more common among those in higher-risk initial drinking statuses and (2) declining transitions will result in lower-risk drinking more often than abstinence.
Table 2.
Transitional Probabilities from the Latent Transition Analysis Model
|
Note. These transitional probabilities characterize the likelihood of specific transitions among the four latent drinking statuses both between late adolescence and young adulthood (upper) and between young adulthood and adulthood (lower). Probabilities on the diagonals reflect stability, probabilities below the diagonals reflect declines (i.e., maturing out), and probabilities above the diagonals reflect escalation. For each status, n reflects the model-estimated status size and the percentage reflects the model-estimated prevalence relative to the overall sample.
Comparing rates of maturing out from different initial drinking statuses
Two omnibus tests were conducted for the younger transition (late adolescence to young adulthood) and the older transition (young adulthood to adulthood), respectively, to test whether or not declining transitions were equally likely across different initial drinking statuses (see Table 2 for transitional probabilities). Specifically, these tests evaluated constraints that equated (1) declines from low-risk drinking to abstinence, (2) declines from moderate-risk drinking to low-risk drinking or abstinence, and (3) declines from high-risk drinking to moderate-risk drinking, low-risk drinking, or abstinence. The omnibus tests rejected these constraints during both the younger and older transition (χ2(2) = 28.312, p < .001; χ2(2) = 6.728, p = .03; respectively). Thus, separately for both transitions, we conducted a family of three-specific follow-up tests with modified-Bonferroni-adjusted p-values.
During the younger transition, specific follow-up tests consistently supported the hypothesis that declines would be more common among those in higher-risk initial drinking statuses. Specifically, moderate-risk drinkers declined more often than did low-risk drinkers (χ2(1) = 5.47, p = .02, padj = .02), and high-risk drinkers declined more often than did both low-risk drinkers (χ2(1) = 24.88, p < .001, padj < .001) and moderate-risk drinkers (χ2(1) = 7.12, p = .008, padj = .02). For a graphical depiction of these results, see the left panel of Figure 1. Additional tests aimed at further characterizing these differences showed that low-risk drinkers were actually more likely to escalate than they were to decline (χ2(1) = 10.32, p = .001), whereas moderate-risk drinkers declined about as often as they escalated (χ2(1) = 0.02, p = .89). The extent of declines among high-risk drinkers is evidenced by the fact that they declined about as often as they stayed in the same status (χ2(1) = 0.10, p = .75), whereas the other three statuses stayed the same more often than they changed status in any direction (declining or escalating; abstainers: χ2(1) = 5.09, p = .02; low-risk drinkers: χ2(1) = 14.33, p < .001; moderate-risk drinkers: χ2(1) = 7.12, p = .008).
Figure 1.
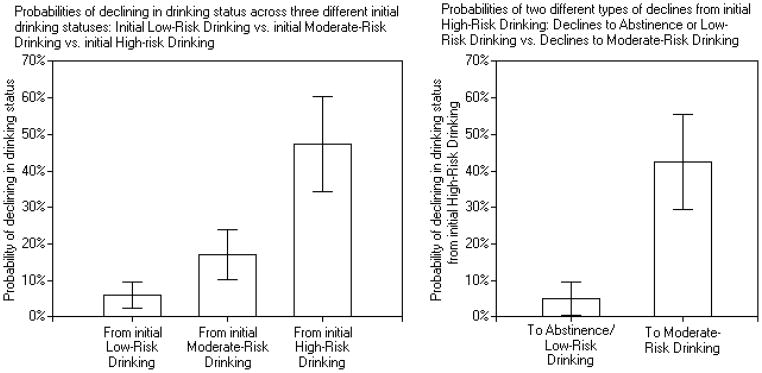
Graphical depictions of key findings during the transition from late adolescence to young adulthood (age band 1 to 2). Vertical bars show 95% confidence intervals of transitional probabilities.
In contrast, during the older transition, although a similar pattern of transitional probabilities was observed (see Table 2), specific follow-up tests provided little evidence for significantly different rates of decline across different initial drinking statuses. Specifically, moderate-risk drinkers did not decline significantly more often than low-risk drinkers (χ2(1) = 2.31, p = .13, padj = .26) and high-risk drinkers did not decline significantly more often than moderate-risk drinkers (χ2(1) = 1.68, p = .20, padj = .20). However, high-risk drinkers did decline marginally significantly more often than low-risk drinkers (χ2(1) = 5.62, p = .02, padj = .05). Additional tests aimed at further characterizing these results showed that both low-risk drinkers and moderate-risk drinkers were about as likely to decline as they were to escalate (χ2(1) = 0.39, p = .53; χ2(1) = 2.45, p = .12; respectively). Also, whereas high-risk drinkers stood out in the younger transition as declining about as often as they stayed in the same status, in the older transition all four initial statuses stayed in the same status more often than they changed statuses (abstainers: χ2(1) = 31.26, p < .001; low-risk drinkers: χ2(1) = 20.83, p < .001; moderate-risk drinkers: χ2(1) = 3.29, p = .07; high-risk drinkers: χ2(1) = 3.82, p = .05). Thus, at this later transition, there appeared to be less dramatic differences in maturing out across different initial drinking statuses, partly due to greater temporal stability among high-risk drinkers.
Comparing rates of maturing out to different drinking statuses
Two omnibus tests were conducted for the younger transition (late adolescence to young adulthood) and the older transition (young adulthood to adulthood), respectively, to test whether declines to certain drinking statuses were more likely than declines to others (see Table 2 for transitional probabilities). Specifically, these tests evaluated constraints that equated the two possible types of declines from moderate-risk drinking (to low-risk drinking and to abstinence) and also equated the three possible types of declines from high-risk drinking (to moderate-risk drinking, to low-risk drinking, and to abstinence). The omnibus tests rejected these constraints during both the younger and older transition (χ2(3) = 35.82, p < .001; χ2(3) = 12.34, p = .006; respectively). Thus, separately for both transitions, we conducted a family of four specific follow-up tests with modified-Bonferroni-adjusted p-values.
During the younger transition, consistent with hypotheses, specific follow-up tests showed that high-risk drinkers became moderate-risk drinkers more often than they became abstainers (χ2(1) = 17.41, p < .001, padj < .001), more often than they became low-risk drinkers (χ2(1) = 28.13, p < .001, padj < .001), and more often than they became either abstainers or low-risk drinkers combined (χ2(1) = 17.41, p < .001, padj < .001). For a graphical depiction of these results, see the right panel of Figure 1. In contrast, inconsistent with hypotheses, follow-up tests showed that moderate-risk drinkers became low-risk drinkers about as often as they became abstainers (χ2(1) = 0.02, p = .90, padj = .90).
During the older transition, follow-up tests again showed that high-risk drinkers became moderate-risk drinkers more often than they became low-risk drinkers (χ2(1) = 6.91, p = .009, padj = .04). However, unlike the younger transition, they did not become moderate-risk drinkers significantly more often than they became abstainers (χ2(1) = 3.27, p = .07, padj = .14) or significantly more often than they became either abstainers or low-risk drinkers combined (χ2(1) = 1.80, p < .18, padj < .18). Finally, moderate-risk drinkers became low-risk drinkers marginally more often than they became abstainers (χ2(1) = 5.06, p = .03, padj = .08).
Latent Transition Analysis with Subgroups: Effects of Parental Alcoholism and Gender
Two multiple group LTA models (see Muthén & Muthén, 1998–2007) were estimated in order to test differences between children of alcoholics (COAs; n=425) and non-COAs (n=419) and between males (n=446) and females (n=398), respectively. Effects of parental alcoholism and gender were modeled on latent drinking status prevalences at all three age bands and on both sets of latent drinking status transitions across the age bands. These models used the same observed indicators from our earlier LTA model and specified four latent drinking statuses at each age band. Likelihood ratio tests showed no significant reduction in model fit when item-response probabilities were constrained to be equal between subgroups for either the parental alcoholism LTA model (ΔL2(28) = 30.90, p = .32) or the gender LTA model (ΔL2(28) = 37.09, p = .12), thus supporting between-group measurement invariance for both models. Because we retained these constraints in our final models, the item-response probabilities were nearly identical to those from our earlier LTA model (see Table 1) and thus are not presented.
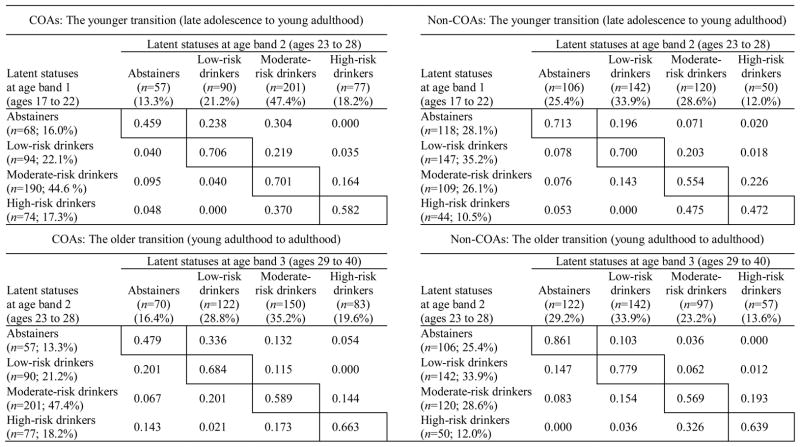
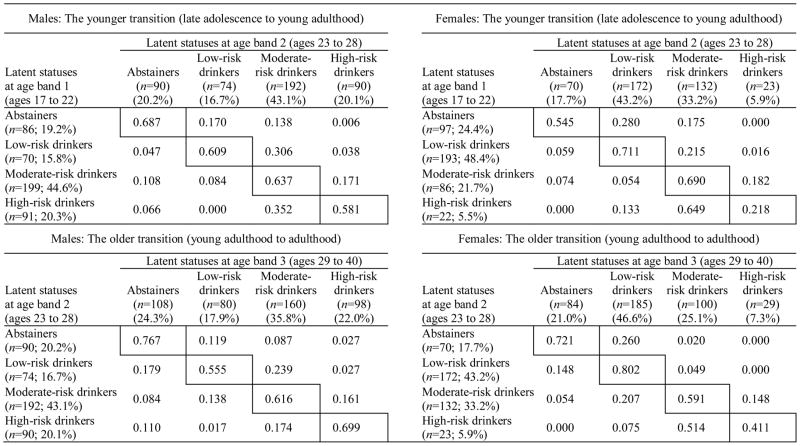
Table 3 presents latent drinking status prevalences and transitional probabilities separately for COAs and non-COAs based on the parental alcoholism LTA model. Table 4 presents analogous results separately for males and females based on the gender LTA model. Likelihood ratio tests showed that these models fit the data significantly better than nested models that constrained latent drinking status prevalences and transitional probabilities to be equal between subgroups (i.e., models assuming no effects of gender and parental alcoholism; ΔL2(27) = 97.55, p < .001; ΔL2(27) = 160.58, p < .001; respectively). Given this evidence for global subgroup differences from these omnibus tests, we then tested specific subgroup differences in both latent drinking status prevalences and declining transitional probabilities (i.e., maturing out) using Wald χ2 tests of equality constraints. Because effects of parental alcoholism and gender were tested separately and without controlling for age, it is important to note that parental alcoholism and gender were not significantly related to one another (r = .017, p = .61) or to age at age bands 1, 2, or 3 (parental alcoholism: t=.03, p=.98; t=−.82, p=.41; t=.75, p=.46; respectively; gender: t=.73, p=.47; t=1.29, p=.20; t=1.16, p=.25; respectively).
Table 3.
Transitional Probabilities from the Multiple Group Latent Transition Analysis Model Testing Effects of Parental Alcoholism
|
Note. These transitional probabilities characterize the likelihood of specific transitions among the four latent drinking statuses separately for COAs (left) and non-COAs (right) both between late adolescence and young adulthood (upper) and between young adulthood and adulthood (lower). Probabilities on the diagonals reflect stability, probabilities below the diagonals reflect declines (i.e., maturing out), and probabilities above the diagonals reflect escalation. For each status, n reflects the model-estimated status size and the percentage reflects the model-estimated prevalence relative to the overall subgroup.
Table 4.
Transitional Probabilities from the Multiple Group Latent Transition Analysis Model Testing Effects of Gender
|
Note. These transitional probabilities characterize the likelihood of specific transitions among the four latent drinking statuses separately for males (left) and females (right) both between late adolescence and young adulthood (upper) and between young adulthood and adulthood (lower). Probabilities on the diagonals reflect stability, probabilities below the diagonals reflect declines (i.e., maturing out), and probabilities above the diagonals reflect escalation. For each status, n reflects the model-estimated status size and the percentage reflects the model-estimated prevalence relative to the overall subgroup.
Comparisons between COAs and non-COAs
A family of twelve specific tests (with modified-Bonferroni-adjusted p-values) compared COAs and non-COAs on latent drinking status prevalences at each of the three age bands (late adolescence, young adulthood, and adulthood; see Table 3 for status prevalences). COAs were less likely than non-COAs to be abstainers across age bands 1, 2, and 3 (χ2(1) = 9.03, p = .003, padj = .01; χ2(1) = 9.69, p = .002, padj = .02; χ2(1) = 11.17, p < .001, padj = .01; respectively) and to be low-risk drinkers at age bands 1 and 2 but not 3 (χ2(1) = 9.41, p = .002, padj = .02; χ2(1) = 10.11, p = .002, padj = .009; χ2(1) = 1.28, p = .26, padj = .26; respectively). In contrast, COAs were more likely than non-COAs to be moderate-risk drinkers at age bands 1 and 2 and with marginal significance at age band 3 (χ2(1) = 15.31, p < .001, padj = .001; χ2(1) = 16.52, p < .001, padj < .001; χ2(1) = 6.66, p = .001, padj = .09; respectively). Finally, although COAs appeared more likely than non-COAs to be high-risk drinkers, these differences were not significant across age bands 1, 2, or 3 (χ2(1) = 4.20, p = .04, padj = .16; χ2(1) = 3.65, p = .056, padj = .17; χ2(1) = 2.87, p = .09, padj = .18; respectively).
A family of eight specific tests (with modified-Bonferroni-adjusted p-values) compared COAs and non-COAs on transitional probabilities during the younger transition (see Table 3 for transitional probabilities) and found no differences between COAs and non-COAs in overall declines from a given initial drinking status (e.g., from high-risk drinking to any other status) or in more specific declines from one status to another (e.g., from high- to moderate-risk drinking). During the older transition, an analogous family of eight tests found only that more COAs than non-COAs declined specifically from high-risk drinking to abstinence (χ2(1) = 7.55, p = .006, padj = .048). Finally, although not planned a priori, more COAs than non-COAs escalated from abstinence overall (i.e., to any other drinking status) during both the younger and the older transition (χ2(1) = 6.15, p = .01; χ2(1) = 19.95, p < .001; respectively).
Comparisons between males and females
A family of twelve specific tests (with modified-Bonferroni-adjusted p-values) compared males and females on latent drinking status prevalences at each of the three age bands (late adolescence, young adulthood, and adulthood; see Table 4 for status prevalences). Males and females did not differ in their likelihood of being abstainers across age bands 1, 2, and 3 (χ2(1) = 2.10, p = .15, padj = .44; χ2(1) = 0.60, p = .44, padj = .88; χ2(1) = 0.15, p = .70, padj = .70; respectively), but males were less likely than females to be low-risk drinkers across age bands 1, 2, and 3 (χ2(1) = 57.72, p < .001, padj < .001; χ2(1) = 43.87, p < .001, padj < .001; χ2(1) = 14.99, p < .001, padj < .001; respectively). In contrast, males were more likely than females to be moderate-risk drinkers at age band 1, but not at age band 2, and with marginal significance at age band 3 (χ2(1) = 22.75, p < .001, padj < .001; χ2(1) = 3.98, p = .046, padj = .18; χ2(1) = 6.34, p = .01, padj=.06; respectively). Finally, males were more likely than females to be high-risk drinkers across age bands 1, 2, and 3 (χ2(1) = 20.03, p < .001, padj < .001; χ2(1) = 19.54, p < .001, padj < .001; χ2(1)= 21.54, p < .001, padj < .001; respectively).
Two families of eight specific tests analogous to those used for parental alcoholism (see above) compared males and females on transitional probabilities during the younger and older transition, respectively (see Table 4 for transitional probabilities). However, these tests revealed no significant gender differences.
Discussion
Previous research has shown that there is a developmental process of “maturing out” of alcohol involvement that begins in young adulthood. However, the precise nature of the changes in drinking behaviors that best characterize maturing out has remained unclear. Thus, the present study aimed to provide a richer characterization of the age-related changes that typify maturing out. We used latent transition analysis, which holds advantages for this purpose given its integration of typological and longitudinal methodology. Through this technique, we empirically identified four substantively distinct and meaningful latent drinking statuses across three time points spanning from late adolescence to adulthood: (1) abstainers, (2) low-risk drinkers who typically drank less than weekly and were at low risk for binging and AUD symptomatology, (3) moderate-risk drinkers who typically binged less than weekly and were at moderate risk for AUD symptomatology, and (4) high-risk drinkers who typically binged at least weekly and were at high risk for AUD symptomatology. The current study focused on transitions among these latent drinking statuses over time with particular interest in whether maturing out transitions (1) were more common among those in higher-risk initial drinking statuses and (2) resulted in declines to lower-risk drinking more often than declines to abstinence.
Who Matures Out and How Do They Change?
During the developmental transition commonly associated with maturing out (late adolescence to young adulthood), results consistently showed that maturing out (i.e., declines to lower-risk drinking statuses) was more likely for those classified in higher-risk initial drinking statuses. High-risk drinkers showed the most maturing out by far with nearly half (47.4%) declining to a lower-risk drinking status, whereas only a small percent of moderate-risk drinkers (17.4%) and low-risk drinkers (6.0%) declined. Thus, the phenomenon thought of as “maturing out” might be better viewed as a subgroup-specific process occurring primarily among high-risk drinkers as opposed to a normative developmental process that occurs across most individuals. However, although our results showed that high-risk drinkers were most likely to decline, very few of them became abstainers or low-risk drinkers (4.9%). Instead they primarily declined to moderate-risk drinking (42.5%). These results suggest that maturing out is best viewed as a diminution rather than elimination of risky drinking.
It is important to note that our evidence for the greatest maturing out among initial high-risk drinkers was not likely caused by regression to the mean. Measurement error in initial assessments is considered a primary source of regression to the mean (Finney, 2008), and latent transition analysis accounts for measurement error through latent variable modeling with multiple observed indicators. Further, our study avoided other methodological factors that contribute to regression to the mean such as using baseline risk factors as participant inclusion criteria and assessing baseline severity over a limited time period (e.g., using past-month drinking items as opposed to our past-year items; see Finney, 2008). Given that high-risk drinkers declined primarily to moderate-risk drinking, it could also be argued that their declines represent a relatively minor shift along the continuum of alcohol involvement relative to other potential declining transitions. However, note that the item-response probabilities of the four latent statuses (see Table 1) suggest that the transition from high- to moderate-risk drinking was in fact quite substantial. For instance, this transition involved decreases from a high likelihood of experiencing two or more AUD symptoms (65%) to a moderate likelihood of experiencing two or more AUD symptoms (22%), and it involved decreases from a high likelihood of greater-than-weekly binge drinking (67%) to a very low likelihood of greater-than-weekly binge drinking (< 1%). Thus, we conclude that the transition from high- to moderate-risk drinking appears to represent a substantial and meaningful shift in alcohol involvement, and is at least as substantial as other declining transitions between adjacent statuses (e.g., moderate- to low-risk drinking).
The present study is the first to statistically demonstrate this characterization of maturing out. However, although not statistically tested, Jackson et al.’s (2001) LTA study suggested that those initially in higher-intoxication drinking statuses were more likely to mature out and that maturing out primarily resulted in declines to lower-intoxication drinking statuses rather than abstinence. The convergence of our findings with Jackson et al.’s is particularly noteworthy given that their study spanned a much more limited and younger age range (ages 18 to 24), and given that their drinking statuses were primarily differentiated on reports of subjective intoxication, whereas our drinking statuses were primarily differentiated on binge drinking and diagnostic symptoms. Our findings are also consistent with indirect evidence synthesized from multiple previous studies on age-related changes in alcohol involvement, which suggest that maturing out produces greater declines for more problematic aspects of drinking (Caswell et al., 2002; Jackson & Sher, 2005; Johnston et al., 2007b; see also Figures 4 and 5 in Masten et al., 2008).
Potential Implications for Etiological Influences on Maturing Out
Our finding that declines primarily occurred among initial high-risk drinkers suggests that maturing out is not a universal phenomenon that occurs uniformly across individuals. To understand why maturing out may primarily occur among initial high-risk drinkers, it is important to consider the etiological influences that likely drive maturing out. Previous research has suggested that these etiological influences include social-contextual changes in young adulthood such as the adoption of adult roles (e.g., marriage, parenthood, employment; Gotham, Sher, & Wood, 2003; Lee, Chassin, & MacKinnon, 2010; Staff et al., 2010) as well as young adult developmental changes in personality (Littlefield, Sher, & Wood, 2009) and cognitive control systems of the brain (Steinberg, 2007). Thus, maturing out appears to be driven both by new social contexts that increase motivation for behavioral change and by the development of self-regulatory abilities that increase capability for behavioral change. Our findings contribute to this conceptualization by suggesting that these etiological processes may not affect all individuals equally and instead may primarily affect the drinking behaviors of relatively high-risk initial drinkers. This may be because initial high-risk drinkers experience more drinking-related consequences (perhaps in their young adult roles), and therefore have greater motivation to utilize their emerging self-regulatory capabilities toward changing their drinking behaviors. This interpretation is consistent with role socialization theory, which suggests that, when pre-existing behaviors conflict with the demands of a new role, individuals must either reduce their problem behaviors or leave the role (Yamaguchi & Kandel, 1985). Future research should evaluate this interpretation of our findings by testing (1) whether effects of young adult role transitions on maturing out are stronger for higher-risk initial drinkers, (2) whether this is because higher-risk initial drinkers experience greater initial role impairment, and (3) whether their behavior change in response to role impairment is facilitated by increased self-regulatory abilities. Of course, an alternative (but not mutually exclusive) explanation for greater declines among higher-risk initial drinkers is that they are more likely to receive treatment due to the relatively consequential nature of their alcohol involvement. Post hoc analyses (not presented here) showed no evidence of this in the current data, but larger samples would provide more powerful tests. Each of these alternative explanations should be considered in future research.
One strength of the current study was a test of transitions during two different developmental periods. It is important to note that the pattern of greater declines among higher-risk initial drinkers was found only during the younger transition between late adolescence and young adulthood, which is the normative developmental period of maturing out. In the older transition from young adulthood to adulthood, there was greater stability among these high-risk drinkers. These findings suggest some developmental specificity to the processes of maturing out. The assumption of adult roles and the development of cognitive control abilities that occur during the transition from late adolescence to young adulthood likely create greater potential for change in alcohol involvement compared to later ages when there are less substantial and widespread changes in these etiological factors (Bachman, Wadsworth, O’Malley, Johnston, & Schulenberg, 1997; Casey, Tottenham, Liston, & Durston, 2005; Roberts, Walton, & Viechtbauer, 2006). By demonstrating the uniqueness of the maturing out period, the present study illustrates the utility of viewing problem drinking from a developmental perspective.
Clinical Implications
Another strength of the current study was our use of DSM-V AUD symptoms in our identification of latent drinking statuses, which is particularly informative when considering the clinical implications of our findings. For instance, given that high-risk drinkers were at high-risk for meeting the proposed DSM-V diagnostic threshold for AUD (i.e, having two or more AUD symptoms), their declines during the normative developmental period for maturing out may indicate this period’s potential for remission of clinically significant forms of alcohol involvement. However, because high-risk drinkers typically declined only to moderate-risk drinking, their maturing out is characterized by a substantial but nonetheless incomplete decline in risky drinking. In other words, their maturing out does not necessarily mean they are no longer at any risk; and in many cases, there may be continuing reason for clinical concern.
Of course, if motivation for their declines from high- to moderate-risk drinking is driven by social-contextual changes and increased self-regulatory abilities (as suggested above), this might present opportunities that could be harnessed in a clinical setting in order to help young adults achieve greater changes in drinking behaviors than they could achieve on their own. For instance, motivation to reduce drinking in response to new social roles (e.g., marriage) could be very useful within the context of a Motivational Interviewing approach to treatment (Miller & Rollnick, 2002). Thus, the normative developmental period for maturing out may hold unique potential for clinical interventions to converge with naturally occurring etiological processes and thereby produce particularly dramatic and lasting reductions in problem drinking. Clinical research should therefore investigate the possibility that treatment effects are enhanced among young adults who have recently experienced social-contextual or developmental changes thought to be associated with maturing out.
Subgroup Comparisons: Effects of Parental Alcoholism and Gender
Consistent with previous research, familial alcoholism and male gender predicted membership in more higher-risk drinking statuses. However, our results failed to replicate Jackson et al.’s (2001) LTA findings that familial alcoholism and male gender also predicted less maturing out. This may be due to limited statistical power, given that our transitional probabilities often appeared consistent with Jackson et al.’s, but our statistical tests were generally non-significant. Alternatively, Jackson et al. may have found stronger effects of parental alcoholism and gender on maturing out because their sample included only college students. In Jackson et al.’s college student sample, more low-risk individuals (e.g., non-COAs and females) might have experienced initial college-driven increases in alcohol involvement, and thus might have also experienced greater declines once the environmental influence of college was removed (e.g., upon graduation). Consistent with Schulenberg et al.’s (2001) notion of college drinking as a developmental disturbance, this illustrates the point that the associations of long-term risk factors (e.g., familial alcoholism and gender) with alcohol involvement likely vary across development due to changing rates of context-driven alcohol involvement among otherwise low-risk individuals (Jackson et al., 2001).
One significant effect of parental alcoholism was that more COAs than non-COAs declined from high-risk drinking into abstinence during the older transition, perhaps indicating differences between these groups in the mechanisms that drive maturing out. For example, high-risk drinking COAs may be more likely than high-risk drinking non-COAs to receive treatment, and treatment may increase the likelihood of decreasing to abstinence rather than merely decreasing to a lower-risk pattern of use. However, post hoc analyses among initial high-risk drinkers (separately for the younger and older transition) revealed that, although COAs were more likely than non-COAs to receive treatment during a given transition, treatment did not significantly differentiate declines to abstinence from declines to other statuses (low- or moderate-risk drinking combined).4 Alternatively, given COAs’ familial risk, they may more often believe that abstinence is necessary to maintain recovery from high-risk drinking. This is consistent with previous research showing that drinking restraint and concerns about drinking (1) are elevated among COAs and (2) prospectively predict reduced drinking among COAs (Chassin & Barrera, 1993; Haller & Chassin, 2010; Trim & Chassin, 2004). Thus, drinking restraint may operate as a mechanism of maturing out to abstinence especially for those with familial risk for alcohol problems.
Finally, we also found that COAs were less likely than non-COAs to maintain initial abstinence over time. This greater tendency toward escalating alcohol involvement among COAs is particularly noteworthy given that it was observed during a developmental period that is commonly associated with normative declines. This suggests that the risk associated with parental alcoholism not only manifests early in development (e.g., adolescence) but also poses risks for escalating alcohol involvement during later developmental stages (e.g., young adulthood and adulthood).
Limitations and Conclusions
Although the current study advanced prior research on maturing out through (1) employing a typological and longitudinal analytic approach, (2) utilizing indicators representing a broad range of drinking severity, (3) characterizing drinking transitions over a long period spanning late adolescence to adulthood, and (4) conducting significance tests to directly test the hypotheses of interest, it has limitations that should be noted. First, although our total sample size was large, statistical power may have been limited in some cases because of the relatively small subgroups that were compared in specific hypothesis tests. This may explain our failure to detect the apparent moderating effects of parental alcoholism and gender on maturing out transitions, and it precluded us from testing effects of contextual transitions such as marriage and college attendance due to the smaller and less balanced subgroups that these tests would involve. Second, our sample over-represents high-risk individuals, so findings may not generalize to other populations. Third, our sample was limited primarily to Hispanic and non-Hispanic Caucasian participants, so findings may not generalize to individuals of other races and ethnicities. Finally, our items measured use of both beer and wine (rather than measuring them with separate items), and this may have reduced precision.
Despite these limitations, the current study contributed in important ways to an empirical understanding of maturing out of alcohol involvement. Findings show that maturing out is more common among those initially engaged in highly risky drinking behaviors, but also that these individuals reduce rather than eliminate their risky drinking. These findings have important implications for the etiological processes that may drive maturing out, as well as important clinical implications, and they demonstrate the utility of viewing alcohol involvement within a developmental perspective.
Acknowledgments
This research was supported by National Institute on Alcohol Abuse and Alcoholism Grant R01 AA016213 and National Institute of Mental Health Grant T32 MH018387.
The authors wish to thank Christian Geiser for his help reviewing drafts of this paper and providing expert quantitative guidance.
Footnotes
Because each age band showed age heterogeneity, we tested supplemental LTA models to explore the impact of this heterogeneity. We tested an LTA model in which age band 1 was limited to ages 18 to 21 and age band 2 was limited to ages 24 to 28. The resulting transitional probabilities were very similar to those of our primary LTA model (see Analyses and Results). In addition, we dichotomized participants with a median split of age band 1 age and estimated separate LTA models with the resulting younger and older subsamples. Although escalation from abstinence and low-risk drinking appeared slightly more likely among the younger subsample, transitional probabilities were otherwise very similar to those of our primary model, particularly with regard to differences in rates of decline from different initial drinking statuses and to different subsequent drinking statuses (our two primary questions of interest). Based on this evidence for minimal age-related heterogeneity in transitional probabilities, we retained our original age bands in order to minimize missing data and thereby maximize statistical power.
The modified Bonferroni alpha (α) adjustment maintains a family-wise error rate of α=.05 across multiple tests (i.e., guards against alpha inflation) through a downward adjustment of test-wise α levels (i.e., critical significance values; see McDonald et al., 2002). It is performed by rank-ordering the p-values from a given family of tests from smallest to largest and then evaluating the significance of each p-value based on different adjusted α levels (αadj). The smallest p-value is compared to a critical value of αadj=(.05/k), where k is the total number of tests. The next smallest p-value is evaluated based on a critical value of αadj=(.05/k−1). This procedure is repeated until a non-significant p-value is found. However, in our application, rather than computing adjusted α levels (αadj) by dividing α by a given number of tests, we computed adjusted p-values (padj) by multiplying obtained p-values by a given number of tests. Through this technique, our padj values can be directly compared to a critical value of α=.05 in order to assess significance. The two methods produce the same results, but the latter facilitates more straightforward presentation of our findings.
A likelihood ratio test showed that the model constraining item-response probabilities to be equal across age bands produced significantly worse model fit compared to an unconstrained model (ΔL2=119.252, df=56, p<.001). However, relative fit indices (Akaine information criterion; AIC; Bayesian information criterion; BIC) suggested that the constrained model fit nearly as well (AIC of 9180.48 compared to 9169.41) or better (BIC of 9441.08 compared to 9695.35) than the unconstrained model. These relative fit indices penalize non-parsimony, thus suggesting that the improvement in fit was not substantial enough to justify the additional free model parameters. Further, item-response probabilities suggested that rejection of the constrained model was solely due to three variations in the profile of moderate-risk drinkers that did not greatly alter this group’s characterization. Specifically, for moderate-risk drinkers, the likelihood of 2 or more AUD symptoms was smaller at age band 3 (0.076) than at age bands 1 (0.312) and 2 (0.243), the likelihood of a drinking quantity of 5 or more was higher at age band 1 (0.817) than at age bands 2 (0.545) and 3 (0.457), and the likelihood of a drinking frequency of weekly or more was lower at age band 1 (0.069) than at age bands 2 (0.313) and 3 (0.380). To confirm this, we estimated an additional constrained model that left only these three item-response probabilities unconstrained, and this model did not produce significantly worse model fit compared to the fully unconstrained model (ΔL2=40.374, df=53, p=.894). Thus, we concluded that the impact of these minor variations in the profile of moderate-risk drinkers was far outweighed by the improved interpretability afforded by retaining our initial constraints.
Each participant was classified into his or her most likely latent status at each age band based on results of our multiple group LTA model of parental alcoholism effects (Muthén & Muthén, 1998–2007). Then, separately for initial high-risk drinkers at the younger transition and initial high-risk drinkers at the older transition, we used two-by-two Pearson χ2 tests to investigate (1) the associations of parental alcoholism with treatment occurring during the transition between age bands and (2) the association of treatment with declines to abstinence as opposed to declines to other statuses. We found that more COAs than non-COAs received treatment during both the younger and older transition (marginally significant at the younger transition; χ2=2.812, df=1, p=.094; χ2=4.875, df=1, p=.027; respectively). However, treatment did not distinguish declines to abstinence from declines to low- or moderate-risk drinking (combined) during either transition (χ2=0.423, df=1, p=.515; χ2=0.048, df=1, p=.826; respectively).
References
- American Psychiatric Association. Diagnostic and statistical manual of mental disorders. 3. Washington, DC: Author; 1980. [Google Scholar]
- American Psychiatric Association. Diagnostic and statistical manual of mental disorders. 3. Washington, DC: Author; 1987. rev. [Google Scholar]
- American Psychiatric Association. Proposed Revision to Alcohol-Use Disorder [webpage] 2010 Retrieved from: http://www.dsm5.org/ProposedRevisions/Pages/proposedrevision.aspx?rid=452.
- Bachman JG, Wadsworth KN, O’Malley PM, Johnston LD, Schulenberg JE. Smoking, drinking and drug use in young adulthood. Mahwah, NJ: Erlbaum; 1997. [Google Scholar]
- Bartholow BD, Sher KJ, Krull JL. Changes in heavy drinking over the third decade of life as a function of collegiate fraternity and sorority involvement: A prospective, multilevel analysis. Health Psychology. 2003;22:616–626. doi: 10.1037/0278-6133.22.6.616. [DOI] [PubMed] [Google Scholar]
- Brown SA, McGue M, Maggs J, Schulenberg J, Hingson R, Swartzwelder S, Martin C, Chung T, Tapert SF, Sher K, Winters KC, Lowman C, Murphy S. A developmental perspective on alcohol and youths 16 to 20 years of age. Pediatrics. 2008;121:S290–S310. doi: 10.1542/peds.2007-2243D. [DOI] [PMC free article] [PubMed] [Google Scholar]
- Casey BJ, Tottenham N, Liston C, Durston S. Imaging the developing brain: What have we learned about cognitive development? Trends in Cognitive Science. 2005;9:104–110. doi: 10.1016/j.tics.2005.01.011. [DOI] [PubMed] [Google Scholar]
- Casswell S, Pledger M, Pratap S. Trajectories of drinking from 18 to 26 years: Identification and prediction. Addiction. 2002;97:1427–1437. doi: 10.1046/j.1360-0443.2002.00220.x. [DOI] [PubMed] [Google Scholar]
- Chassin L, Barrera M. Substance use escalation and substance use restraint among adolescent children of alcoholics. Psychology of Addictive Behaviors. 1993;7:3–20. doi: 10.1037/0893-164X.7.1.3. [DOI] [Google Scholar]
- Chassin L, Barrera M, Bech K, Kossak-Fuller J. Recruiting a community sample of adolescent children of alcoholics: A comparison of three subject sources. Journal of Studies on Alcohol. 1992;53:316–319. doi: 10.15288/jsa.1992.53.316. [DOI] [PubMed] [Google Scholar]
- Chassin L, Beltran I, Lee MR, Haller M, Bountress K. Familial Factors Influencing Offspring Substance Use and Dependence. In: Sher K, editor. Oxford Handbook of Substance Use Disorders. Oxford, UK: Oxford University Press; (in press) [Google Scholar]
- Chassin L, Flora DB, King KM. Trajectories of alcohol and drug use and dependence from adolescence to adulthood: The effects of familial alcoholism and personality. Journal of Abnormal Psychology. 2004;113:483–498. doi: 10.1037/0021-843X.113.4.483. [DOI] [PubMed] [Google Scholar]
- Chassin L, Lee MR, Cho YI, Wang F, Agrawal A, Sher KJ, Lynskey MT. Testing Multiple Levels of Influence in the Intergenerational Transmission of Alcohol Disorders from a Developmental Perspective: The Example of Alcohol Use-Promoting Peers and Mu-Opioid Receptor (OPRM1) Variation. Development and Psychopathology. doi: 10.1017/S0954579412000478. (in press) [DOI] [PMC free article] [PubMed] [Google Scholar]
- Chassin L, Pitts S, DeLucia C, Todd M. A longitudinal study of children of alcoholics: Predicting young adult substance use disorders, anxiety, and depression. Journal of Abnormal Psychology. 1999;108:106–119. doi: 10.1037/0021-843X.108.1.106. [DOI] [PubMed] [Google Scholar]
- Chassin L, Rogosch F, Barrera M. Substance use and symptomatology among adolescent children of alcoholics. Journal of Abnormal Psychology. 1991;100:449–463. doi: 10.1037/0021-843X.100.4.449. [DOI] [PubMed] [Google Scholar]
- Chen K, Kandel D. The natural history of drug use from adolescence to the mid-thirties in a general population sample. American Journal of Public Health. 1995;85:41–47. doi: 10.2105/AJPH.85.1.41. [DOI] [PMC free article] [PubMed] [Google Scholar]
- Cohen J. A power primer. Psychological Bulletin. 1992;112:155–159. doi: 10.1037/0033-2909.112.1.155. [DOI] [PubMed] [Google Scholar]
- Collins LM, Fidler PL, Wugalter SE, Long JD. Goodness-of-fit testing for latent class models. Multivariate Behavioral Research. 1993;28(3):375–389. doi: 10.1207/s15327906mbr2803_4. [DOI] [PubMed] [Google Scholar]
- DeLucia C, Belz A, Chassin L. Do adolescent symptomatology and family environment vary over time with fluctuations in paternal alcohol impairment? Developmental Psychology. 2001;37(2):207–216. doi: 10.1037/0012-1649.37.2.207. [DOI] [PubMed] [Google Scholar]
- Endicott J, Anderson N, Spitzer RL. Family History Diagnostic Criteria. New York, NY: New York Biometrics Research, New York Psychiatric Institute; 1975. [Google Scholar]
- Finney JW. Regression to the mean in substance use disorder treatment research. Addiction. 2008;103(1):42–52. doi: 10.1111/j.1360-0443.2007.02032.x. [DOI] [PubMed] [Google Scholar]
- Gotham HJ, Sher KJ, Wood PK. Alcohol involvement and developmental task completion during young adulthood. Journal of Studies on Alcohol. 2003;64(1):32–42. doi: 10.15288/jsa.2003.64.32. [DOI] [PubMed] [Google Scholar]
- Haller MM, Chassin L. The reciprocal influences of perceived risk for alcoholism and alcohol use over time: Evidence for aversive transmission of parental alcoholism. Journal of Studies on Alcohol and Drugs. 2010;71(4):588–596. doi: 10.15288/jsad.2010.71.588. [DOI] [PMC free article] [PubMed] [Google Scholar]
- Harford TC, Grant BF, Yi H, Chen CM. Patterns of DSM-IV alcohol abuse and dependence criteria among adolescents and adults: Results from the 2001 national household survey on drug abuse. Alcoholism: Clinical and Experimental Research. 2005;29:810–828. doi: 10.1097/01.ALC.0000164381.67723.76. [DOI] [PubMed] [Google Scholar]
- Helzer JE, Pryzbeck TR. The co-occurrence of alcoholism with other psychiatric disorders in the general population and its impact on treatment. Journal of Studies on Alcohol. 1988;49:219–224. doi: 10.15288/jsa.1988.49.219. [DOI] [PubMed] [Google Scholar]
- Holm S. A simple sequentially rejective multiple test procedure. Scandinavian Journal of Statistics. 1979;6(2):65–70. [Google Scholar]
- Hussong AM, Cai L, Curran PJ, Flora DB, Chassin LA, Zucker RA. Disaggregating the distal, proximal, and time-varying effects of parent alcoholism on childrens internalizing symptoms. Journal of Abnormal Child Psychology. 2008;36(3):335–346. doi: 10.1007/s10802-007-9181-9. [DOI] [PMC free article] [PubMed] [Google Scholar]
- Jackson KM, O’Neill SE, Sher KJ. Characterizing alcohol dependence: Transitions during young and middle adulthood. Experimental and Clinical Psychopharmacology. 2006;14:228–244. doi: 10.1037/1064-1297.14.2.228. [DOI] [PMC free article] [PubMed] [Google Scholar]
- Jackson KM, Sher KJ. Similarities and differences of longitudinal phenotypes across alternate indices of alcohol involvement: A methodologic comparison of trajectory approaches. Psychology of Addictive Behaviors. 2005;19:339–351. doi: 10.1037/0893-164X.19.4.339. [DOI] [PMC free article] [PubMed] [Google Scholar]
- Jackson KM, Sher KJ, Gotham HJ, Wood PK. Transitioning into and out of large-effect drinking in young adulthood. Journal of Abnormal Psychology. 2001;110:378–391. doi: 10.1037/0021-843X.110.3.378. [DOI] [PubMed] [Google Scholar]
- Jackson KM, Sher KJ, Wood PK. Trajectories of concurrent substance use disorders: A developmental, typological approach to comorbidity. Alcoholism: Clinical and Experimental Research. 2000;24:902–913. doi: 10.1111/j.1530-0277.2000.tb02072.x. [DOI] [PubMed] [Google Scholar]
- Johnston LD, O’Malley PM, Bachman JG, Schulenberg JE. NIH Publication No. 07-6205. Bethesda, MD: National Institute on Drug Abuse; 2007a. Monitoring the Future national survey results on drug use, 1975–2006: Volume I, Secondary school students. [Google Scholar]
- Johnston LD, O’Malley PM, Bachman JG, Schulenberg JE. NIH Publication No. 07-6206. Bethesda, MD: National Institute on Drug Abuse; 2007b. Monitoring the Future national survey results on drug use, 1975–2006: Volume II, College students and adults ages 19–45. [Google Scholar]
- Kendler KS, Schmitt JE, Aggen SH, Prescott CA. Genetic and environmental influences on alcohol, caffeine, cannabis, and nicotine use from early adolescence to middle adulthood. Archives of General Psychiatry. 2008;65:674–682. doi: 10.1001/archpsyc.65.6.674. [DOI] [PMC free article] [PubMed] [Google Scholar]
- Langeheine R, Pannekoek J, van de Pol F. Bootstrapping goodness-of-fit measures in categorical data analysis. Sociological Methods & Research. 1996;24:249–264. doi: 10.1177/0049124196024004004. [DOI] [Google Scholar]
- Lanza ST, Collins LM. A new SAS procedure for latent transition analysis: transitions in dating and sexual risk behavior. Developmental Psychology. 2008;44:446–456. doi: 10.1037/0012-1649.44.2.446. [DOI] [PMC free article] [PubMed] [Google Scholar]
- Lee MR, Chassin L, MacKinnon D. The effect of marriage on young adult heavy drinking and its mediators: Results from two methods of adjusting for selection into marriage. Psychology of Addictive Behaviors. 2010;24(4):712–718. doi: 10.1037/a0020983. [DOI] [PMC free article] [PubMed] [Google Scholar]
- Littlefield AK, Sher KJ, Wood PK. Is “maturing out” of problematic alcohol involvement related to personality change? Journal of Abnormal Psychology. 2009;118(2):360–374. doi: 10.1037/a0015125. [DOI] [PMC free article] [PubMed] [Google Scholar]
- Marmorstein NR. Longitudinal associations between alcohol problems and depressive symptoms: Early adolescence through early adulthood. Alcohol Clinical Experimental Research. 2009;33:49–59. doi: 10.1111/j.1530-0277.2008.00810.x. [DOI] [PMC free article] [PubMed] [Google Scholar]
- Masten AS, Faden VB, Zucker RA, Spear LP. Underage drinking: A developmental framework. Pediatrics. 2008;121(Suppl4):S235–S251. doi: 10.1542/peds.2007-2243A. [DOI] [PubMed] [Google Scholar]
- McDonald RA, Seifert CF, Lorenzet SJ, Givens S, Jaccard J. The effectiveness of methods for analyzing multivariate factorial data. Organizational Research Methods. 2002;5(3):255–274. doi: 10.1177/10928102005003004. [DOI] [Google Scholar]
- Miller WR, Rollnick S. Motivational interviewing: Preparing people for change. 2. New York: Guilford Press; 2002. [Google Scholar]
- Muthén LK, Muthén BO. Mplus User’s Guide. Fifth Edition. Los Angeles, CA: Muthén & Muthén; 1998–2007. [Google Scholar]
- Muthén B, Satorra A. Complex sample data in structural equation modeling. Sociological Methodology. 1995;25:267–316. [Google Scholar]
- Nylund K, Asparouhov T, Muthén B. Deciding on the number of classes in latent class analysis and growth mixture modeling: A Monte Carlo simulation study. Structural Equation Modeling: An Interdisciplinary Journal. 2007;14:535–569. doi: 10.1080/10705510701575396. [DOI] [Google Scholar]
- O’Neill SE, Parra GR, Sher KJ. Clinical relevance of heavy drinking during the college years: Cross-sectional and prospective perspectives. Psychology of Addictive Behaviors. Special Issue: Understanding binge drinking. 2001;15(4):350–359. doi: 10.1037/0893-164X.15.4.350. [DOI] [PubMed] [Google Scholar]
- Roberts WR, Walton KE, Viechtbauer W. Patterns of mean-level change in personality traits across the life course: A metaanalysis of longitudinal studies. Psychological Bulletin. 2006;132:1–25. doi: 10.1037/0033-2909.132.1.. [DOI] [PubMed] [Google Scholar]
- Robins LN, Helzer JE, Croughan JL, Ratcliff KS. National institute of mental health diagnostic interview schedule: Its history, characteristics, and validity. Archives of General Psychiatry. 1981;38:381–389. doi: 10.1001/archpsyc.1981.01780290015001. [DOI] [PubMed] [Google Scholar]
- Robins LN, Helzer JE, Ratcliff KS, Seyfried W. Validity of the Diagnostic Interview Schedule, Version II: DSM-IIl diagnoses. Psychological Medicine. 1982;12:855–870. doi: 10.1017/s0033291700049151. [DOI] [PubMed] [Google Scholar]
- Schulenberg J, Maggs JL, Long SW, Sher KJ, Gotham HJ, Baer JS, Kivlahan DR, Marlatt GA, Zucker RA. The problem of college drinking: Insights from a developmental perspective. Alcoholism: Clinical and Experimental Research. 2001;25(3):473–477. doi: 10.1111/j.1530-0277.2001.tb02237.x. [DOI] [PubMed] [Google Scholar]
- Schulenberg J, Wadsworth KN, O’Malley PM, Bachman JG, Johnston LD. Adolescent risk factors for binge drinking during the transition to young adulthood: Variable- and pattern-centered approaches to change. Developmental Psychology. 1996;32:659–674. doi: 10.1037/0012-1649.32.4.659. [DOI] [Google Scholar]
- Schwartz G. Estimating the dimension of a model. Annals of Statistics. 1978;6:461–464. doi: 10.1214/aos/1176344136. [DOI] [Google Scholar]
- Sher KJ, Gotham HJ. Pathological alcohol involvement: A developmental disorder of young adulthood. Development & Psychopathology. 1999;11:933–956. doi: 10.1017/S0954579499002394. [DOI] [PubMed] [Google Scholar]
- Staff J, Schulenberg JE, Maslowsky J, Bachman JG, O’Malley PM, Maggs JL, Johnston LD. Substance use changes and social role transitions: Proximal developmental effects on ongoing trajectories from late adolescence through early adulthood. Development and Psychopathology. Special Issue: Developmental Cascades: Part 2. 2010;22(4):917–932. doi: 10.1017/S0954579410000544. [DOI] [PMC free article] [PubMed] [Google Scholar]
- Steinberg L. Risk taking in adolescence: New perspectives from brain and behavioral science. Current Directions in Psychological Science. 2007;16(2):55–59. doi: 10.1111/j.1467-8721.2007.00475.x. [DOI] [Google Scholar]
- Tanner JL, Reinherz HZ, Beardslee WR, Fitzmaurice GM, Leis JA, Berger SR. Change in prevalence of psychiatric disorders from ages 21 to 30 in a community sample. The Journal of Nervous and Mental Disease. 2007;195:298–306. doi: 10.1097/01.nmd.0000261952.13887.6e. [DOI] [PubMed] [Google Scholar]
- Trim RS, Chassin L. Drinking restraint, alcohol consumption and alcohol dependence among children of alcoholics. Journal of Studies on Alcohol. 2004;65(1):122–125. doi: 10.15288/jsa.2004.65.122. [DOI] [PubMed] [Google Scholar]
- Warner LA, White HR, Johnson V. Alcohol initiation experiences and family history of alcoholism as predictors of problem-drinking trajectories. Journal of Studies on Alcohol and Drugs. 2007;68:56–65. doi: 10.15288/jsad.2007.68.56. [DOI] [PubMed] [Google Scholar]
- Wechsler H, Lee JE, Kuo M, Lee H. College binge drinking in the 1990s: A continuing problem: Results of the harvard school of public health 1999 college alcohol study. Journal of American College Health. 2000;48(5):199–210. doi: 10.1080/07448480009599305. [DOI] [PubMed] [Google Scholar]
- Wells JE, Horwood LJ, Fergusson DM. Stability and instability in alcohol diagnosis from ages 18 to 21 and ages 21 to 25 years. Drug and Alcohol Dependence. 2006;81:157–165. doi: 10.1016/j.drugalcdep.2005.06.006. [DOI] [PubMed] [Google Scholar]
- Yamaguchi K, Kandel DB. On the resolution of role incompatibility: A life event history analysis of family roles and marijuana use. American Journal of Sociology. 1985;90(6):1284–1325. doi: 10.1086/228211z. [DOI] [Google Scholar]