Abstract
A state of matter in which molecules show a long-range orientational order and no positional order is called a nematic liquid crystal. The best known and most widely used (for example, in modern displays) is the uniaxial nematic, with the rod-like molecules aligned along a single axis, called the director. When the molecules are chiral, the director twists in space, drawing a right-angle helicoid and remaining perpendicular to the helix axis; the structure is called a chiral nematic. Here using transmission electron and optical microscopy, we experimentally demonstrate a new nematic order, formed by achiral molecules, in which the director follows an oblique helicoid, maintaining a constant oblique angle with the helix axis and experiencing twist and bend. The oblique helicoids have a nanoscale pitch. The new twist-bend nematic represents a structural link between the uniaxial nematic (no tilt) and a chiral nematic (helicoids with right-angle tilt).
 Theories predict the existence of a nematic liquid crystal phase with a local twist-bend structure, but no experimental proof is available over the past 40 years. Borshch et al. identify this phase for the first time in two different materials containing dimeric molecules.
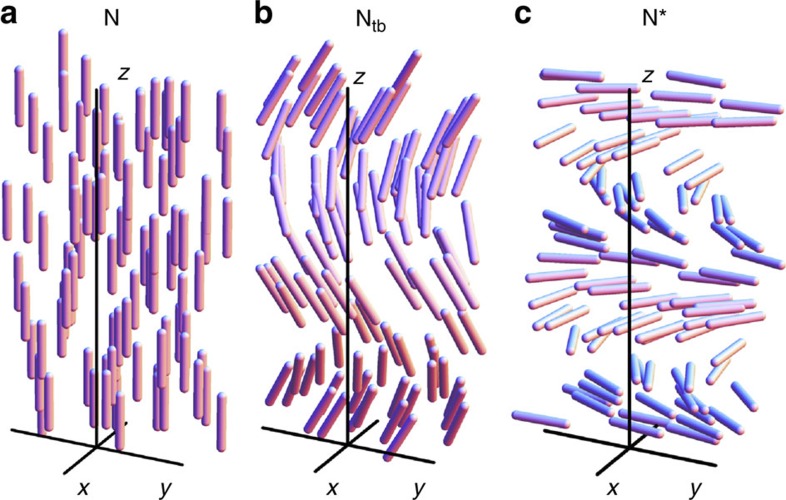
Nematic liquid crystals with fluid-like arrangements of molecules that pack parallel to each other are widely used in display and other applications because of the unique combination of orientational order and fluidity. In the uniaxial nematic (N) phase, rod-like molecules are on average parallel to the single director  , but their centres of mass are arranged randomly, as in an isotropic fluid (Fig. 1a). The director is a nonpolar entity,
  , even if the molecules have dipole moments. Chiral molecules prefer to twist with respect to each other, forcing
  to follow a right-angle helicoid, either left-handed or right-handed (Fig. 1c). In 1973, Meyer1 predicted that polar molecular interactions that favour bend deformations might lead to a twist-bend nematic (Ntb) phase, in which the director draws an oblique helicoid, maintaining a constant oblique angle 0<θ0<π/2 with the helix axis z:
Figure 1. Schematics of local director arrangements in nematics.
(a) Nematic N phase, uniaxial alignment, θ0=0, (b) Ntb, with oblique helicoid 0<θ0<π/2 and (c) chiral nematic N* phase, right helicoid, θ0<π/2 (the twist is right-handed or left-handed, depending on molecular chirality.
 |
here  is the azimuthal angle,
  ,
,  is the pitch of the helicoid (Fig. 1b). Note that equation (1) describes also N (when
  ) and N* (when
  ) phases (Fig. 1). Unlike the case of N*, formation of Ntb does not require molecular chirality; thus one should expect it to contain coexisting domains of left and right chirality2. Instead of chirality, Ntb can be facilitated by bent (banana-like) shapes of molecules, as was demonstrated analytically by Dozov2 and Shamid et al.3, and in molecular simulations by Memmer4. A similar structure, but with the hexatic order coupled to twist-bend deformation, has been predicted by Kamien5.
Experimentally, no Ntb phase was reported for the bent-core materials6. Instead, some unusual behaviour, including a first-order phase transition between two seemingly uniaxial N phases, was detected in materials formed by polymer7,8 and dimer molecules9,10,11,12,13,14,15,16,17,18,19,20 in which rigid cores are connected by a flexible aliphatic tail with an odd number of methylene groups. Although the high-temperature phase was easily identifiable as a standard uniaxial N phase, the nature of the low-temperature phase (often denoted Nx) remains a subject of intensive exploration, revealing hints that are consistent with the Ntb structure. For example, X-ray diffraction (XRD) shows no periodic variation of the electronic density in the low-temperature phase11,14, suggesting that the molecular centres of mass are distributed randomly in space; this excludes the smectic type of order. On the other hand, the optical textures show features such as focal conic domains14,20. As demonstrated by Friedel21 in 1922, focal conics appear in liquid crystals with one-dimensional positional order. This order can be caused by periodically changing density, as in smectics, or by ‘wave surfaces’ of the director twist, as in N*, with no density modulation22. Focal conics should be expected14 in Ntb, as  is fixed by the molecular interactions that favour twist-bend packing. Unlike the case of N*, in which the large pitch makes it possible to trace the helicoidal packing optically, no such clear evidence was presented so far for the Ntb candidates. Macroscopic stripes with a period in the range of 1–100 μm often observed in dimer materials10,11,14 do not represent a thermodynamically stable state, as the period depends strongly on the cell thickness11. Recently, Clark’s group established by freeze-fracture transmission electron microscopy (FFTEM) a periodic director modulation in the Ntb phase of cyanobiphenyl material M1 (Fig. 2a)19; the period of 8 nm was not associated with the smectic periodicity. Another important feature, a structural chirality of M1 at the short timescales of nuclear magnetic resonance response, was demonstrated by Beguin et al.15
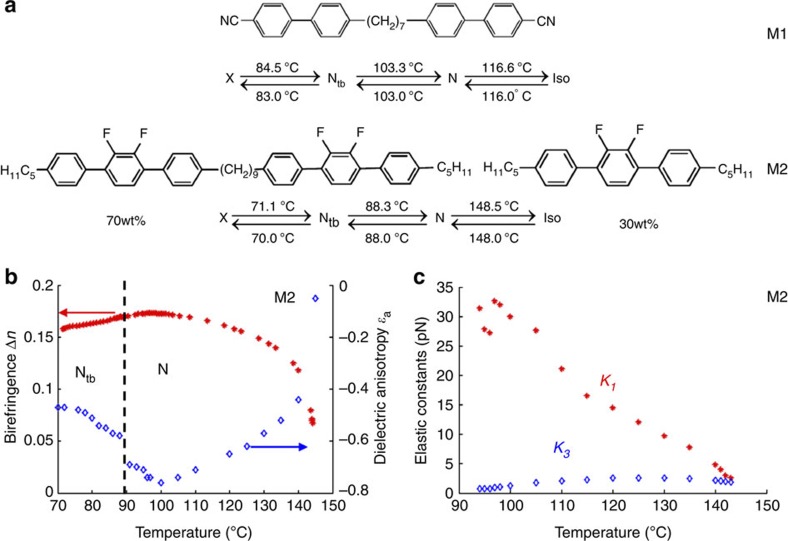
Figure 2. Properties of Ntb materials.
(a) Structural formulae and phase diagrams of M1 and M2. (b) Temperature dependence of birefringence and dielectric anisotropy of M2. (c) Temperature dependence of K1 and K3 for M2.
In this work, we present the result of a comprehensive experimental exploration of the N states in two different families of dimeric materials. The main result is that in addition to the N phase, both classes feature an Ntb phase with the local director (defined as the average orientation of the dimeric arms) shaped as an oblique helicoid (Fig. 1b). The oblique helicoidal structure of Ntb is evidenced by FFTEM textures of Bouligand arches23 of two distinct types. The local director is modulated along the helicoidal axis with a period of about 8–9 nm, which is 2–3 orders of magnitude shorter than typically found in the chiral N* phase. The tendency of the molecules to form local bend-twist configurations as a condition of the N–Ntb transition is confirmed by the temperature dependence of the bend modulus  measured in the N phase:
  decreases near the transition into the Ntb phase to the anomalously low levels. Electro-optic response in an alternating current (AC) electric field shows that the field-induced reorientation of Ntb allows splay and saddle-splay of the optic axis but not bend nor twist; as a result, the bend Frederiks transition is dramatically different in the two phases. The effect is a natural consequence of the equidistance of layers,
  .
.
Results
Materials
The studied materials M1 and M2 are shown in Fig. 2a. M1 material, 1″,7″-bis(4-cyanobiphenyl-4′-yl)heptane (CB7CB), was synthesized as described in ref. 24. The dimer has a longitudinal dipole moment at each arm. M1 shows a positive dielectric anisotropy  in the N phase (the subscripts indicate directions parallel to
  and perpendicular to it). M2 is a mixture, of a dimer 1,5-Bis(2′,3′-difluoro-4″-pentyl-[1,1′:4′,1″-terphenyl]-4-yl)nonane (DTC5C9) (for synthesis, see Supplementary Methods and Supplementary Fig. S4) and a monomer 2′,3′-difluoro-4,4″-dipentyl-p-terphenyl (MCT5; added to improve alignment, reduce viscosity and working temperatures); weight proportion is DTC5C9 (70 wt%):MCT5 (30%). The dielectric anisotropy of M2 is negative,
  , which allows us to illustrate a dramatic difference of elastic properties and dielectric response of N and Ntb by exploring the bend Frederiks transition22 between the homeotropic and distorted state of the optic axis in both phases.
DTC5C9. 1,5-Bis(2',3'-difluoro-4''-pentyl-[1,1':4',1''-terphenyl]-4-yl)nonane.
Molecular Weight: 797.06
Elemental Analysis: C, 82.88; H, 7.59; F, 9.53
Standard InChI: InChI=1S/C55H60F4/c1-3-5-12-16-40-20-28-44(29-21-40)48-36-38-50(54(58)52(48)56)46-32-24-42(25-33-46)18-14-10-8-7-9-11-15-19-43-26-34-47(35-27-43)51-39-37-49(53(57)55(51)59)45-30-22-41(23-31-45)17-13-6-4-2/h20-39H,3-19H2,1-2H3
Standard InChIKey: QTYUBWFTESMMLW-UHFFFAOYSA-N
SMILES: FC1=C(F)C(C2=CC=C(CCCCCCCCCC3=CC=C(C4=CC=C(C5=CC=C(CCCCC)C=C5)C(F)=C4F)C=C3)C=C2)=CC=C1C(C=C6)=CC=C6CCCCC
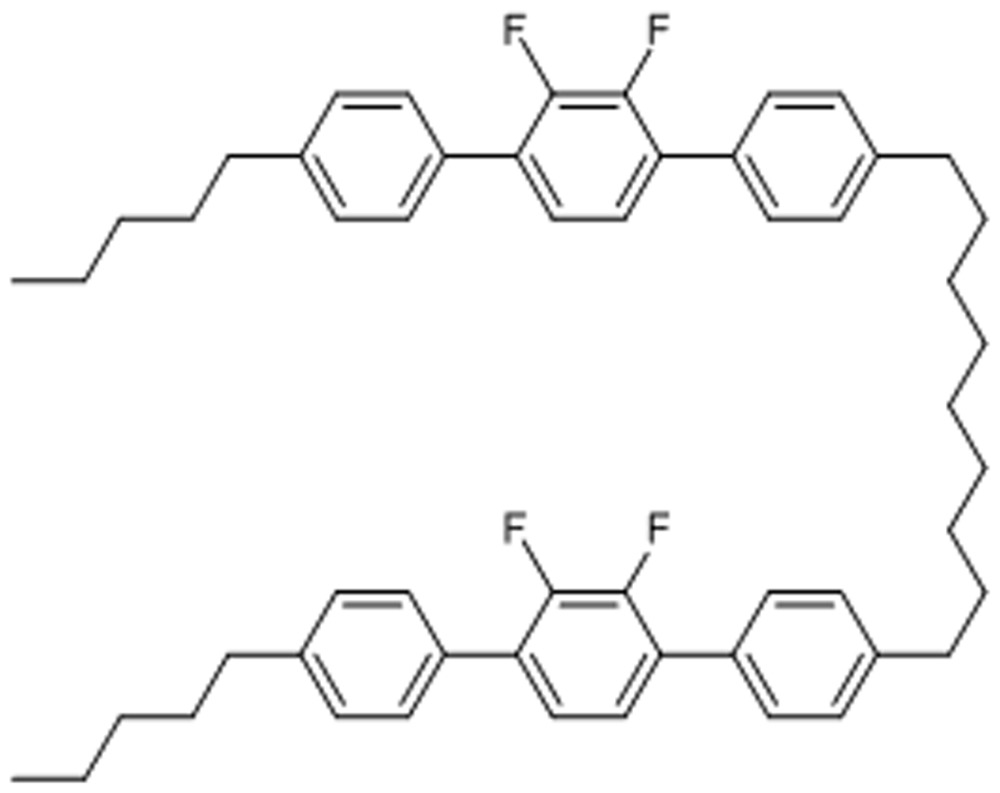
Chemical Formula: C55H60F4
Optical textures and birefringence
M1 and M2 show a similar phase diagram: a uniaxial N at high temperatures  and a different phase Ntb at lower
  . In cells with homeotropic alignment (achieved by an inorganic passivation layer NHC AT720-A (Nissan Chemical Industries, Ltd.), the N texture observed between two crossed polarizers is uniformly dark, as it should be, as the optic axis
  is along the direction of observation. In the Ntb state, the texture remains dark, that is, the material remains optically uniaxial.
In planar cells (aligned by rubbed polyimide PI2555 films (HD Microsystems)), the phase transition N–Ntb on the temperature decrease in both M1 and M2 is evidenced by a propagating front after which a texture of stripes is established. These range from faint stripes of sub-micrometre scale to macroscopic stripes, 10–100 μm wide. These stripes are not thermodynamically stable. By applying an AC electric field of a frequency 10 kHz (parallel to  in M1 and perpendicular to
  in M2), we eliminate the stripes to achieve an optically homogeneous state. If the field is removed and the temperature is fixed or raised, the stripe pattern does not reappear. These uniform states were used to determine birefringence
  in both phases (Fig. 2b). Equation (1) predicts that
  decreases in the Ntb phase, by a factor
 ; see Methods. For M2, the decrease of
  is about 7% from its maximum value in the N phase, which allows us to estimate the tilt as
  17° at 79 °C. If the temperature of the homogeneous sample is reduced, the stripes typically reappear. This behaviour is consistent with a Helfrich–Hurault undulation (buckling) instability observed in smectics and N*, and is caused by the temperature-induced decrease in layers periodicity (pitch)22. We conclude that the true layered nature of Ntb must be associated with (optically) invisible submicron features.
Elastic constants in N phase
Uniform planar and homeotropic alignment was used to determine the elastic constants of M2 by the Frederiks effect, that is, material reorientation by an applied 10 kHz electric field (for the elastic constants of a similar material, see ref. 25). When the field is parallel to  in the homeotropic N cell,
  starts to tilt above some threshold voltage26
 , which yields the value of
  , as
, as  is known (Fig. 2b). The splay constant
  is determined by the threshold fields of realignment in planar cells27. Behaviour of
  is typical for N materials, whereas that of
  is not, as
  decreases to a very low value 0.77 pN as the temperature is lowered towards the N–Ntb transition (Fig. 2c); similarly, small
  was recently measured for a mixture of dimers20.
Dielectric reorientation of optic axis in N and Ntb
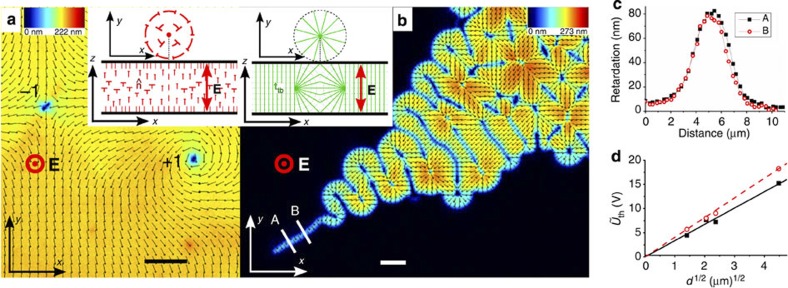
The homeotropic cells of M2 with a vertical AC field allow us to trace an important difference in the Frederiks reorientation of the N and Ntb phases. In the N phase, (Fig. 3a) once U>Uth, the optic axis realigns gradually and everywhere, as in the second-order transition. As the tilt direction is degenerate, it results in umbilics, that is, defects of winding numbers −1 and +1 (ref. 28). The +1 umbilics show an in-plane bend of  , which is expected, as K3<<K1 . The same experiment in Ntb reveals a completely different scenario. Reorientation of the optic axis starts only at isolated sites of the sample, associated with dust particles or surface irregularities. The nucleating regions in the shape of axisymmetric focal conic domains29 coexist with the homeotropic surrounding (inset in Fig. 3b); they expand if the voltage is higher than some threshold
  . The deformations of the optic axis are of splay and saddle-splay type (Fig. 3b).
Figure 3. Dielectric reorientation of the optic axis in the plane of homeotropic M2 cells.
(a) PolScope texture of bend Frederiks transition in the N phase, showing the local optic axis projected onto the cell’s plane (black bars) and the local optical retardation of the cell (pseudocolors). Scale bar, 10 μm. Inset shows bend-twist of the director (red symbols; nails depict titled director). (b) PolScope texture of bend Frederiks transition in the Ntb phase showing only splay and saddle-splay deformations of the optic axis. The inset shows the initial nucleating site in the shape of an axially symmetric toroidal focal conic domain29 with green lines following the optic axis. Scale bar, 10 μm. (c) Optical retardation of the realigned Ntb structure measured along the lines A and B shown in b. (d) Threshold voltage of expansion of a realigned Ntb versus cell thickness d, for T=87 °C (filled symbols) and T=86 °C (open symbols).
The profile of optical retardation measured across the domain of reoriented Ntb reaches a maximum at the centre of the domain (Fig. 3c), indicating that the tilt of the optic axis is at a maximum in the centre. Thus, the pattern is similar to the field-induced reorientation in smectic A (ref. 29) and N* (ref. 30) phases with  , in which the layers’ equidistance allows splay and saddle-splay, but prohibits bend and twist of the layers’ normal. The threshold voltage
  of expansion in layered liquid crystals is determined mostly by the balance of surface anchoring at the plates and the dielectric reorienting torque, so that29,30
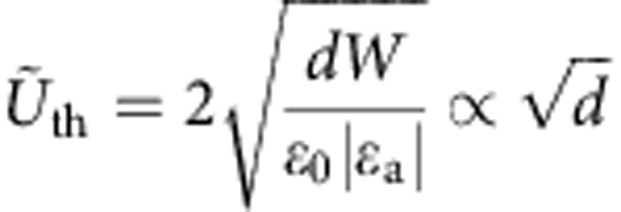 , where
  is the surface anchoring strength and
  is the cell thickness; the dependence
  agrees with the experiment (Fig. 3d). In the N phase, the Frederiks voltage threshold does not depend on
  . The peculiar character of the dielectric response provides another argument in favour of periodic nature of Ntb at the scales much shorter than the visible scales.
Nanoscale periodic arrangement of molecular orientation
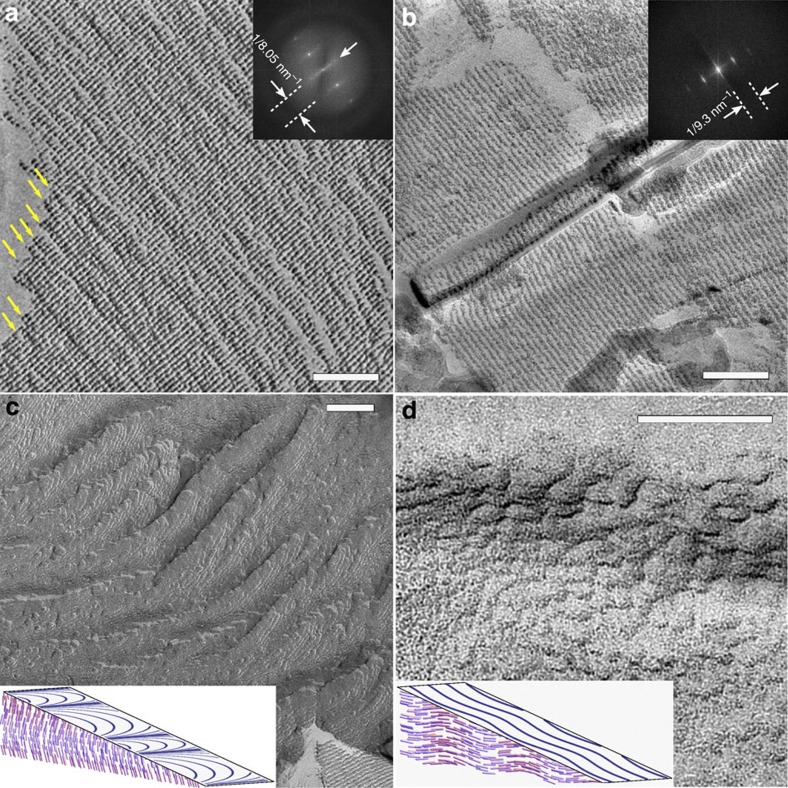
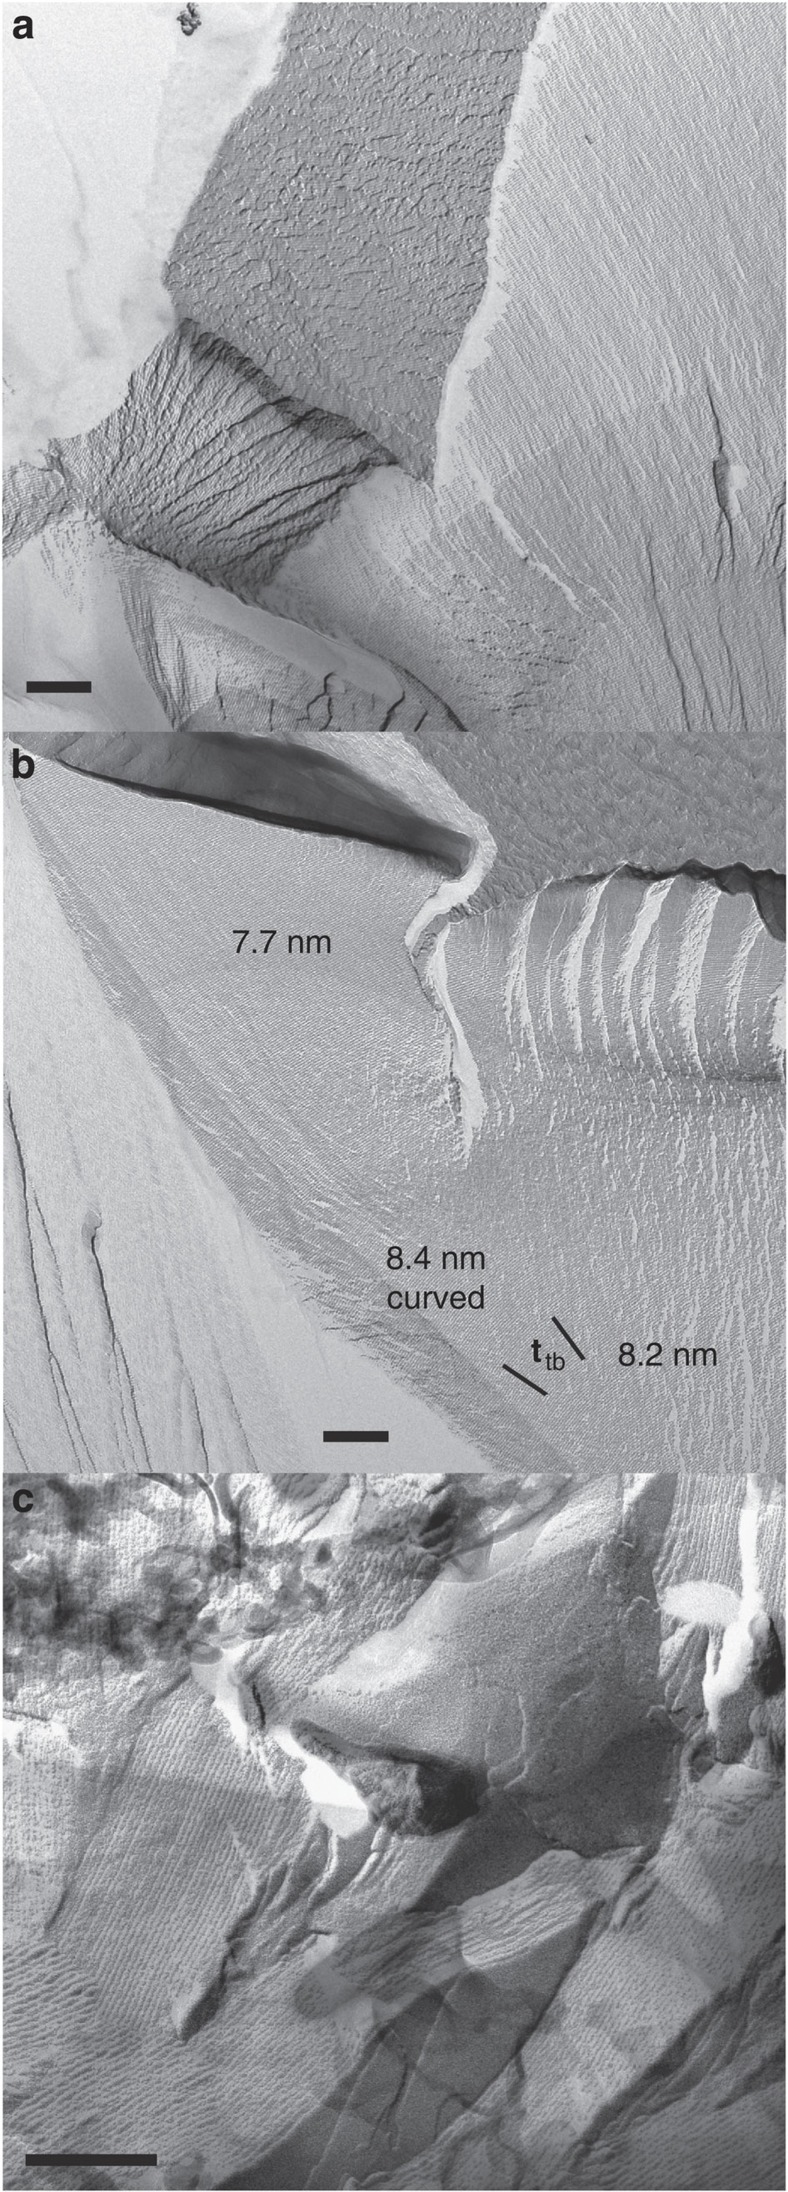
The layered structure of Ntb phase is clearly evidenced in FFTEM images of Pt/C replicas of fractured M1 (Fig. 4a, Fig. 5a,b) and M2 (Fig. 4b, Fig. 5c). Most of them show a one-dimensional layered structure with a period ~8–9 nm, corresponding to the pitch  of director deformations, in agreement with the findings by Chen et al.19 for M1. In M1, the regularly observed value of
  is 8.05 nm (Fig. 4a), whereas in M2,
  =9.3 nm (Fig. 4b). Frequent observation of layers that are perpendicular to the fracture plane (Fig. 4a,b) correlates with the theoretical predictions and experiments31 on freeze-fractured N and N*, in which the fracture plane tends to be parallel to
  , as it minimizes the density of molecules in the cut surface. In the Ntb phase, the surface with the minimum molecular density is not flat, but modulated with a period
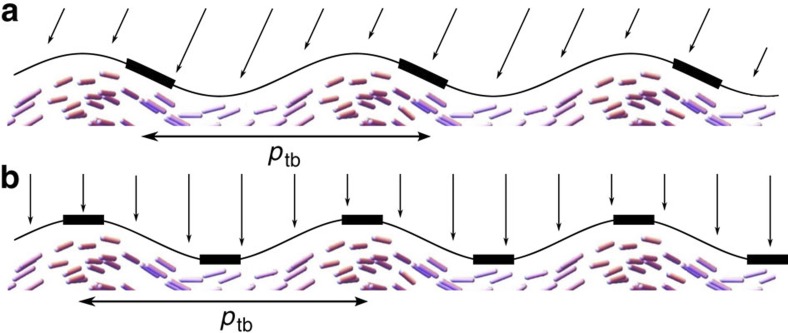
  . This leads to a shadowing effect and explains why oblique deposition of the Pt/C film yields the period
  (Fig. 6a). On rare occasions, FFTEM textures of M1 exhibit rather unusual patterns with a period smaller than 8 nm, for example, 7.7 nm (Fig. 5b), 7.4, 4.8 and 3.4 nm (Supplementary Fig. S1). It is unlikely that all of these small periods can be explained by absence of shadowing effect when the oblique deposition direction happens to be perpendicular to the wave vector
  of the Ntb helix (Fig. 6b). Most likely, these small periods are associated with packing of different conformers that are known32 to exist in dimer materials similar to M1 and M2. The energy difference between the conformers is very small32; thus, some of them might form twist-bend structures with the period different from
  =8–9 nm of the prevailing conformer.
Figure 4. FFTEM textures of Ntb with uniform and arched structures.
(a,b) FFTEM textures and corresponding fast Fourier transform (FFT) patterns of (a) M1 with pitch ptb=8.05 nm and (b) M2 with ptb=9.3 nm, viewed in the planes parallel to the optic axis. The arrows in a point towards domain boundaries of average extension 26 nm, which are roughly perpendicular to the Ntb layers. Presence of domains is also revealed by a diffuse intensity pattern in FFT, marked by a white arrow in a. (c,d) FFTEM image of Bouligand arches in M1 formed as imprints of the oblique helicoidal structure onto the fracture plane that is (c) almost perpendicular and (d) almost parallel to the helicoid axis of Ntb. The insets show the corresponding schemes of Bouligand arches of two types in Ntb, calculated for (c) θ0=17°, ψ=5° and (d) θ0=20°, ψ=57°. Scale bars, 100 nm.
Figure 5. FFTEM textures of non-uniform Ntb samples.
(a) M1 (CB7CB) quenched at 95 °C, showing layered structures of different orientations. The period of most domains varies between 8.0 and 8.2 nm. (b) M1 with splay distortions of the helix axis and atypical periodicity of 7.7 nm. Enlarged portions of the texture are displayed in Supplementary Figs S1 and S2. (c) M2, exhibiting domains with layered structure oriented along different directions. The period of the layered structure varies between 8.6 and 10.3 nm. Scale bar, 200 nm (in all images).
Figure 6. Scheme of oblique deposition onto the fracture surface of Ntb.
(a) General case, the fracture surface corresponds to minimum density of molecules; period of replica ptb; (b) hypothetical limiting case, period of replica is two times smaller than the helix pitch; deposition direction is orthogonal to the wave vector of the helix.
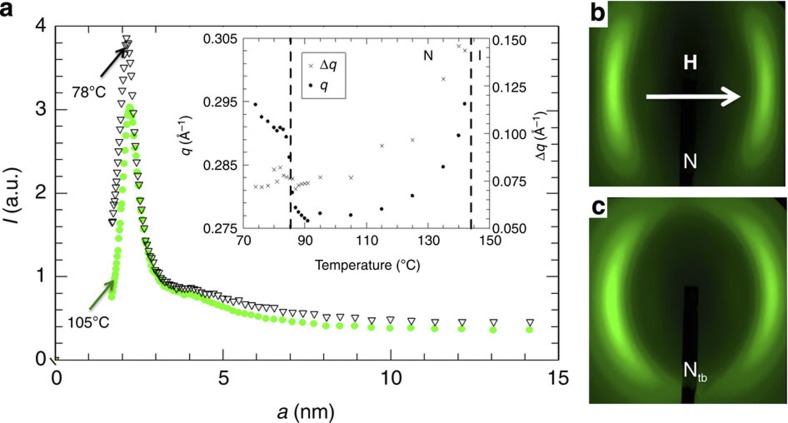
Our XRD study shows that the pitch of 8–9 nm of the Ntb phase in M2 is not associated with the smectic-like modulations, as the intensity of X-ray scattering is featureless in the range 5–14 nm (Fig. 7a). Smaller repeat distances of ~2.2 nm are observed in both N and Ntb phases, but the correlation length of these is relatively small, up to 9 nm (Fig. 7a), indicating that the long-range structure of both N and Ntb is nematic (Fig. 7b,c) rather than smectic like. One should not exclude the possibility of cybotactic clusters, embedded into the Ntb phase. Recently, Meyer et al.18 explored the flexoelectric effect in M1 and suggested that its features are consistent with an oblique helicoidal structure with ptb=7 nm, if one assumes standard values of the flexoelectric coefficients. This estimate is very close to the periodicities directly seen in Figs 4a,b and 5 and Supplementary Figs S1 and S2.
Figure 7. XRD results for M2 in the N and Ntb phases.
(a) Typical dependence of diffraction intensity versus wave vector q, presented in terms of the length scale a; inset shows the temperature dependences of q and Δq, the full width at half maximum of scattered intensity; (b) two-dimensional scattering pattern for the N phase; (c) two-dimensional scattering pattern for the Ntb phase.
Oblique helicoidal geometry of director
The second important type of FFTEM textures is that one of periodic arches (Fig. 4c,d). These arches are very different from the celebrated Bouligand arches23 of the cholesteric N* liquid crystals. In N*, each arch corresponds to a rotation of  by
by  and any two adjacent arches are indistinguishable from each other, as should be for a right-angle helicoid. In the Ntb phase, the geometry is very different (Figs 4c,d and 8), as the underlying structure is an oblique helicoid rather than a right-angle helicoid. Little is known that in the appendix of the original paper23, in addition to the N* arches, Bouligand et al.23 also considered asymmetric arches for a hypothetical fractured system of oblique helicoids. We extend his approach to the specific case of equation (1), written for the unit director field. Suppose that the plane of fracture (
 ) is tilted around the axis
  (Fig. 1b) by an angle
  measured between the new axis
  and the original axis
  . The director components in the fracture plane are
  and
and  . The local orientation of the director projection in the obliquely fractured Ntb phase is then given by the equation
Figure 8. Three types of Bouligand arches predicted by equation (2).
(a) Type I, alternating wide and narrow arches, with θ0=0.3, ψ=0.1; (b) type II, θ0=0.3, ψ=0.35; (c) type III, θ0=ψ=0.3.
 |
with the solution
 |
Here  is the shift of one arch with respect to the other. Equation (2) distinguishes three types of the Bouligand arches that should be observed in a material with oblique helicoidal structure: type I for
  (Fig. 8a) with alternating wide and narrow arches, type II for
  , with a wavy structure (Fig. 8b) and intermediate type III, with
  , which is hard to distinguish from the classic symmetric N* arches (Fig. 8c). The type I and II arches, never seen in the chiral nematic N* phase, are readily distinguishable in the textures of the Ntb phase, Fig. 4c-4d, respectively. In type I, inset in Figs 4c and 8a, the director imprint rotates in the entire range (0–2
 ) of azimuthal angles in the fracture plane, but the odd and even arches are of a different width,
  . Type II represents a wavy structure that extends in the direction normal to the helicoidal axis but do not explore the entire range of azimuthal orientations (Figs 4d and 8b, and Supplementary Fig. S3) in contrast to other types of Bouligand arches where the azimuthal reorientation is by
  within each arch. Observation of type I and type II arches provides a clear evidence of the oblique helicoidal structure of the Ntb phase.
Non-uniform textures of Ntb
FFTEM textures show that the Ntb structure is sometimes modulated not only in the direction of helix axis but also along other directions, in particular, in the  plane perpendicular to the helix axis (Figs 4a and 5, Supplementary Figs S1–S3). For example, in Fig. 4a, the periodic arrangements of twist-bend director have a limited width of about 20–30 nm. The domains are separated by structureless boundaries (indicated by yellow arrows in Fig. 4a), with no clear periodicity on the scales of
  , apparently of an N type. The modulation might be caused by defects such as grain boundaries, screw dislocations parallel to the helicoidal axis and by coexistence of left-handed and right-handed twisted domains. Homochiral domains have been indeed observed in electro-optical studies12,17,18, but at a much larger (supramicron) scale. One should expect that the spatial extension of the homochiral domains is determined by the kinetic history of sample preparation, confinement conditions and other factors such as the presence of the electric field12. Further exploration is needed to understand the exact mechanisms behind the modulated structures seen in Fig. 4a. Such a work is in progress.
Besides the domain textures of Ntb with abruptly changing orientation of the helix axes  (Fig. 5a,c), one also observes regions with smooth splay-type reorientation of
  , marked in Fig. 5b. Splay deformation seen in FFTEM textures at the nanoscale is consistent with the idea that the deformed Ntb structure tends to preserve the pitch of helicoid and with the observation of splay and saddle-splay deformations on the optical (micrometre) scales (Fig. 3b). Predominance of splay and saddle-splay in the distorted configurations of
  , combined with the very small (nanometres) period of the oblique helicoidal structure makes the polarizing microscope textures of the Ntb phase very similar to those of the smectic phases.
Discussion
The structural, elastic, optical, dielectric and electro-optical properties of the two different families of dimer compounds clearly demonstrate the existence of the Ntb phase with a local twist-bend structure. The results underscore a complex interplay between the flexible nature of the achiral dimeric molecules with aliphatic chains containing an odd number of methylene groups and their chiral nanoscale organization. The prevailing element of the Ntb order is an oblique helicoid (sometimes also called a conical helicoid; Fig. 1b), formed by the local director, associated with the average orientation of the dimers’ arms. The Ntb structure reveals itself in the unique shape of the Bouligand arches that are either asymmetric (type I, Figs 4c and 8a) or not fully developed in the sense of director rotations in the fracture plane (type II, Figs 4d and 8b, and Supplementary Fig. S3). These two types of arches are different from the classic cholecteric arches that are always symmetric and fully developed23. The type I and II arches were originally proposed by Bouligand et al.23 as a hypothetical imprint of chiral fibrilles in chromosomes of Dinoflagellates but were not observed so far (although a chiral conical phase of helical flagella has been demonstrated by optical microscopy33).
The tranmission electron microscopy (TEM) measurements reveal that the periodic modulations of the director along the helical axis has a very short period, about 8–9 nm for both studied materials M1 and M2. These data compare well with the TEM data by Chen et al.19 and estimates based on electro-optic response18 of M1. Although one does observe a typical period of 8–9 nm, there are also examples of much shorter periodicity, from 7.7 to 3.4 nm. Another aspect of nanostructural organization that deserves further studies is a modulation in the direction more or less perpendicular to the helicoidal axes that can be caused by structural defects such as screw dislocations and by coexisting left- and right-twisted domains.
By exploring the dielectric response, we demonstrated that the classic Frederiks effect in the homeotropic cells is very different when staged in the normal N phase and in the Ntb phase because of the tendency of twist-bend director modulations to keep equidistance. The temperature dependence of the bend modulus and its very low value near the N–Ntb phase transition put a new challenge to our understanding of molecular mechanisms of elastic properties of liquid crystals. A closely related issue is the relationship between the Ntb structure and double-twist structure of the so-called blue phases that are known to be stabilized by the dimeric molecules34. Finally, practically nothing is known about the hydrodynamics of the Ntb phase (apart from the fact that it is much more viscous than its high-temperature N neighbour). Further studies of the Ntb phase promise a dramatic improvement of our understanding of the long-range orientational order, which shows new intriguing facets at the nanoscale.
After this paper has been submitted and reviewed, we learned that a modulated orientation of molecules with a period of 14 nm, consistent with the structure of the Ntb phase, has been observed in the bent-core material by Chen et al.35
Methods
Sample preparation for optical and electro-optical studies
Experimental cells were assembled from parallel glass plates with transparent indium tin oxide electrodes. For planar (tangential) alignment, the substrates were spin coated with polyimide PI2555 (HD MicroSystems); homeotropic alignment was achieved by an inorganic passivation layer NHC AT720-A (Nissan Chemical Industries, Ltd). The temperature was controlled with the Linkam controller TMS94 and a hot stage LTS350 (Linkam Scientific Instruments) with precision 0.01 °C. In all the experiments on dielectric reorientation (Frederiks transitions) of  , we used the AC electric field of frequency 10 kHz. An AC voltage was applied using function generators DS345 Stanford Research System or Keithley 3390. The voltage was amplified by a wide-band amplifier 7602 Krohn–Hite and measured with a Keithley 2000 multimeter. A polarizing microscope OptiPhot2-Pol, Nikon Instruments, Inc. was used for orthoscopic observations. The maps of the in-plane optical axis orientation and phase retardation were obtained by using the Abrio PolScope set-up assembled on the basis of Nikon Eclipse E600 Pol microscope.
Elasticity measurement in the N phase
The cell thickness used in the experiment was 20 μm for the homeotropic cell and 19.9 μm for the planar cell. The cells were filled with the liquid crystal material in the isotropic state and a well-aligned N phase was obtained on cooling. For the dielectric characterization, we used an LCR meter HP4284A (Hewlett Packard) that measures the capacitance of the sample. The effective dielectric permittivity across the homeotropic cell of thickness  was calculated as
  , where
  is the electrode area and
  is the measured capacitance of the cell filled with liquid crystal mixture. The dielectric permittivity parallel to the director,
  , was determined from the capacitance measured at low voltages from the homeotropic cell. The perpendicular component
  was measured using the planar cell.
To determine the bend elastic constant  , we followed the Saupe technique, in which one uses a single homeotropic cell and determines the voltage dependence of its capacitance when the material has a negative dielectric anisotropy. The bend elastic constant is obtained by measuring the Frederiks threshold,
  . The Frederiks transition of homeotropic sample was also triggered by the magnetic field directed perpendicularly to the director. The threshold
  was determined by measuring cell capacitance versus field strength. Using the expression
  , and comparing the bend constant to the value obtained in the electric Frederiks effect, we determined the diamagnetic anisotropy
  . For example,
  at 130 °C.
The elastic constant of splay  was obtained by exploring the Frederiks transition of planar sample in the magnetic field. The magnetic field was set normally to the cell and to the planar director; the director reorientation threshold was monitored by measuring the capacitance. The splay elastic constant is defined as
  .
.
Birefringence
By averaging the tilted director field in equation (1) for  , the effective birefringence of the conical helix in Ntb phase is related to the corresponding quantity
  =
= −
− in the N phase with unwound helix
  (presumed to be at the same temperature)
  .
.
Sample preparation for freeze-fracture TEM
To prepare the replica specimens for FFTEM, we put ~0.6 μl of material between two copper planchettes. The sandwich structure was heated (125 °C for M1 and 155 °C for M2) to obtain isotropic phase, and then cooled down and kept at deep Ntb phase temperature for 5 min, 95 °C for M1 ( 103 °C) and 80 °C for M2 (
 88 °C). The sample was quenched by plunge freezing in liquid nitrogen, with a high cooling rate >1,000 °C s−1, to avoid further phase transitions, and was quickly transferred into a freeze-fracture vacuum chamber (BalTec BAF060) where the assembly was kept at −140 °C. Inside the chamber, a built-in microtome was used to break the assembly and expose the fractured surface. Approximately 4-nm-thick Pt/C was then deposited onto the fractured surface at a 45° angle to create shadowing of the surface structure, followed by an ~20-nm-thick C deposition from the top to form a continuous supporting film. The samples were then warmed up and removed from the freeze-fracture machine. The liquid crystal material was dissolved in chloroform, whereas the replica film (often flakes) was picked up and placed onto carbon-coated TEM grid and observed using room temperature TEM (FEI Tecnai F20).
Synchrotron XRD studies
The material was filled into 1 mm diameter quartz tubes located inside a hot stage (Instec model HCS402). The cylindrical neodymium iron boron magnets were used to align the material in the magnetic field 1.5 T perpendicular to the incident X-ray beam. Small-angle X-ray scattering was recorded on a Princeton Instruments 2,084 × 2,084 pixel array charge-coupled device detector in the X6B beamline at the National Synchrotron Light Source. The beamline was configured for a collimated beam (0.2 × 0.3 mm2) at energy 16 keV (0.775 Å). In the N phase, there are two diffused peaks centred along the magnetic field (Figure 7b,c), with the wavenumber at the maximum intensity decreasing from qo=2.95 nm−1 near the clearing point to qo=2.77 nm−1 at 110 °C (inset in Fig. 7a), corresponding to periodicities from a=2.16 to 2.23 nm. At lower temperatures, a secondary peak at a doubled periodicity 4.46 nm is observed. These two length scales might correspond to (i) the length of one arm of the dimers and the length of the monomer, and (ii) to the length of the entire dimer, respectively. The full width at half maxima (Δq) is decreasing from Δq=1.5 nm−1 at 140 °C to Δq=0.8 nm−1 at 110 °C. This means that the correlation length ξ=2π/Δq is increasing from ξ≈4 to 8 nm. Such a behaviour is typical for an N phase with ‘cybotactic’ smectic clusters, that is, nanosized clusters of layers with correlation length ξ that increases on cooling. However, the macroscopic structure is still that one of a fluid N phase. Interestingly, the vertical lobes are nearly straight, indicating no rigid restriction on the layer spacing inside the clusters.
In the Ntb phase, qo increases rapidly from qo=2.77 to 2.93 nm−1 (Fig. 7a), which corresponds to local periodicity decreasing from d=2.23 to 2.14 nm. This can be explained by a bend of dimers with arms tilted away from the straight configuration by about ~15–20° or by the increased mosaicity of the Ntb phase. The width of the peak at half maxima is fairly temperature independent, Δq=0.75 nm−1, which corresponds to ξ=8.4 nm. It is interesting to see that the lobes of the diffused peaks are much closer to the circular shape, showing that the tilt of the arms of the dimers are much more defined than that in the N phase. Such a macroscopically fluid N phase with almost constant smectic nanoclusters is typical of bent-core N materials6.
Author contributions
V.B. performed electro-optical studies and analysed nanostructures; M.G. performed the TEM study and result analysis with the assistance of Y.-K.K.; J.X. measured elastic constants, A.J. analysed the XRD data, Y.-K.K., V.P.P. and J.K.V. explored electro-optic and alignment properties, C.T.I. thermally characterized M1, M.G.T. prepared M1 and M2, G.H.M. directed the molecular design, O.D.L. directed the research, analysed the data and wrote the text with an input from all co-authors.
Additional information
How to cite this article: Borshch, V. et al. Nematic twist-bend phase with nanoscale modulation of molecular orientation. Nat. Commun. 4:2635 doi: 10.1038/ncomms3635 (2013).
Supplementary Material
Supplementary Figures S1-S5 and Supplementary Methods
Acknowledgments
We thank S. Sprunt, N. Diorio and J. Angelo for the help with XRD. O.D.L. ackowledges useful discussions with N.A. Clark, M. Čopič, I. Dozov, R.D. Kamien, M. Kleman, R.B. Meyer, J.V. Selinger, S.V. Shiyanovskii and I. Smalyukh. Hospitality of the Isaac Newton Institute for Mathematical Sciences, Cambridge, UK, where part of this work was written, is greatly appreciated. C.T.I. gratefully acknowledges G.R. Luckhurst for the sample M1 and for invaluable discussions. We acknowledge the EPSRC National Mass Spectroscopy Facility, Swansea, UK for accurate mass data. The work was supported by DOE Grant DE-FG02-06ER 46331 (electrooptics), NSF DMR Grants 1104850 and 1121288, EU FP7 BIND Project 216025. The TEM data were obtained at the (cryo) TEM facility at the Liquid Crystal Institute, Kent State University, supported by the Ohio Research Scholars Program Research Cluster on Surfaces in Advanced Materials. Work in Dublin was partly supported by Science Foundation Ireland.
References
- Meyer R. B. in Molecular Fluids. Les Houches Lectures, 1973. (eds Balian, R. & Weill, G.) 271–343 (Gordon and Breach, 1976).
- Dozov I. On the spontaneous symmetry breaking in the mesophases of achiral banana-shaped molecules. Europhys. Lett. 56, 247–253 (2001). [Google Scholar]
- Shamid S. M., Dhakal S. & Selinger J. V. Statistical mechanics of bend flexoelectricity and the twist-bend phase in bent-core liquid crystals. Phys. Rev. E 87, 052503 (2013). [DOI] [PubMed] [Google Scholar]
- Memmer R. Liquid crystal phases of achiral banana-shaped molecules: a computer simulation study. Liq. Cryst. 29, 483–496 (2002). [Google Scholar]
- Kamien R. D. Liquids with chiral bond order. J. Phys. II France 6, 461–475 (1996). [Google Scholar]
- Jákli A. Liquid crystals of the twenty-first century—nematic phase of bent-core molecules. Liq. Cryst. Rev. 1, 65–82 (2013). [Google Scholar]
- Ungar G., Percec V. & Zuber M. Liquid crystalline polyethers based on conformational isomerism. 20. Nematic-nematic transition in polyethers and copolyethers based on 1-(4-hydroxyphenyl)2-(2-R-4-hydroxyphenyl)ethane with R=fluoro, chloro and methyl and flexible spacers containing an odd number of methylene units. Macromolecules 25, 75–80 (1992). [Google Scholar]
- Silvestri R. L. & Koenig J. L. Spectroscopic characterization of trans-gauche isomerization in liquid crystal polymers with two nematic states. Polymer 35, 2528–2537 (1994). [Google Scholar]
- Sepelj M. et al. Intercalated liquid-crystalline phases formed by symmetric dimers with an α,ω-diiminoalkylene spacer. J. Mater. Chem. 17, 1154–1165 (2007). [Google Scholar]
- Henderson P. A. & Imrie C. T. Methylene-linked liquid crystal dimers and the twist-bend nematic phase. Liq. Cryst. 38, 1407–1414 (2011). [Google Scholar]
- Panov V. P. et al. Spontaneous periodic deformations in nonchiral planar-aligned bimesogens with a nematic-nematic transition and a negative elastic constant. Phys. Rev. Lett. 105, 167801 (2010). [DOI] [PubMed] [Google Scholar]
- Panov V. P. et al. Field-induced periodic chiral pattern in the Nx phase of achiral bimesogens. Appl. Phys. Lett. 101, 234106 (2012). [Google Scholar]
- Cestari M., Frezza E., Ferrarini A. & Luckhurst G. R. Crucial role of molecular curvature for the bend elastic and flexoelectric properties of liquid crystals: mesogenic dimers as a case study. J. Mater. Chem. 21, 12303–12308 (2011). [Google Scholar]
- Cestari M. et al. Phase behavior and properties of the liquid-crystal dimer 1′′,7′′-bis(4-cyanobiphenyl-4′-yl) heptane: a twist-bend nematic liquid crystal. Phys. Rev. E 84, 031704 (2011). [DOI] [PubMed] [Google Scholar]
- Beguin L. et al. The chirality of a twist–bend nematic phase identified by NMR spectroscopy. J. Phys. Chem. B 116, 7940–7951 (2012). [DOI] [PubMed] [Google Scholar]
- Imrie C. T. & Henderson P. A. Liquid crystal dimers and higher oligomers: between monomers and polymers. Chem. Soc. Rev. 36, 2096–2124 (2007). [DOI] [PubMed] [Google Scholar]
- Panov V. P. et al. Microsecond linear optical response in the unusual nematic phase of achiral bimesogens. Appl. Phys. Lett. 99, 261903 (2011). [Google Scholar]
- Meyer C., Luckhurst G. R. & Dozov I. Flexoelectrically driven electroclinic effect in the twist-bend nematic phase of achiral molecules with bent shapes. Phys. Rev. Lett. 111, 067801 (2013). [DOI] [PubMed] [Google Scholar]
- Chen D. et al. A twist-bend chiral helix of 8 nm pitch in a nematic liquid crystal of achiral molecular dimers Preprint at http://arXiv.org/abs/1306.5504 (2013). [DOI] [PMC free article] [PubMed] [Google Scholar]
- Adlem K. et al. Chemically induced twist-bend nematic liquid crystals, liquid crystal dimers, and negative elastic constants. Phys. Rev. E 88, 022503 (2013). [DOI] [PubMed] [Google Scholar]
- Friedel M. G. Les états mésomorphes de la matière (The mesomorphic states of matter). Ann. Phys. 18, 273–474 (1922). [Google Scholar]
- Kleman M. & Lavrentovich O. D. Soft Matter Physics: An Introduction Springer (2003). [Google Scholar]
- Bouligand Y., Soyer M.-O. & Puiseux-Dao S. La structure fibrillaire et l'orientation des chromosomes chez les Dinoflagellés. Chromosoma 24, 251–287 (1968). [DOI] [PubMed] [Google Scholar]
- Barnes P. J., Douglass A. G., Heeks S. K. & Luckhurst G. R. An enhanced odd-even effect of liquid crystal dimers orientational order in the α,ω-bis(4′-cyanobiphenyl-4-yl)alkanes. Liq. Cryst. 13, 603–613 (1993). [Google Scholar]
- Balachandran R. et al. Elastic properties of bimesogenic liquid crystals. Liq. Cryst. 40, 681–688 (2013). [Google Scholar]
- Deuling H. J. Deformation of nematic liquid crystals in an electric field. Mol. Cryst. Liq. Cryst. 19, 123–131 (1972). [Google Scholar]
- Zhou S. et al. Elasticity of lyotropic chromonic liquid crystals probed by director reorientation in a magnetic field. Phys. Rev. Lett. 109, 037801 (2012). [DOI] [PubMed] [Google Scholar]
- de Gennes P. G. & Prost J. The Physics of Liquid Crystals 2nd edn Oxford University Press (1995). [Google Scholar]
- Li Z. & Lavrentovich O. D. Surface anchoring and growth pattern of the field-driven first-order transition in a smectic-A liquid crystal. Phys. Rev. Lett. 73, 280–283 (1994). [DOI] [PubMed] [Google Scholar]
- Lavrentovich O. D. & Yang D.-K. Cholesteric cellular patterns with electric-field-controlled line tension. Phys. Rev. E 57, R6269–R6272 (1998). [Google Scholar]
- Berreman D. W., Meiboom S., Zasadzinski J. A. & Sammon M. J. Theory and simulation of freeze-fracture in cholesteric liquid crystals. Phys. Rev. Lett. 57, 1737–1740 (1986). [DOI] [PubMed] [Google Scholar]
- Hori K., Iimuro M., Nakao A. & Toriumi H. Conformational diversity of symmetric dimer mesogens, α,ω-bis(4,4′-cyanobiphenyl)octane, -nonane, α,ω-bis(4-cyanobiphenyl-4′-yloxycarbonyl)propane, and –hexane in crystal structures. J. Mol. Struct. 699, 23–29 (2004). [Google Scholar]
- Barry E., Hensel Z., Dogic Z., Shribak M. & Oldenbourg R. Entropy-driven formation of a chiral liquid-crystalline phase of helical filaments. Phys. Rev. Lett. 96, 018305 (2006). [DOI] [PubMed] [Google Scholar]
- Coles H. J. & Pivnenko M. N. Liquid crystal ‘blue phases’ with a wide temperature range. Nature 436, 997–1000 (2005). [DOI] [PubMed] [Google Scholar]
- Chen D. et al. Twist-bend heliconical chiral nematic liquid crystal phase of an achiral rigid bent-core mesogen Preprint at http://arXiv.org/abs/1308.3526 (2013). [DOI] [PubMed] [Google Scholar]
Associated Data
This section collects any data citations, data availability statements, or supplementary materials included in this article.
Supplementary Materials
Supplementary Figures S1-S5 and Supplementary Methods


