The second-harmonic generation (SHG) and two-photon-excited ultraviolet fluorescence (TPE-UVF) activities of several precipitant salts used for protein crystallization were assessed as potential sources of false positives in macromolecular crystal screening. Results suggest that a relatively strong SHG signal together with weak or absent TPE-UVF can serve to discriminate between crystals formed from SHG-active salts versus proteins.
Keywords: protein crystals, second-harmonic generation
Abstract
Studies were undertaken to assess the merits and limitations of second-harmonic generation (SHG) for the selective detection of protein and polypeptide crystal formation, focusing on the potential for false positives from SHG-active salts present in crystallization media. The SHG activities of salts commonly used in protein crystallization were measured and quantitatively compared with reference samples. Out of 19 salts investigated, six produced significant background SHG and 15 of the 96 wells of a sparse-matrix screen produced SHG upon solvent evaporation. SHG-active salts include phosphates, hydrated sulfates, formates and tartrates, while chlorides, acetates and anhydrous sulfates resulted in no detectable SHG activity. The identified SHG-active salts produced a range of signal intensities spanning nearly three orders of magnitude. However, even the weakest SHG-active salt produced signals that were several orders of magnitude greater than those produced by typical protein crystals. In general, SHG-active salts were identifiable through characteristically strong SHG and negligible two-photon-excited ultraviolet fluorescence (TPE-UVF). Exceptions included trials containing either potassium dihydrogen phosphate or ammonium formate, which produced particularly strong SHG, but with residual weak TPE-UVF signals that could potentially complicate discrimination in crystallization experiments using these precipitants.
1. Introduction
The crystallization of proteins and related biologics and biopolymers is playing an increasingly important role in applications ranging from high-throughput protein crystal screening for structure determination to the preparation of new polypeptide formulations for new therapeutics. Consistent with this trend, fast and reliable protein crystal detection has grown in importance. Several techniques can be used to locate protein crystals within sample matrices. Common imaging techniques include bright field imaging, birefringence and UV–fluorescence (Haupert & Simpson, 2011 ▶; Echalier et al., 2004 ▶; Judge et al., 2005 ▶; Dierks et al., 2010 ▶). These methods are practical for their speed, which is essential when there are many samples to be screened within a limited time frame, such as 96 well plates.
More recently, second-harmonic generation (SHG) microscopy has been shown to enable selective detection of protein crystals (Haupert & Simpson, 2011 ▶). SHG can occur when a sample is exposed to an intense electromagnetic field that allows for two photons to interact simultaneously with a crystalline medium, which can result in one photon being emitted at twice the frequency of the incident beam (frequency doubling) (Ustione & Piston, 2011 ▶). The symmetry requirements for producing coherent SHG are not met in solutions or amorphous aggregates, but do arise in the large majority of crystals generated from chiral building blocks. Therefore, SHG microscopy has advantages over alternative analyses because of its high selectivity for crystals with a negligible background from amorphous media (Gauderon et al., 2001 ▶; Kissick et al., 2011 ▶; Kestur et al., 2012 ▶; Haupert & Simpson, 2011 ▶).
In crystallization trials, several possible sources of false positives for SHG may exist and can potentially complicate the definitive identification of protein crystals. Some 96 well plates can themselves produce point sources for SHG within the well plate itself (presumably from local defects or imperfections within the plastic material). However, these defects do not change in time over the course of the crystallization experiment and can be identified by recording an initial baseline set of images shortly after preparation of the screen. Alternatively, SHG can also arise from structures that exhibit non-centrosymmetric but noncrystalline ordering over microscopic length scales (e.g. collagen fibrils) (Stoller et al., 2002 ▶). However, protein aggregates typically do not spontaneously exhibit such long-range (several hundred nanometres) ordering in crystallization trials. Finally, if salts are added to the initial protein solution to induce crystallization, there is a risk of the salt crystallizing rather than, or along with, the proteins. If the crystallized salt is also SHG active, a false positive SHG signal can arise, which may be nontrivial to differentiate from a protein crystal based on SHG analysis alone. Consequently, a need has arisen for characterizing the SHG activities of common salts used for protein crystallography and for the development of protocols to reliably discriminate between salt and protein crystals.
2. Experimental
Individual salts (Mallinckrodt Chemicals and Sigma–Aldrich and used as received) were placed into a glass capillary tube (Kimble Chase 1.5–1.8 × 90 mm) and mounted to a goniometer to allow for sample translation. A Tsunami laser (Spectra Physics) operating at 800 nm with an 80 MHz repetition rate and pulse duration of 100 fs was coupled into a Thorlabs microscope using a 10× objective (Nikon) to focus the laser onto the sample, with 45 mW of laser power at the sample.
Quantitative analysis was performed by milling the salts into finer crystal sizes using a mortar and pestle, followed by SHG measurements within the glass capillary tubes with 3.0 mW of laser power at the sample. The SHG signal (400 nm wavelength) was detected in the transmission direction by a Hamamatsu H7422P-40 photomultiplier tube (PMT) after filtering through a 400 nm bandpass filter. Several areas of the salt-filled capillary were tested with images acquired at multiple Z planes through the capillary at 20 µm increments to determine the brightest average count per pixel. Multiple trials at different locations for each salt were performed to obtain representative sampling of the SHG activity and to establish the standard deviation of the separate trials. Two-photon-excited fluorescence (TPEF) in the visible range for each sample was assessed by switching to a 445.0  22.5 nm filter before the Hamamatsu PMT. Two-photon-excited ultraviolet fluorescence (TPE-UVF) was acquired using a commercial instrument (SONICC, Formulatrix) with an incident wavelength of 530 nm.
3. Results and discussion
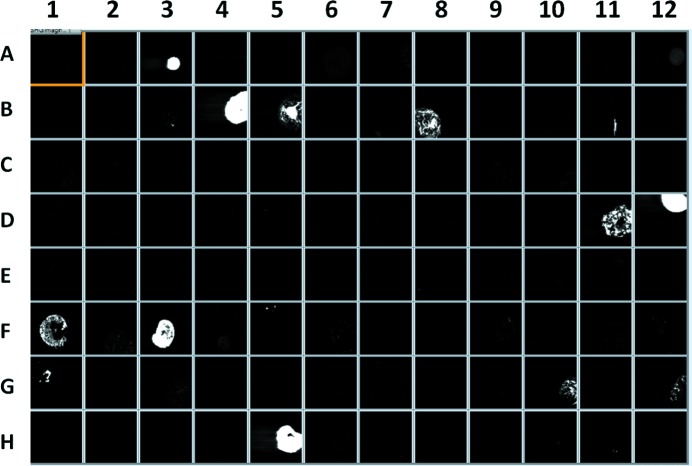
Protein crystallization is often performed in prepared well plates, where each well has been pre-filled with salts and/or polymers and a specific pH buffer. Of the 96 different matrix combinations of compounds within a Hampton 96 well plate (HR2-130 Reagent Formulation), in which each well was prepared by solvent evaporation under ambient conditions, 15 resulted in significant SHG signals (Fig. 1 ▶). Although it is possible that additional SHG-active crystal forms could potentially be generated from constituents in the remaining 81 SHG-inactive wells under favorable conditions, it is reasonable to expect the most common salt interferences to arise from components within the bright wells. Table 1 ▶ contains the matrix components within the wells that produced positive SHG signals. The brightest signals from wells A3, B4, B5, D12, F3 and H5 were attributed to the compounds lithium sulfate monohydrate and/or ammonium phosphate monobasic. Many of the other weaker SHG-active wells contained ammonium sulfate (wells B3, B8, D11, F1 and G1), although several other wells containing ammonium sulfate did not produce a detectable SHG signal. The weakest signals produced were from wells B11, F5, G10 and G12, in which the compound or compounds responsible for the residual SHG signal were difficult to determine.
Figure 1.
SHG images of a 96 well plate crystal screen. Numbering goes from A to H vertically and one to 12 horizontally. Components for SHG-active wells are noted in Table 1 ▶.
Table 1. Well components of Hampton screen HR2-130 exhibiting SHG activity.
| Well No. | Salt | Buffer | Precipitant | SHG activity |
|---|---|---|---|---|
| 3 (A3) | None | None | 0.4 M ammonium phosphate monobasic | Strong |
| 15 (B3) | 0.2 M ammonium sulfate | 0.1 M sodium cacodylatetrihydrate pH 5.6 | 30% w/v polyethylene glycol 8000 | Weak |
| 16 (B4) | None | 0.1 M HEPES sodium pH 7.5 | 1.5 M lithium sulfate monohydrate | Strong |
| 17 (B5) | 0.2 M lithium sulfate monohydrate | 0.1 M Tris–HCl pH 8.5 | 0.1 M Tris–HCl pH 8.5 | Strong |
| 20 (B8) | 0.2 M ammonium sulfate | 0.1 M sodium acetate trihydrate pH 4.6 | 0.1 M sodium acetate trihydrate pH 4.6 | Medium |
| 23 (B11) | 0.2 M magnesium chloride hexahydrate | 0.1 M HEPES sodium pH 7.5 | 30% v/v polyethylene glycol 400 | Weak |
| 47 (D11) | None | 0.1 M sodium acetate trihydrate pH 4.6 | 2.0 M ammonium sulfate | Medium |
| 48 (D12) | None | 0.1 M Tris–HCl pH 8.5 | 2.0 M ammonium phosphate monobasic | Strong |
| 61 (F1) | 0.2 M ammonium sulfate | 0.1 M sodium acetate trihydrate pH 4.6 | 30% w/v polyethylene glycol monomethyl ether 2000 | Medium |
| 63 (F3) | 0.5 M ammonium sulfate | 0.1 M sodium citrate tribasic dihydrate pH 5.6 | 1.0 M lithium sulfate monohydrate | Strong |
| 65 (F5) | None | 0.1 M sodium citrate tribasic dihydrate pH 5.6 | 35% v/v tert-butanol | Weak |
| 73 (G1) | 0.01 M cobalt(II) chloride hexahydrate | 0.1 M MES monohydrate pH 6.5 | 1.8 M ammonium sulfate | Medium |
| 82 (G10) | 0.05 M cadmium sulfate hydrate | 0.1 M HEPES pH 7.5 | 1.0 M sodium acetate trihydrate | Weak |
| 84 (G12) | None | 0.1 M HEPES pH 7.5 | 4.3 M sodium chloride | Weak |
| 89 (H5) | 0.01 M nickel(II) chloride hexahydrate | 0.1 M Tris pH 8.5 | 1.0 M lithium sulfate monohydrate | Strong |
Owing to the possible interferences that salts or protein matrix solutions may have on an SHG signal, the results from this preliminary study were followed with analysis of salts that are commonly used in protein crystallization. Table 2 ▶ provides a list of the salts tested for SHG activity, in which six of the 19 salts tested were SHG emitters. None of the chlorides, the citrates or the acetate generated a detectable SHG signal. Most of the sulfate compounds were also SHG inactive except for lithium sulfate monohydrate. All of the monobasic forms of phosphate salts (M+·H2PO4 −) produced SHG, while the dibasic sodium phosphate (Na2HPO4) produced no detectable SHG signal. Potassium sodium tartrate tetrahydrate and ammonium formate also showed SHG activity.
Table 2. Comprehensive list of all salts tested for SHG activity and their respective crystal class possibilities at room temperature and pressure.
Entries in bold for noncentrosymmetric compounds, thus predicted to be SHG positive. Crystal classes in bold should theoretically produce SHG activity (Boyd, 2008 ▶).
| Name | Formula | SHG active | TPE-UVF | Crystal classes |
|---|---|---|---|---|
| Ammonium chloride | NH4Cl | No | No | m3m |
| Ammonium citrate dibasic | (NH4)2C6H6O7 | No | No | |
| Ammonium formate | NH4(HCO2) | Yes | Yes | m |
| Ammonium phosphate monobasic | NH4(H2PO4) | Yes | Yes † |

|
| Ammonium sulfate | (NH4)2SO4 | No | No | mmm |
| Calcium chloride | CaCl2 | No | No | mmm |
| Calcium sulfate | CaSO4 | No | No | mmm, 622, 222 |
| Lithium sulfate monohydrate | Li2SO4·H2O | Yes | No | 2 |
| Magnesium sulfate | MgSO4 | No | No | mmm |
| Magnesium sulfate heptahydrate | MgSO4·7H2O | No | No | mmm |
| Potassium chloride | KCl | No | No | m3m |
| Potassium dihydrogen phosphate (KDP) | KH2PO4 | Yes | Yes | 2/m,  , 222, mm2 , 222, mm2
|
| Potassium sodium tartrate tetrahydrate | KNaC4H4O6·4H2O | Yes | No | 222, 2 |
| Sodium acetate | Na(CH3CO2) | No | No | mmm, mm2 |
| Sodium chloride | NaCl | No | No | m3m |
| Sodium citrate dihydrate | Na3C6H5O7·2H2O | No | No | |
| Sodium phosphate dibasic | Na2HPO4 | No | No | 2/m |
| Sodium phosphate monobasic monohydrate | NaH2PO4·H2O | Yes | No | mm2 |
| Sodium sulfate | Na2SO4 | No | No |
mmm,  , 6/mmm , 6/mmm
|
Very weak, but detectable signal.
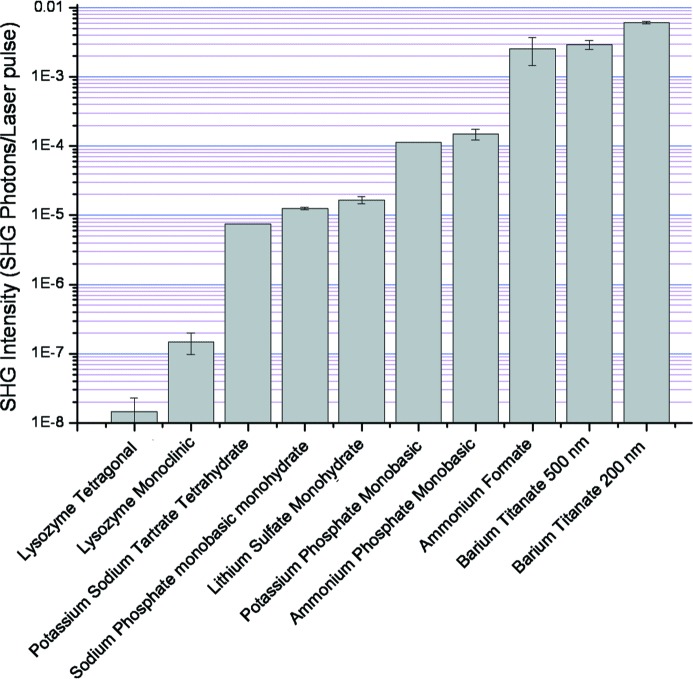
The relative brightnesses of the different salts were compared with each other and with a typical protein response, the results of which are summarized in Fig. 2 ▶. The two brightest signals were from barium titanate at two different particle sizes, 200 nm and 500 nm, which were tested to serve as a reference material for signal intensities. The salt that produced the greatest SHG intensity was ammonium formate, resulting in a signal comparable in intensity to the larger barium titanate particles. The other SHG- active salts were one to two orders of magnitude lower in intensity relative to the barium titanate.
Figure 2.
The relative SHG intensities of all active salt compounds. The y axis is the log scale of the average number of SHG photons counted per pixel for each laser pulse averaged over the entire image by using ImageJ software.
The analyzed salts in Table 2 ▶ were cross-referenced with their associated crystal classes (all referenced by the Inorganic Crystal Structure Database and the Cambridge Structural Database). As shown in the table, the crystal classes in bold type are noncentrosymmetric and of symmetry appropriate for SHG activity (Boyd, 2008 ▶). Fig. 2 ▶ shows that the SHG signals from the salts span nearly three orders of magnitude depending on the sample. All of the SHG-active salts produced signals several orders of magnitude greater than monoclinic and tetragonal lysozyme crystals, selected as representative protein crystals.
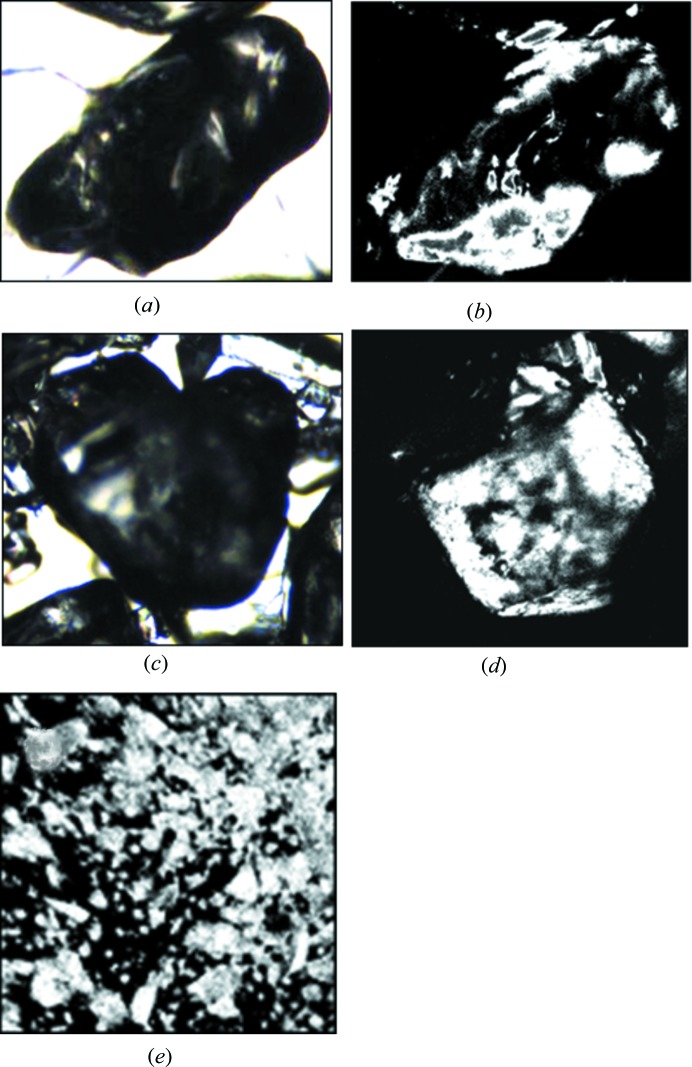
Only three of the salt compounds, ammonium formate, ammonium phosphate monobasic and potassium dihydrogen phosphate (KDP), produced a detectable TPE-UVF signal, although ammonium phosphate monobasic gave a substantially weaker signal compared to KDP and ammonium formate. Fig. 3 ▶ shows bright field images and TPE-UVF micrographs generated with 260 mW laser power for ammonium formate and KDP. The bottom image is lyophilized lysozyme powder as received from Sigma–Aldrich, known for a strong TPE-UVF response, measured with 100 mW of incident green light.
Figure 3.
Ammonium formate 0.96 × 0.75 mm, laser power 260 mW, (a) bright field and (b) TPE-UVF. KDP 1.2 × 1.0 mm, laser power 260 mW, (c) bright field and (d) TPE-UVF. Lysozyme TPE-UVF (e) at 100 mW laser power (0.54 × 0.54 mm).
It is interesting to conjecture on the origin of the observed TPE-UVF signals arising from the ammonium formate, KDP and ammonium phosphate monobasic samples. None of the molecules possess known excited state transitions capable of being accessed by one- or two-photon absorption at 260 nm. Several origins of the signal were considered. Three-photon-excited fluorescence may potentially arise as a result of higher energy excited states, followed by relatively large Stokes shifts prior to emission. However, it is not clear why only these species would be susceptible to TPE-UVF. Alternatively, trace impurities may be incorporated into the crystalline lattice. The signals observed are tentatively attributed to this latter mechanism, and if so may be reduced through improved purification procedures.
4. Conclusion
Several salts and prepared well plate solutions used to assist protein crystallization were tested for their respective SHG activity, which may register as false positives in SHG microscopy for protein crystal detection. Of the 96 well plates investigated in a sparse matrix screen, 15 produced significant background SHG upon solvent evaporation, leading to the identification of six candidates out of 19 salts tested for SHG activity. All of the salts producing SHG were confirmed to exhibit known noncentrosymmetric crystal polymorphs, consistent with the measured results. The intensity of the signals detected spanned nearly three orders of magnitude. However, even the weakest SHG signals were significantly stronger than a typical protein SHG signal. Only three of the salts tested produced detectable TPE-UVF signal. These collective results suggest that the combination of SHG with TPE-UVF can serve as a reasonable diagnostic for discriminating between protein and salt crystals.
Acknowledgments
RGC, EJG, JAN and GJS gratefully acknowledge support from NIH grant No. R01GM-103401-3 from the National Institute of General Medical Science (NIGMS).
References
- Boyd, R. W. (2008). Nonlinear Optics, 3rd ed. San Diego: Academic Press.
- Dierks, K., Meyer, A., Oberthür, D., Rapp, G., Einspahr, H. & Betzel, C. (2010). Acta Cryst. F66, 478–484. [DOI] [PMC free article] [PubMed]
- Echalier, A., Glazer, R. L., Fülöp, V. & Geday, M. A. (2004). Acta Cryst. D60, 696–702. [DOI] [PubMed]
- Gauderon, R., Lukins, P. B. & Sheppard, C. J. (2001). Micron, 32, 691–700. [DOI] [PubMed]
- Haupert, L. M. & Simpson, G. J. (2011). Methods, 55, 379–386. [DOI] [PMC free article] [PubMed]
- Judge, R. A., Swift, K. & González, C. (2005). Acta Cryst. D61, 60–66. [DOI] [PubMed]
- Kestur, U. S., Wanapun, D., Toth, S. J., Wegiel, L. A., Simpson, G. J. & Taylor, L. S. (2012). J. Pharm. Sci. 101, 4201–4213. [DOI] [PMC free article] [PubMed]
- Kissick, D. J., Wanapun, D. & Simpson, G. J. (2011). Annu. Rev. Anal. Chem. (Palo Alto Calif.), 4, 419–437. [DOI] [PMC free article] [PubMed]
- Stoller, P., Reiser, K. M., Celliers, P. M. & Rubenchik, A. M. (2002). Biophys. J. 82, 3330–3342. [DOI] [PMC free article] [PubMed]
- Ustione, A. & Piston, D. W. (2011). J. Microsc. 243, 221–226. [DOI] [PubMed]


