

Abstract
Children in foster care have often encountered a range of adverse experiences, including neglectful and/or abusive care and multiple caregiver transitions. Prior research findings suggest that such experiences negatively affect inhibitory control and the underlying neural circuitry. In the current study, event-related functional magnetic resonance imaging (fMRI) was employed during a go/no go task that assesses inhibitory control to compare the behavioral performance and brain activation of foster children and nonmaltreated children. The sample included two groups of 9- to 12-year-old children: 11 maltreated foster children and 11 nonmaltreated children living with their biological parents. There were no significant group differences on behavioral performance on the task. In contrast, patterns of brain activation differed by group. The nonmaltreated children demonstrated stronger activation than the foster children across several regions including the right anterior cingulate cortex, middle frontal gyrus, and right lingual gyrus during correct no go trials, whereas the foster children displayed stronger activation than the nonmaltreated children in the left inferior parietal lobule and right superior occipital cortex including the lingual gyrus and cuneus during incorrect no go trials. These results provide preliminary evidence that the early adversity experienced by foster children impacts the neural substrates of inhibitory control.
Keywords: foster children, functional magnetic resonance imaging (fMRI), brain activation, go/no go task, inhibitory control
There are approximately 400,000 children in foster care in the United States, and approximately 250,000 children enter foster care each year (U.S. Department of Health and Human Services, 2011). Foster children have typically been exposed to a host of early adverse experiences such as neglectful and/or abusive care and repeated caregiver disruptions; as a consequence, they demonstrate compromised physical, cognitive, and psychosocial development (Kessler et al., 2008; Leslie, Gordon, Ganger, & Gist, 2002; Pears & Fisher, 2005; Stein, 1997; Zima et al., 2000). Rates of behavior, attention, and substance-use problems are particularly high among foster children (Clausen, Landsverk, Ganger, Chadwick, & Litrownik, 1998; dosReis, Zito, Safer, & Soeken, 2001; Office of Applied Studies in the Substance Abuse and Mental Health Services Administration, 2005; Pilowsky, 1995; Vaughn, Ollie, McMillen, Scott, & Munson, 2007). For example, Garland et al. (2001) reported that 39% of the foster children in their study (vs. only 12% of children in the general population) met the diagnostic criteria for oppositional defiant disorder, conduct disorder, and/or attention deficit/hyperactivity disorder (ADHD). Despite extensive evidence of foster children’s increased risk, there is limited research examining the neural bases of these problems in this population. However, understanding the impact of early adversity on stress-sensitive neural systems could help identify the children most at risk for negative outcomes and could faciliate the development of targeted preventive interventions to reduce this risk (Fishbein, 2000; Gunnar, Fisher, & the Early Experience, Stress, and Prevention Network, 2006). In the current study, the neural substrates of inhibitory control, a cognitive process that has been implicated in the etiology of behavior, attention, and substance-use problems, were examined in foster children and nonmaltreated children in late childhood.
Inhibitory control (or cognitive control) is a higher-order cognitive process that falls under the general rubric of executive functioning. It involves the capacity to voluntarily inhibit prepotent attentional or behavioral responses and has been described as a mechanism for guiding appropriate behaviors through the suppression of competing but irrelevant information and behaviors (Casey, Tottenham, & Fossella, 2002; Durston, Thomas, Yang, et al., 2002). The results from neuroimaging studies have shown that specific regions of the prefrontal cortex and striatum are critical to inhibitory control abilities (Bunge, Dudukovic, Thomason, Vaidya, & Gabrieli, 2002; Casey, Trainor, et al., 1997; Durston, Thomas, Yang, et al., 2002; Liddle, Kiehl, & Smith, 2001). It has also been suggested that the anterior cingulate cortex serves a role in recruiting additional control to meet the demands of the situation (Botvinick, Braver, Barch, Carter, & Cohen, 2001; van Veen & Carter, 2002).
Inhibitory control and the underlying brain regions appear to have protracted developmental courses that continue into late adolescence. For example, researchers examining behavioral performance on inhibitory control tasks have demonstrated that young children are more susceptible to interference than older children and adults (Bunge et al., 2002; Casey, Trainor, et al., 1997; Durston, Thomas, Yang, et al., 2002; Gerstadt, Hong, & Diamond, 1994; Ridderinkhof, van der Molan, Band, & Bashore, 1997). Similarly, converging evidence from electrophysiological, structural neuroimaging, and functional neuroimaging studies indicates that the neural substrates of inhibitory control continue to mature into early adulthood (Davis, Bruce, Snyder, & Nelson, 2003; Durston, Davidson, et al., 2006; Gogtay et al., 2004; Rubia et al., 2006; Sowell et al., 2004; Thatcher, Walker, & Giudice, 1987). In addition to general maturational gains, there are significant individual differences in inhibitory control abilities. These differences, which appear to be stable across time (Eigsti et al., 2006; Kochanska, Murray, & Coy, 1997; Kochanska, Murray, & Harlan, 2000), are associated with important outcomes such as internalization of rules, social functioning, and academic competence (Blair & Razza, 2007; Eisenberg et al., 1997; Kochanska, Murray, Jacques, Koenig, & Vandegeest, 1996; McClelland et al., 2007; Pears, Fisher, Bruce, Kim, & Yoerger, 2010). Importantly, deficits in inhibitory control have been observed in children with behavior, attention, and substance-use problems (Casey, Castellanos, et al., 1997; Durston et al., 2003; Pears, Capaldi, & Owen, 2007; Tarter et al., 2003; Toupin, Déry, Pauzé, Mercier, & Fortin, 2000). Thus, alterations in inhibitory control and the underlying neural circuitry might play a critical role in the elevated rates of behavior, attention, and substance-use problems among foster children.
Because the brain regions supporting inhibitory control have a protracted development, it has been speculated that experiences in infancy and childhood influence the maturation of these regions (Black, 1998; De Bellis, 2001). In particular, early adverse experiences are believed to have a profound effect on these regions because the prefrontal cortex has extensive bidirectional connections with the hypothalamic-pituitary-adrenocortical system and other brain regions involved in the response to stress (Arnsten, 2009; Ghashghaei & Barbas, 2002; Herman, Ostrander, Mueller, & Figueiredo, 2005; Sullivan & Gratton, 2002). Indeed, prior research findings have shown that early adversity results in reduced neuronal spine density and length in the prefrontal cortex in rodents (Helmeke et al., 2009; Holmes & Wellman, 2009). Similarly, early adverse experiences such as harsh parenting (e.g., corporal punishment and verbal hostility) and maltreatment appear to have a deleterious effect on inhibitory control in children (Beers & De Bellis, 2002; Valiente, Lemery-Chalfant, & Reiser, 2007; Zhou, Eisenberg, Wang, & Reiser, 2004). Caregiver instability also appears to negatively affect inhibitory control in general and foster care populations (Lengua, Honorado, & Bush, 2007; Lewis, Dozier, Ackerman, & Sepulveda-Kozakowski, 2007; Pears, Bruce, Fisher, & Kim, 2010).
Although much of the research examining the effect of early adversity on inhibitory control in children has relied on behavioral measures, there is emerging evidence that early adversity impacts the development of the underlying brain regions (Behen et al., 2009; Bruce, McDermott, Fisher, & Fox, 2009; Carrion et al., 2001). For example, children with maltreatment-related posttraumatic stress disorder had a significantly lower N-acetylaspartate to creatine ratio, a marker of neuronal integrity, in the anterior cingulate cortex compared to nonmaltreated children (De Bellis, Keshavan, Spencer, & Hall, 2000). However, prior research with foster children has not utilized functional neuroimaging to explore the neural substrates of inhibitory control. This approach might be particularly informative because measures of neural activity (e.g. electrophysiological and neuroimaging data) can reveal differences in cognitive processing that are not captured by behavioral measures. For instance, measures of neural activity have been shown to differentiate children with ADHD from typically developing children in the absence of group differences on behavioral measures (Durston, Mulder, Casey, Ziermans, & van Engeland, 2006; Karayanidis et al., 2000; Pliszka et al., 2006).
In the current study, behavioral performance and brain activation during an inhibitory control task (go/no go task) were examined. The results of previous studies that have employed this task have revealed similar patterns of behavioral performance and brain activation among adults and children (Durston, Thomas, Worden, Yang, & Casey, 2002; Durston, Thomas, Yang, et al., 2002). That is, both groups were less accurate on trials requiring inhibitory control and displayed activation in the inferior frontal gyrus, anterior cingulate cortex, and striatum during these trials. Despite these similarities, the results of a longitudinal study indicate that activation during the task decreased in brain regions unrelated to task performance (i.e., dorsolateral prefrontal cortex) and increased in brain regions related to task performance (i.e., inferior frontal gyrus) from late childhood to early adolescence, suggesting that activation becomes more focal as the neural circuitry matures (Durston, Davidson, et al., 2006). The results of cross-sectional studies using different versions of the go/no go task have also shown increased activation with age in task-relevant brain regions such as the inferior frontal gyrus and anterior cingulate cortex (Bunge et al., 2002; Rubia et al., 2006; Tamm, Menon, & Reiss, 2002).
The objective of the current study was to examine the impact of early adversity on inhibitory control and the underlying brain regions in late childhood. Event-related functional magnetic resonance imaging (fMRI) was used during the go/no go task to compare the behavioral performance and brain activation of foster children and nonmaltreated children. Based on prior results (Lewis et al., 2007; Pears, Bruce, et al., 2010), the foster children were expected to demonstrate poorer behavioral performance on the go/no go task than the nonmaltreated children. Specifically, it was predicted that the foster children would be less accurate on trials requiring inhibitory control. Group differences on brain activation were also expected during trials requiring inhibitory control. Because the neural substrates of inhibitory control have not been previously examined in foster children using fMRI, it was challenging to make an a priori hypothesis about the direction of the group differences. However, based on the prior developmental study using this task (Durston, Davidson, et al., 2006), it was predicted that the nonmaltreated children would demonstrate a more developmentally mature pattern of brain activation with increased activation in task-relevant regions (e.g., inferior frontal gyrus and anterior cingulate cortex) during these trials.
Method
Participants
The sample in the current study included two groups of 9- to 12-year-olds: maltreated children residing in foster care and low-income, nonmaltreated children living with their biological parents. The foster care (FC) children were referred to the study by the local child welfare system office, and the nonmaltreated community comparison (CC) children were recruited via flyers and Internet postings. The eligibility criteria for both groups were as follows: fluent in English, right-hand dominant, no MRI contraindication, no history of head injury or epilepsy, and not currently taking psychotropic medication except stimulant medication. Children taking stimulant medication were asked to take a 24-hr medication hiatus. In the analytic sample, 1 FC child was taking a stimulant medication and the family agreed to a 24-hour medication hiatus prior to each laboratory session. To ensure that group differences were not attributable to SES, additional eligibility criteria for the CC group were as follows: household income less than $40,000 (i.e., household income for a family of four to qualify for reduced price school meals via the National School Lunch Program), parental education less than a 4-year college degree, and no involvement with child welfare services as verified by child welfare services records. Of the children recruited for the study, 4 (2 FC and 2 CC) were unable to complete data collection because they felt uncomfortable or had difficulty remaining still in the MRI scanner, 4 (3 FC and 1 CC) were excluded because of technical problems, and 2 (1 FC and 1 CC) were excluded because of poor behavioral performance. The resulting analytical sample was 11 FC children and 11 CC children.
As shown in Table 1, the FC and CC children in the analytic sample did not differ by age, F(1, 20) = 0.04, ns, or sex, Pearson χ2(1, N = 22) = 0.00, ns. Additionally, the groups did not significantly differ in terms of ethnicity, Pearson χ2(1, N = 22) = 0.19, ns. The ethnicity of the FC children was 64% (n = 7) European American, 18% (n = 2) Latino, 9% (n = 1) African American, and 9% (n = 1) multiethnic. The ethnicity of the CC children was 55% (n = 6) European American, 9% (n = 1) Latino, and 36% (n = 4) multiethnic. However, based upon parental report on the Child Behavior Checklist (Achenbach, 1991), there were significant group differences on the subscales for Attention Problems, F(1, 20) = 5.65, p = .028, and Externalizing Problems, F(1, 20) = 5.54, p = .029, with higher T-scores for the FC children than for the CC children. Furthermore, while none of the CC children were within the clinical range on either subscale, 4 of the FC children were within the clinical range on the Attention Problems subscale and 5 of the FC children were within the clinical range on the Externalizing Problems subscale.
Table 1.
Descriptive Statistics for Demographic Characteristics and Behavioral Performance for the Community Comparison Group and the Foster Care Group
| Variable | CC group | FC group | ||
|---|---|---|---|---|
| Age (years M SD) | 10.98 | 0.86 | 10.91 | 0.90 |
| Male (%) | 55 | 55 | ||
| Attention Problems (M SD) | 55.64 | 5.77 | 65.82 | 12.99 |
| Externalizing Problems (M SD) | 48.45 | 5.66 | 58.82 | 13.47 |
| Household income (Mdn) | $25,000–29,999 | $50,000–59,999 | ||
| Correct responses (% M SD) | 70 | 12 | 75 | 13 |
Note. CC = community comparison; FC = foster care.
In terms of family demographic characteristics, the results of a Mann Whitney U test revealed that the groups did not differ by median level of parental education, z = −1.68, ns. The median education levels indicated that the parents in both groups graduated from high school but did not graduate from a 4-year college. As shown in Table 1, the median household income level was higher for FC families than the CC families, z = −2.06, p = .04. The lower household income level for the CC families was considered acceptably comparable to the biological families of the FC children. Additionally, the results of Spearman’s rho correlational analyses indicated that household income level was not significantly related to accuracy, rs(20) = −.22, ns, or reaction time, rs(20) = −.22, ns, on the go/no go task.
Descriptive information about the FC children’s maltreatment and foster care placement experiences suggested that these children encountered a range of early adverse experiences. The mean age of foster care entry was 8.93 years (SD = 2.42), and the mean number of caregiver transitions resulting from placement in foster care and disruption of foster care placements was 2.91 (SD = 2.39). On average, the children had been in their current foster care placements for 9.47 months (SD = 5.40). The reason for the current foster care placement was coded from their child welfare services records, which indicated that 82% (n = 9) of the FC children experienced multiple types of maltreatment. The specific type of maltreatment included 91% (n = 10) physical or supervisory neglect, 82% (n = 9) emotional abuse, 55% (n = 6) physical abuse, and 9% (n = 1) sexual abuse. In addition, other issues such as parental incarceration, drug and alcohol use, and domestic violence were noted for all of the children.
Procedure
Prior to participation in this study, informed consent was obtained from each child, foster parent, and child welfare services caseworker for the FC group and from each child and parent for the CC group. The children then completed two 1-hr laboratory sessions at the Robert and Beverly Lewis Center for Neuroimaging at the University of Oregon. During the first session, the children practiced the go/no go task, received instruction on important neuroimaging protocols (e.g., safety procedures and acceptable amounts of head movement), and experienced a simulated MRI scan. During the second session, the children completed the go/no go task while event-related fMRI data were recorded. Structural MRI data were acquired after the children completed two blocks of the task. (Diffusion tensor imaging and resting state functional connectivity MRI data were also collected during the second session; however, these data are not presented in this paper.) While the neuroimaging data was acquired, the parents completed several questionnaires, including a demographics questionnaire and the Child Behavior Checklist.
Measures
Go/no go task
The go/no go task (Durston, Thomas, Yang, et al., 2002) required the children to inhibit behavioral responses by selectively responding to target stimuli and inhibiting responses to infrequent nontarget stimuli. For each trial, a black single-digit number was presented in the center of a white background for 500 ms. A variable interstimulus interval (M = 5000 ms, range = 2500–7500 ms) was used to improve the statistical efficiency with which the hemodynamic responses for specific types of trials could be modeled (Dale, 1999; Liu & Frank, 2004). The children were instructed to press a button as fast as possible for every number (i.e., go stimuli) except for one specific number (i.e., no go stimulus). To dissociate the effects of the motor response on brain activation, half of the children in each group used their right hand to press the button and the other half used their left hand to press the button. As noted above, all of the children were right-hand dominant, and thus the children who used their right hand to press the button were using their dominant hand. However, the hand used to press the button was not significantly related to accuracy, F(1, 20) = 0.86, ns, or reaction time, F(1, 20) = 0.08, ns. The task consisted of four blocks of 36 trials each: 75% go trials and 25% no go trials in each block for a total of 108 go trials and 36 no go trials. A different pseudorandom order was used for each block. Each block was preceded by a 30-s resting baseline period (or rest), during which the children were instructed to look at a fixation point. This rest period provided the baseline condition for contrasts with the experimental conditions (i.e., different trial types).
Presentation (Neurobehavioral Systems, Inc.) was used to present the stimuli and record accuracy and reaction time for each trial. The stimuli were presented with a digital projector/ reverse screen display system to a screen at the back of the MRI scanner. The children viewed the screen via a mirror attached to the coil and responded using an MRI-compatible fiber-optic response box.
fMRI data acquisition and preprocessing
The neuroimaging data were collected using a Siemens Allegra 3.0 Tesla head-only MRI scanner (Siemens Medical Solutions USA, Inc.). A standard birdcage coil was used to acquire data from the entire brain. The children wore earplugs and sound-attenuating earphones. Padding was used between the earphones and coil to minimize head movement.
Each session included a 46-s autoalignment scan that oriented subsequent acquisitions independent of the position of the head to assure optimal coverage for each child and consistency across children. A true fast imaging with steady precession, 3-plane, multislice scout was run for 63 s. For the fMRI data, an echo-planar imaging, blood oxygen level–dependent (EP2D-BOLD) sequence was run (TR = 2000 ms, TE = 30 ms, flip angle = 80°, FOV = 200 mm, 32 contiguous 4-mm thick interleaved slices, 64 × 64 matrix, spectral fat saturation, bandwidth = 2604 Hz). Steady state magnetization was established by running two repetition times prior to any image acquisitions. Prospective acquisition correction for head motion was used to reduce motion-induced artifacts during the long blocks of fMRI data (Thesen, Heid, Mueller, & Schad, 2000). Head motion of less than 1 mm was considered acceptable. After the second block of the go/no go task, a modified inversion magnetization-prepared rapid acquisition gradient echo (TR = 2500 ms, TE = 4.38 ms, TI = 1100 ms, flip angle = 8°, FOV = 256 mm, 160 slices, bandwidth = 130 Hz) was run for 8 min to acquire T1 weighted 1 mm3 resolution anatomical images with optimized gray–white matter contrast.
Neuroimaging data were converted to Neuroimaging Informatics Technology Initiative (NIfTI) data format using MRIConvert (Robert and Beverly Lewis Center for Neuroimaging, University of Oregon), and brain images were separated from the rest of the head tissue images using the Brain Extraction Tool from the FMRIB Software Library (FSL; Beckmann et al., 2006; Smith, 2002; Smith et al., 2001). All other preprocesssing steps were accomplished using Statistical Parametric Mapping (SPM) software package (version 8; FIL Methods Group), including realignment of the functional images, registration of each child’s structural image to his/her functional images, normalization to the standard images of the Montreal Neurological Institute (MNI) template, and smoothing with a 6-mm full-width at half-maximum isotropic Gaussian kernel.
Data Analysis
A repeated-measures analysis of variance (ANOVA) was conducted to compare the percentage of correct responses on the go and no go trials between groups. Statistical analyses based on general linear modeling were conducted to examine the fMRI data using SPM. At the fixed effects level, contrasts were computed for each participant for each trial type (i.e., correct go trials, incorrect go trials, correct no go trials, and incorrect no go trials) versus rest. For the go trials, the mean number of trials included in these contrasts for each group is as follows: 80.36 (SD = 20.13) for FC children and 90.64 (SD = 23.65) for CC children for correct trials and 5.55 (SD = 4.55) for FC children and 5.09 (SD = 5.32) for CC children for incorrect trials. For the no go trials, the mean number of trials included in these contrasts for each group is as follows: 16.36 (SD = 7.78) for FC children and 15.91 (SD = 8.56) for CC children for correct trials and 12.72 (SD = 6.66) for FC children and 16.00 (SD = 6.90) for CC children for incorrect trials. Due to the low number of errors on go trials, incorrect go trials were modeled as a condition of no interest. However, because there were a sufficient number of errors on no go trials, brain regions activated during unsuccessful response inhibition were examined. The contrast images generated for each participant were used at the random effects level in a repeated-measures ANOVA, with trial type as the within-subjects factor and group as the between-subjects factor. All analyses were conducted at the whole-brain level, and then parameter estimates were extracted from the brain regions identified in the whole-brain analyses to explore significant group differences. For all whole-brain analyses, only results that exceeded a threshold of p < 0.005 and 115 contiguous voxels are reported, corrected for multiple comparisons to a false discovery rate of α < .05 using the Resting-State fMRI Data Analysis Toolkit [REST] alpha simulation program (Song et al., 2011) with an intrinsic smoothness of 12-mm full-width at half-maximum and total number of in-brain voxels derived from the random effects analysis.
Results
Behavioral Data
The percentages of correct responses for the FC and CC groups were compared using a repeated-measures ANOVA, with trial type as the within-subjects factor and group as the between-subjects factor. As expected, the main effect of trial type was significant, F(1, 20) = 70.82, p = .000, with more correct responses on the go trials (M = 94%, SD = 5%) than on the no go trials (M = 51%, SD = 25%). As shown in Table 1, the overall percentages of correct responses were comparable across groups; thus, the main effect of group was nonsignificant, F(1, 20) = 1.07, ns. The interaction between trial type and group was also not nonsignificant, F(1, 20) = 1.87, ns.
fMRI Data Brain activation during successful response inhibition
To examine the brain regions activated during successful response inhibition, activation during correct no go trials was compared to activation during correct go trials for the whole sample. As shown in Table 2, significantly increased activation was observed in a number of regions, including the left and right insula and inferior frontal gyrus, right anterior cingulate cortex (Brodmann area [BA] 24 and 32), left and right inferior parietal lobule (BA 40), and left and right thalamus.
Table 2.
Areas of Significant Activation for the Correct No Go–Minus–Correct Go Contrast for the Whole Sample
| MNI
|
|||||
|---|---|---|---|---|---|
| Area | t | k | x | y | z |
| Right insula and inferior frontal gyrus | 5.35 | 410 | 39 | 14 | −8 |
| Left insula and inferior frontal gyrus (BA 13 and 47) | 6.20 | 260 | −36 | 17 | −8 |
| Right anterior cingulate cortex (BA 24 and 32) | 4.29 | 182 | 0 | 20 | 19 |
| Right temporal gyrus and inferior parietal lobule (BA 40) | 5.62 | 598 | 54 | −43 | 40 |
| Left superior temporal gyrus and inferior parietal lobule (BA 7, 39, and 40) | 4.13 | 251 | −54 | −49 | 28 |
| Left middle temporal gyrus | 5.49 | 124 | −51 | −34 | −11 |
| Bilateral thalamus | 5.25 | 160 | −3 | −16 | −2 |
Note. MNI = Montreal Neurological Institute; BA = Brodmann area; t = t-statistic at the local maxima; k = cluster size. The MNI columns show x-, y-, and z-axis stereotactic coordinates of the local maxima in the MNI atlas.
Brain activation during unsuccessful response inhibition
To investigate brain regions activated during unsuccessful response inhibition, activation during incorrect no go trials was compared to activation during correct no go trials for the whole sample. As shown in Table 3, significant activation for this contrast was observed in the left and right occipital cortex, including the lingual gyrus, cuneus, and precuneus.
Table 3.
Areas of Significant Activation for the Incorrect No Go–Minus–Correct No Go Contrast for the Whole Sample
| MNI
|
|||||
|---|---|---|---|---|---|
| Area | t | k | x | y | z |
| Bilateral occipital cortex, including lingual gyrus, cuneus, and precuneus | 4.94 | 1384 | −9 | −58 | −5 |
Note. MNI = Montreal Neurological Institute; BA = Brodmann area; t = t-statistic at the local maxima; k = cluster size. The MNI columns show x-, y-, and z-axis stereotactic coordinates of the local maxima in the MNI atlas.
Effect of group on brain activation during successful response inhibition
To examine group differences on the pattern of activation associated with successful response inhibition, the brain activity of FC and CC groups was compared during the correct no go trials relative to the correct go trials. The FC group did not show greater activation in any region than the CC group for this contrast. However, as shown in Table 4 and Figure 1, the CC group showed significantly greater activation than the FC group during the correct no go trials relative to the correct go trials in the right lingual gyrus (BA 18), right anterior cingulate cortex extending into the middle frontal gyrus (BA 6 and 32), and right and left occipital cortex including the cuneus. To further understand this group difference, parameter estimates were extracted from the activation in the right lingual gyrus and right anterior cingulate cortex for the FC and CC groups during correct no go trials and correct go trials relative to rest using the MarsBaR region of interest toolbox for SPM (Brett, 2011). The results, shown in Figures 2a and 2b, appear to be similar for the right lingual gyrus and right anterior cingulate cortex. Specifically, the group difference on activation during the correct no go trials compared to the correct go trials seems to be attributable to the CC group showing greater activation than the FC group during the correct no go trials. Indeed, a post-hoc t-test revealed that activation in the right lingual gyrus was greater for the CC group compared to the FC group for correct no go trials, t(21) = 2.65, p = .015. However, the group difference on activation during correct go trials was nonsignificant, t(21) = .16, ns. Similarly, although there was not a significant group difference on activation in the right anterior cingulate cortex during correct go trials, t(21) = 1.05, ns, activation in this region during correct no go trials was greater for the CC group compared to the FC group, t(21) = 3.98, p = .001. To further explore this group difference, correlations between the parameter estimates extracted from the right lingual gyrus and right anterior cingulate cortex during correct go trials and correct no go trials and the percentage of correct responses on the no go trials were examined. None of these correlations reached statistical significance, r(20) = −.06–.12, ns.
Table 4.
Areas of Significantly Increased Activation for the Community Comparison Group Compared to the Foster Care Group for the Correct No Go–Minus–Correct Go Contrast
| MNI
|
|||||
|---|---|---|---|---|---|
| Area | t | k | x | y | z |
| Right anterior cingulate cortex and middle frontal gyrus (BA 6 and 32) | 4.36 | 235 | 6 | 17 | 43 |
| Right lingual gyrus (BA 18) | 4.41 | 131 | 18 | −85 | −11 |
| Left occipital cortex, including cuneus | 3.97 | 158 | −9 | −79 | 16 |
| Right occipital cortex, including cuneus | 4.26 | 179 | 21 | −82 | 13 |
Note. MNI = Montreal Neurological Institute; BA = Brodmann area; t = t-statistic at the local maxima; k = cluster size. The MNI columns show x-, y-, and z-axis stereotactic coordinates of the local maxima in the MNI atlas.
Figure 1.
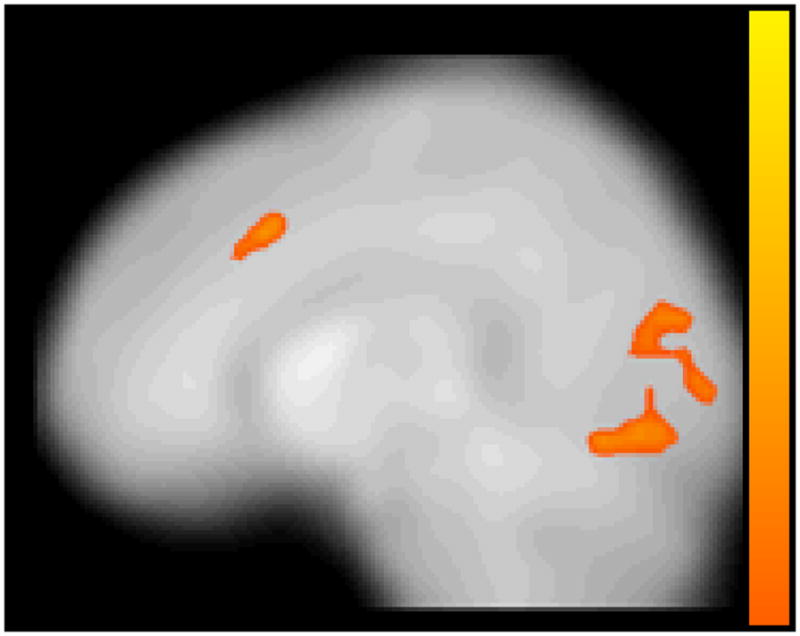
Areas of significantly increased activation for the community comparison group compared to the foster care group for the correct no go–minus–correct go contrast. Color bar represents t-statistic (with darker colors representing higher t-statistic values) for clusters that exceeded a threshold of p < 0.005 and 115 contiguous voxels, corrected for multiple comparisons to a false discovery rate of α < .05.
Figure 2.
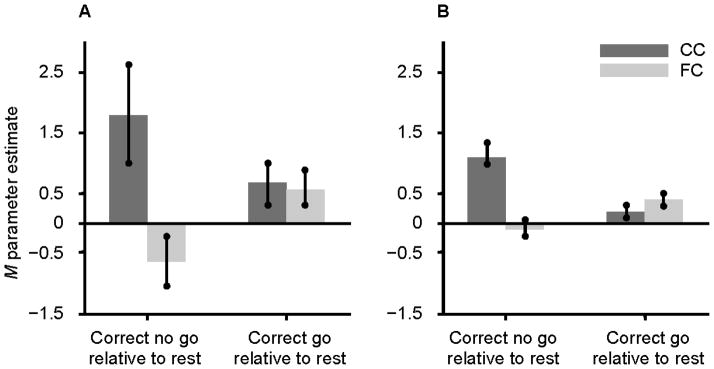
Parameter estimates extracted from the activation in the right lingual gyrus (MNI coordinates: 18, −85, −11) and right anterior cingulate cortex (MNI coordinates: 6, 17, 43) during correct no go trials and correct go trials relative to rest for the CC and FC groups. Note. MNI = Montreal Neurological Institute; CC = community comparison; FC = foster care; A = right lingual gyrus; B = right anterior cingulate cortex.
Effect of group on brain activation during unsuccessful response inhibition
To investigate group differences on the pattern of activation associated with unsuccessful response inhibition, the brain activity of FC and CC groups was compared during the incorrect no go trials relative to the correct no go trials. The CC group did not show greater activation in any region than the FC group for this contrast. However, as shown in Table 5 and Figure 3, the FC group showed significantly greater activation than the CC group during the incorrect no go trials relative to the correct no go trials in the left inferior parietal lobule (BA 2 and 40) and right superior occipital cortex including the lingual gyrus, cuneus, and precuneus (BA 18 and 31). To further understand this group difference, parameter estimates for the left inferior parietal lobule were extracted for the FC and CC groups during incorrect no go trials and correct no go trials relative to rest using MarsBaR. As shown in Figure 4, the group difference in the inferior parietal lobule appeared to be driven by the CC group showing greater activation than the FC group during correct no go trials relative to rest and by the FC group showing greater activation than the CC group during incorrect no go trials relative to rest. However, a post-hoc t-test revealed that the group difference on activation in the left inferior parietal lobule during correct no go trials relative to rest was nonsignificant, t(21) = 1.73, ns. Activation in this region was significantly greater for the FC group compared to the CC group during incorrect no go trials relative to rest, t(21) = 4.17, p < .001. To further explore this group difference, correlations between the parameter estimates extracted from the left inferior parietal lobule during correct no go trials and incorrect no go trials and the percentage of correct responses on the no go trials were examined. Neither of these correlations were significant, r(20) = −.30, ns, and r(20) = −.07, ns, respectively.
Table 5.
Areas of Significantly Increased Activation for the Foster Care Group Compared to the Community Comparison Group for the Incorrect No Go–Minus–Correct No Go Contrast
| MNI
|
|||||
|---|---|---|---|---|---|
| Area | t | k | x | y | z |
| Left inferior parietal lobule (BA 2 and 40) | 4.35 | 143 | −36 | −31 | 43 |
| Right superior occipital cortex, including cuneus and precuneus (BA 18 and 31) | 4.87 | 413 | 21 | −82 | 19 |
| Right lingual gyrus (BA 18) | 5.32 | 145 | 9 | −67 | −11 |
Note. MNI = Montreal Neurological Institute; BA = Brodmann area; t = t-statistic at the local maxima; k = cluster size. The MNI columns show x-, y-, and z-axis stereotactic coordinates of the local maxima in the MNI atlas.
Figure 3.
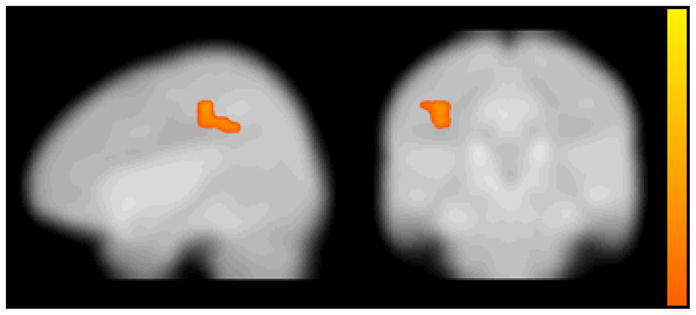
Areas of significantly increased activation for the foster care group compared to the community comparison group for the incorrect no go–minus–correct no go contrast. Color bar represents t-statistic (with darker colors representing higher t-statistic values) for clusters that exceeded a threshold of p < 0.005 and 115 contiguous voxels, corrected for multiple comparisons to a false discovery rate of α < .05.
Figure 4.
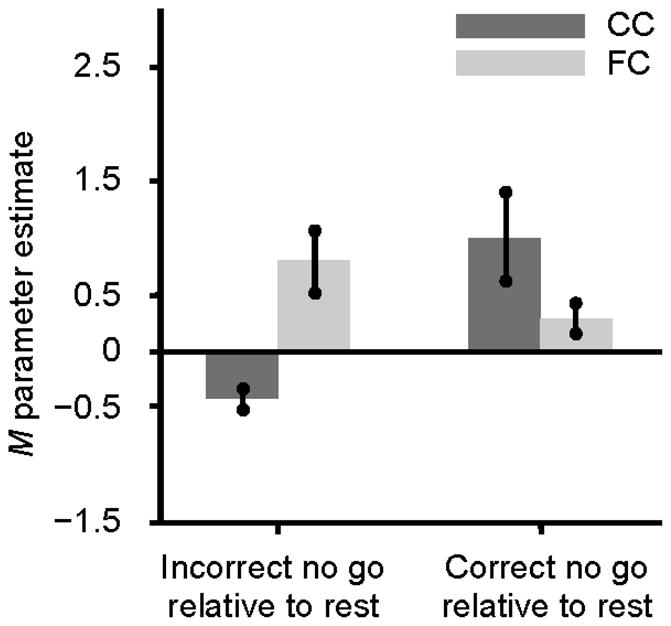
Parameter estimates extracted from the activation in the left inferior parietal lobule (MNI coordinates: −36, −31, 43) during incorrect no go trials and correct no go trials relative to rest for the CC and FC groups. Note. MNI = Montreal Neurological Institute; CC = community comparison; FC = foster care.
Discussion
In the current study, behavioral performance and brain activation during an inhibitory control task were compared for foster children and nonmaltreated children. Overall, there were two noteworthy findings. First, the children’s behavioral performance and brain activation were consistent with the results of previous research using this task with adults and children (Durston, Davidson, et al., 2006; Durston, Thomas, Yang, et al., 2002). Second, despite the absence of group differences on behavioral performance, the patterns of brain activation in the foster children and nonmaltreated children differed during the task.
As expected, the children were more accurate on the go trials than the no go trials. These results, which replicate prior findings, suggest that successfully inhibiting a response during the go/no go task continues to be a challenging task through late childhood. The results for the patterns of brain activation were also consistent with prior findings. The children displayed increased activation in the bilateral inferior frontal gyrus and right anterior cingulate cortex during the no go trials compared to during the go trials. As noted above, these regions are believed to play a critical role in inhibitory control (Botvinick et al., 2001; Casey, Trainor, et al., 1997; Durston, Thomas, Yang, et al., 2002). Furthermore, there was a sufficient number of errors on the no go trials to permit examination of the brain activation during unsuccessful response inhibition, which is believed to reflect processes related to error detection and recruitment of additional control mechanisms (Braet et al., 2009; Garavan, Ross, Kaufman, & Stein, 2003). Consistent with the findings from previous studies examining errors during inhibitory control tasks (Braet et al., 2009; Menon, Adleman, White, Glover, & Reiss, 2001; Rubia, Smith, Taylor, & Brammer, 2007), the children demonstrated greater activation in the bilateral lingual gyrus, cuneus, and precuneus during the incorrect no go trials than during the correct no go trials. Taken together, these results provide evidence that the go/no go task elicited the expected patterns of behavioral performance and brain activation in the current sample.
The foster children did not significantly differ from the nonmaltreated children in terms of behavioral performance. That is, accuracy on the go trials and no go trials was comparable across the groups. Notably, however, there were significant group differences on the children’s brain activation during the task. These results provide further evidence that behavioral and neural activity measures provide divergent information about group differences. This pattern of results has been observed in previous research with foster children and children with ADHD (Bruce et al., 2009; Durston, Mulder, et al., 2006; Karayanidis et al., 2000; Pliszka et al., 2006) and is believed to reflect subtle differences in cognitive processing that behavioral measures are not sensitive enough to detect. Such differences, though perhaps not apparent in the children’s behavioral performance on a laboratory task, might impact functioning in complex social and academic settings.
As predicted, the nonmaltreated children demonstrated stronger activation than the foster children during correct no go trials in task-relevant brain regions such as the right anterior cingulate cortex and middle frontal gyrus. As noted above, the findings from longitudinal and cross-sectional studies have shown increased activation in task-relevant brain regions with age during the go/no go task (Bunge et al., 2002; Durston, Davidson, et al., 2006; Tamm et al., 2002). For example, Rubia and colleagues (2006) found that adults demonstrated greater activation than adolescents in the anterior cingulate cortex during correct no go trials and that there was a positive linear correlation between this activity in the anterior cingulate cortex and age. Thus, the increased activation in the anterior cingulate cortex and middle frontal gyrus among the nonmaltreated children might represent a more developmentally mature pattern of brain activation. However, it should be noted that the developmental literature related to brain activation during different versions of the go/no go task is not entirely consistent. For example, Braet and colleagues (2009) found that adolescents show greater activation than adults during correct no go trials across a widely distributed network of frontal, parietal, and medial regions. Thus, additional research with the general population and foster care population is needed to more fully understand the implications of the group difference on brain activation during correct no go trials.
During the incorrect no go trials, the foster children displayed stronger activation than the nonmaltreated children, particularly in the left inferior parietal lobule. Although activation during unsuccessful response inhibition has been examined less frequently, a number of studies have found increased activation in the inferior parietal lobule during incorrect no go trials (Braet et al., 2009; Hester, Fassbender, & Garavan, 2004; Rubia, Smith, Brammer, & Taylor, 2003; Rubia et al., 2007). Interestingly, increased activation in the parietal lobule during unsuccessful response inhibition was negatively correlated with age in a developmental study with adults and children (Rubia et al., 2007); the researchers speculated that the increased activation in this region might compensate for the decreased activation in task-relevant brain regions. Thus, perhaps the group difference on the brain activation during incorrect no go trials resulted from the foster children employing alternative strategies (e.g., increased involvement of working memory or sustained attention) to compensate for alterations in the regions critical to inhibitory control. The foster children’s use of alternative strategies might also explain the absence of group differences on behavioral performance on the task and the lack of significant correlations between behavioral performance and brain activation during the task.
Although the results of the current study were consistent with the results of previous research, there were several limitations. First, the sample size was small, which might have reduced the power to detect group differences. Additionally, the small sample size precluded examining the effects of specific aspects of the foster children’s maltreatment and foster care experiences (e.g., type of maltreatment and number of caregiver disruptions) on behavioral performance and brain activation during the go/no go task. Similarly, the impact of prenatal and perinatal experiences (e.g., prenatal exposure to drugs and alcohol and birth weight) could not be explored because this information was generally not available in the foster children’s child welfare services records. However, neuroimaging studies tend to have smaller sample sizes and it is very challenging to obtain neuroimaging data with at-risk children. Second, a number of foster children were excluded from the study due to the use of psychotropic medications, which are more widely used in the foster care population than in the general population. Therefore, the results might underestimate the differences between foster children and nonmaltreated children. Given the potential impact of such medications on the neural substrates of inhibitory control, it was important to rule out this variable. Third, efforts to equate the household income level of the nonmaltreated families to the biological families of the foster children resulted in a significantly lower income for the nonmaltreated families compared to the foster families. Although this approach might have reduced the differences between foster children and nonmaltreated children, it is important to note that household income level was not significantly associated with behavioral performance in the current study. Nevertheless, these limitations emphasize the importance of replicating the results of the current study with a larger sample, which might facilitate the examination of the differential effects of specific early adverse experiences.
In summary, the results suggest that the go/no go task can be successfully employed with foster children to assess inhibitory control in a neuroimaging environment. Few, if any, neuroimaging studies have been focused on foster children, which is not surprising given the sensitivity required to assess this vulnerable population. These results also provide preliminary evidence that the patterns of brain activation in foster children and nonmaltreated children during an inhibitory control task significantly differ, suggesting that the early adversity encountered by foster children impacts the underlying neural circuitry. Lastly, these results underscore the need for further research with at-risk populations. In addition to replicating the current results, it will be critical to determine whether alterations in the neural substrates of inhibitory control increase the risk of behavior, attention, and substance-use problems in foster children.
Acknowledgments
Support for this research was provided by the following grants: MH059780, MH065046, and MH078105, NIMH, U.S. PHS; and DA023920 and DA026501, NIDA, U.S. PHS. The authors thank the children and parents who participated in this study, Yalchin Abdullaev and Michael Posner for research design assistance, the staff at the Robert and Beverly Lewis Center for Neuroimaging at the University of Oregon for technical assistance, and Matthew Rabel for editorial assistance.
Contributor Information
Jacqueline Bruce, Oregon Social Learning Center.
Philip A. Fisher, University of Oregon and Oregon Social Learning Center
Alice M. Graham, University of Oregon
William E. Moore, III, University of Oregon.
Shannon J. Peake, University of Oregon
Anne M. Mannering, Oregon State University
References
- Achenbach TM. Manual for the Child Behavior Checklist/4–18 and 1991 profile. Burlington, VT: University of Vermont, Department of Psychiatry; 1991. [Google Scholar]
- Arnsten AFT. Stress signalling pathways that impair prefrontal cortex structure and function. Nature Reviews Neuroscience. 2009;10:410–422. doi: 10.1038/nrn2648. [DOI] [PMC free article] [PubMed] [Google Scholar]
- Beckmann CF, Jenkinson M, Woolrich MW, Behrens TEJ, Flitney DE, Devlin JT, Smith SM. Applying FSL to the FIAC data: Model-based and model-free analysis of voice and sentence repetition priming. Human Brain Mapping. 2006;27:380–391. doi: 10.1002/hbm.20246. [DOI] [PMC free article] [PubMed] [Google Scholar]
- Beers SR, De Bellis MD. Neuropsychological function in children with maltreatment-related posttraumatic stress disorder. American Journal of Psychiatry. 2002;159:483–486. doi: 10.1176/appi.ajp.159.3.483. [DOI] [PubMed] [Google Scholar]
- Behen ME, Muzik O, Saporta ASD, Wilson BJ, Pai D, Hua J, Chugani HT. Abnormal fronto-striatal connectivity in children with histories of early deprivation: A diffusion tensor imaging study. Brain Imaging and Behavior. 2009;3:292–297. doi: 10.1007/s11682-009-9071-6. [DOI] [PMC free article] [PubMed] [Google Scholar]
- Black JE. How a child builds its brain: Some lessons from animal studies of neural plasticity. Preventive Medicine. 1998;27:168–171. doi: 10.1006/pmed.1998.0271. [DOI] [PubMed] [Google Scholar]
- Blair C, Razza RP. Relating effortful control, executive function, and false belief understanding to emerging math and literacy ability in kindergarten. Child Development. 2007;78:647–663. doi: 10.1111/j.1467-8624.2007.01019.x. [DOI] [PubMed] [Google Scholar]
- Botvinick MM, Braver TS, Barch DM, Carter CS, Cohen JD. Conflict monitoring and cognitive control. Psychological Review. 2001;108:624–652. doi: 10.1037/0033-295x.108.3.624. [DOI] [PubMed] [Google Scholar]
- Braet W, Johnson KA, Tobin CT, Acheson R, Bellgrove MA, Robertson IH, Garavan H. Functional developmental changes underlying response inhibition and error-detection processes. Neuropsychologia. 2009;47:3143–3151. doi: 10.1016/j.neuropsychologia.2009.07.018. [DOI] [PubMed] [Google Scholar]
- Brett M. MarsBaR documentation. 2011 Retreived November 28, 2011, from http://marsbar.sourceforge.net/marsbar.pdf.
- Bruce J, McDermott JM, Fisher PA, Fox NA. Using behavioral and electrophysiological measures to assess the effects of a preventive intervention: A preliminary study with preschool-aged foster children. Prevention Science. 2009;10:129–140. doi: 10.1007/s11121-008-0115-8. [DOI] [PMC free article] [PubMed] [Google Scholar]
- Bunge SA, Dudukovic NM, Thomason ME, Vaidya CJ, Gabrieli JDE. Immature frontal lobe contributions to cognitive control in children: Evidence from fMRI. Neuron. 2002;33:301–311. doi: 10.1016/s0896-6273(01)00583-9. [DOI] [PMC free article] [PubMed] [Google Scholar]
- Carrion VG, Weems CF, Eliez S, Patwardhan A, Brown W, Ray RD, Reiss AL. Attenuation of frontal asymmetry in pediatric postraumatic stress disorder. Biological Psychiatry. 2001;50:943–951. doi: 10.1016/s0006-3223(01)01218-5. [DOI] [PubMed] [Google Scholar]
- Casey BJ, Castellanos FX, Giedd JN, Marsh WL, Hamburger SD, Schubert AB, Rapoport JL. Implication of right frontostriatal circuitry in response inhibition and attention-deficit/hyperactivity disorder. Journal of the American Academy of Child and Adolescent Psychiatry. 1997;36:374–383. doi: 10.1097/00004583-199703000-00016. [DOI] [PubMed] [Google Scholar]
- Casey BJ, Tottenham N, Fossella J. Clinical, imaging, lesion, and genetic approaches toward a model of cognitive control. Developmental Psychobiology. 2002;40:237–254. doi: 10.1002/dev.10030. [DOI] [PubMed] [Google Scholar]
- Casey BJ, Trainor RJ, Giedd JN, Vauss YC, Vaituzis AC, Hamburger SD, Rapoport JL. The role of the anterior cingulate in automatic and controlled processes: A developmental neuroanatomical study. Developmental Psychobiology. 1997;3:61–69. [PubMed] [Google Scholar]
- Clausen JM, Landsverk J, Ganger W, Chadwick D, Litrownik A. Mental health problems of children in foster care. Journal of Child and Family Studies. 1998;7:283–296. [Google Scholar]
- Dale AM. Optimal experimental design for event-related fMRI. Human Brain Mapping. 1999;8:109–114. doi: 10.1002/(SICI)1097-0193(1999)8:2/3<109::AID-HBM7>3.0.CO;2-W. [DOI] [PMC free article] [PubMed] [Google Scholar]
- Davis EP, Bruce J, Snyder K, Nelson CA. The X-trials: Neural correlates of an inhibitory control task in children and adults. Journal of Cognitive Neuroscience. 2003;15:432–443. doi: 10.1162/089892903321593144. [DOI] [PubMed] [Google Scholar]
- De Bellis MD. Developmental traumatology: The psychobiological development of maltreated children and its implications for research, treatment, and policy. Development and Psychopathology. 2001;13:539–564. doi: 10.1017/s0954579401003078. [DOI] [PubMed] [Google Scholar]
- De Bellis MD, Keshavan MS, Spencer S, Hall J. N-acetylaspartate concentration in the anterior cingulate of maltreated children and adolescents with PTSD. American Journal of Psychiatry. 2000;157:1175–1177. doi: 10.1176/appi.ajp.157.7.1175. [DOI] [PubMed] [Google Scholar]
- dosReis S, Zito JM, Safer DJ, Soeken KL. Mental health services for youths in foster care and disabled youths. American Journal of Public Health. 2001;91:1094–1099. doi: 10.2105/ajph.91.7.1094. [DOI] [PMC free article] [PubMed] [Google Scholar]
- Durston S, Davidson MC, Tottenham N, Galvan A, Spicer J, Fossella JA, Casey BJ. A shift from diffuse to focal cortical activity with development. Developmental Science. 2006;9:1–8. doi: 10.1111/j.1467-7687.2005.00454.x. [DOI] [PubMed] [Google Scholar]
- Durston S, Mulder M, Casey BJ, Ziermans T, van Engeland H. Activation in ventral prefrontal cortex is sensitive to genetic vulnerability for attention-deficit hyperactivity disorder. Biological Psychiatry. 2006;60:1062–1070. doi: 10.1016/j.biopsych.2005.12.020. [DOI] [PubMed] [Google Scholar]
- Durston S, Thomas KM, Worden MS, Yang Y, Casey BJ. The effect of preceding context on inhibition: An event-related fMRI study. NeuroImage. 2002;16:449–453. doi: 10.1006/nimg.2002.1074. [DOI] [PubMed] [Google Scholar]
- Durston S, Thomas KM, Yang Y, Ulug AM, Zimmerman RD, Casey BJ. A neural basis for the development of inhibitory control. Developmental Science. 2002;5:F9, F16. [Google Scholar]
- Durston S, Tottenham N, Thomas KM, Davidson MC, Eigsti IM, Yang Y, Casey BJ. Differential patterns of striatal activation in young children with and without ADHD. Biological Psychiatry. 2003;53:871–878. doi: 10.1016/s0006-3223(02)01904-2. [DOI] [PubMed] [Google Scholar]
- Eigsti IM, Zayas V, Mischel W, Shoda Y, Ayduk O, Dadlani MB, Casey BJ. Predicting cognitive control from preschool to late adolescence and young adulthood. Psychological Science. 2006;17:478–484. doi: 10.1111/j.1467-9280.2006.01732.x. [DOI] [PubMed] [Google Scholar]
- Eisenberg N, Fabes RA, Shepard SA, Murphy BC, Guthrie IK, Jones S, Maszk P. Contemporaneous and longitudinal prediction of children’s social functioning from regulation and emotionality. Child Development. 1997;68:642–664. [PubMed] [Google Scholar]
- Fishbein D. The importance of neurobiological research to the prevention of psychopathology. Prevention Science. 2000;1:89–106. doi: 10.1023/a:1010090114858. [DOI] [PubMed] [Google Scholar]
- Garavan H, Ross TJ, Kaufman K, Stein EA. A midline dissociation between error-processing and response-conflict monitoring. NeuroImage. 2003;20:1132–1139. doi: 10.1016/S1053-8119(03)00334-3. [DOI] [PubMed] [Google Scholar]
- Garland AF, Hough RL, McCabe KM, Yeh M, Wood PA, Aarons GA. Prevalence of psychiatric disorders in youths across five sectors of care. Journal of the American Academy of Child and Adolescent Psychiatry. 2001;40:409–418. doi: 10.1097/00004583-200104000-00009. [DOI] [PubMed] [Google Scholar]
- Gerstadt CL, Hong YJ, Diamond A. The relationship between cognition and action: Performance of children 3 1/2 – 7 years old on a Stroop-like day-night test. Cognition. 1994;53:129–153. doi: 10.1016/0010-0277(94)90068-x. [DOI] [PubMed] [Google Scholar]
- Ghashghaei HT, Barbas H. Pathways for emotion: Interactions of prefrontal and anterior temporal pathways in the amygdala of the rhesus monkey. Neuroscience. 2002;115:1261–1279. doi: 10.1016/s0306-4522(02)00446-3. [DOI] [PubMed] [Google Scholar]
- Gogtay N, Giedd JN, Lusk L, Hayashi KM, Greenstein D, Vaituzis AC, Thompson PM. Dynamic mapping of human cortical development during childhood through early adulthood. Proceedings of the National Academy of Sciences. 2004;101:8174–8179. doi: 10.1073/pnas.0402680101. [DOI] [PMC free article] [PubMed] [Google Scholar]
- Gunnar MR, Fisher PA the Early Experience Stress Prevention Network. Bringing basic research on early experience and stress neurobiology to bear on preventive interventions for neglected and maltreated children. Development and Psychopathology. 2006;18:651–677. [PubMed] [Google Scholar]
- Helmeke C, Seidel K, Poeggel G, Bredy TW, Abraham A, Braun K. Paternal deprivation during infancy results in dendrite- and time-specific changes of dendritic development and spine formation in the orbitofrontal cortex of the biparental rodent Octodon degus. Neuroscience. 2009;163:790–798. doi: 10.1016/j.neuroscience.2009.07.008. [DOI] [PubMed] [Google Scholar]
- Herman JP, Ostrander MM, Mueller NK, Figueiredo H. Limbic system mechanisms of stress regulation: Hypothalamo-pituitary-adrenocortical axis. Progress in Neuropsychopharmacology and Biological Psychiatry. 2005;29:1201–1213. doi: 10.1016/j.pnpbp.2005.08.006. [DOI] [PubMed] [Google Scholar]
- Hester R, Fassbender C, Garavan H. Individual differences in error processing: A review and reanalysis of three event-related fMRI studies using the GO/NOGO task. Cerebral Cortex. 2004;14:986–994. doi: 10.1093/cercor/bhh059. [DOI] [PubMed] [Google Scholar]
- Holmes A, Wellman CL. Stress-induced prefrontal reorganization and executive dysfunction in rodents. Neuroscience and Biobehavioral Reviews. 2009;33:773–783. doi: 10.1016/j.neubiorev.2008.11.005. [DOI] [PMC free article] [PubMed] [Google Scholar]
- Karayanidis F, Robaey P, Bourassa M, De Koning D, Geoffroy G, Pelletier G. ERP differences in visual attention processing between attention-deficit hyperactivity disorder and control boys in the absence of preformance differences. Psychophysiology. 2000;37:319–333. [PubMed] [Google Scholar]
- Kessler RC, Pecora PJ, Williams J, Hiripi E, O’Brien K, English D, Sampson NA. Effects of enhanced foster care on the long-term physical and mental health of foster care alumni. Archives of General Psychiatry. 2008;65:625–633. doi: 10.1001/archpsyc.65.6.625. [DOI] [PubMed] [Google Scholar]
- Kochanska G, Murray K, Coy KC. Inhibitory control as a contributor to conscience in childhood: From toddler to early school age. Child Development. 1997;68:263–277. [PubMed] [Google Scholar]
- Kochanska G, Murray K, Jacques TY, Koenig AL, Vandegeest K. Inhibitory control in young children and its role in emerging internalization. Child Development. 1996;67:490–507. [PubMed] [Google Scholar]
- Kochanska G, Murray KT, Harlan ET. Effortful control in early childhood: Continuity and change, antecedents, and implications for social development. Developmental Psychology. 2000;36:220–232. [PubMed] [Google Scholar]
- Lengua LJ, Honorado E, Bush NR. Contextual risk and parenting as predictors of effortful control and social competence in preschool children. Journal of Applied Developmental Psychology. 2007;28:40–55. doi: 10.1016/j.appdev.2006.10.001. [DOI] [PMC free article] [PubMed] [Google Scholar]
- Leslie LK, Gordon JN, Ganger W, Gist K. Developmental delay in young children in child welfare by initial placement type. Infant Mental Health Journal. 2002;23:496–516. doi: 10.1097/00004703-200506000-00003. [DOI] [PMC free article] [PubMed] [Google Scholar]
- Lewis E, Dozier M, Ackerman J, Sepulveda-Kozakowski S. The effect of caregiving instability on adopted children’s inhibitory control abilities and oppositional behavior. Developmental Psychology. 2007;43:1415–1427. doi: 10.1037/0012-1649.43.6.1415. [DOI] [PubMed] [Google Scholar]
- Liddle PF, Kiehl KA, Smith AM. Event-related fMRI study of response inhibition. Human Brain Mapping. 2001;12:100–109. doi: 10.1002/1097-0193(200102)12:2<100::AID-HBM1007>3.0.CO;2-6. [DOI] [PMC free article] [PubMed] [Google Scholar]
- Liu TT, Frank LR. Efficiency, power, and entropy in event-related fMRI with multiple trial types Part I: Theory. NeuroImage. 2004;21:387–400. doi: 10.1016/j.neuroimage.2003.09.030. [DOI] [PubMed] [Google Scholar]
- McClelland MM, Cameron CE, Connor CM, Farris CL, Jewkes AM, Morrison FJ. Links between behavioral regulation and preschoolers’ literacy, vocabulary, and math skills. Developmental Psychology. 2007;43:947–959. doi: 10.1037/0012-1649.43.4.947. [DOI] [PubMed] [Google Scholar]
- Menon V, Adleman NE, White CD, Glover GH, Reiss AL. Error-related brain activation during a Go/NoGo response inhibition task. Human Brain Mapping. 2001;12:131–143. doi: 10.1002/1097-0193(200103)12:3<131::AID-HBM1010>3.0.CO;2-C. [DOI] [PMC free article] [PubMed] [Google Scholar]
- Office of Applied Studies in the Substance Abuse and Mental Health Services Administration. The National Survey on Drug Use and Health: Substance use and need for treatment among youths who have been in foster care. Rockville, MD: Author; 2005. [Google Scholar]
- Pears KC, Bruce J, Fisher PA, Kim HK. Indiscriminate friendliness in maltreated foster children. Child Maltreatment. 2010;15:64–75. doi: 10.1177/1077559509337891. [DOI] [PMC free article] [PubMed] [Google Scholar]
- Pears KC, Capaldi DM, Owen LD. Substance use risk across three generations: The roles of parent discipline practices and inhibitory control. Psychology of Addictive Behaviors. 2007;21:373–386. doi: 10.1037/0893-164X.21.3.373. [DOI] [PMC free article] [PubMed] [Google Scholar]
- Pears KC, Fisher PA. Developmental, cognitive, and neuropsychological functioning in preschool-aged foster children: Associations with prior maltreatment and placement history. Developmental and Behavioral Pediatrics. 2005;26:112–122. doi: 10.1097/00004703-200504000-00006. [DOI] [PubMed] [Google Scholar]
- Pears KC, Fisher PA, Bruce J, Kim HK, Yoerger K. Early elementary school adjustment of maltreated children in foster care: The roles of inhibitory control and caregiver involvement. Child Development. 2010;81:1550–1564. doi: 10.1111/j.1467-8624.2010.01491.x. [DOI] [PMC free article] [PubMed] [Google Scholar]
- Pilowsky D. Psychopathology among children placed in family foster care. Psychiatric Services. 1995;46:906–910. doi: 10.1176/ps.46.9.906. [DOI] [PubMed] [Google Scholar]
- Pliszka SR, Glahn DC, Semrud-Clikeman M, Franklin C, Perez RI, Xiong J, Liotti M. Neuroimaging of inhibitory control areas in children with attention deficit hyperactivity disorder who were treatment naive or in long-term treatment. American Journal of Psychiatry. 2006;163:1052–1060. doi: 10.1176/ajp.2006.163.6.1052. [DOI] [PubMed] [Google Scholar]
- Ridderinkhof KR, van der Molan MW, Band GPH, Bashore TR. Sources of interference from irrelevant information: A developmental study. Journal of Experimental Child Psychology. 1997;65:315–341. doi: 10.1006/jecp.1997.2367. [DOI] [PubMed] [Google Scholar]
- Rubia K, Smith AB, Brammer MJ, Taylor E. Right inferior prefrontal cortex mediates response inhibition while mesial prefrontal cortex is responsible for error detection. NeuroImage. 2003;20:351–358. doi: 10.1016/s1053-8119(03)00275-1. [DOI] [PubMed] [Google Scholar]
- Rubia K, Smith AB, Taylor E, Brammer M. Linear age-correlated functional development of right inferior fronto-striato-cerebellar networks during response inhibition and anterior cingulate during error-related processes. Human Brain Mapping. 2007;28:1163–1177. doi: 10.1002/hbm.20347. [DOI] [PMC free article] [PubMed] [Google Scholar]
- Rubia K, Smith AB, Woolley J, Nosarti C, Heyman I, Taylor E, Brammer M. Progressive increase of frontostriatal brain activation from childhood to adulthood during event-related tasks of cognitive control. Human Brain Mapping. 2006;27:973–993. doi: 10.1002/hbm.20237. [DOI] [PMC free article] [PubMed] [Google Scholar]
- Smith SM. Fast robust automated brain extraction. Human Brain Mapping. 2002;17:143–155. doi: 10.1002/hbm.10062. [DOI] [PMC free article] [PubMed] [Google Scholar]
- Smith S, Bannister PR, Beckmann C, Brady M, Clare S, Flitney DH, Zhang Y. FSL: New tools for functional and structural brain image analysis. NeuroImage. 2001;13:S249. [Google Scholar]
- Song XW, Dong ZY, Long XY, Li SF, Zuo XN, Zhu CZ, Zang YF. REST: A Toolkit for Resting-State Functional Magnetic Resonance Imaging Data Processing. Public Library of Science ONE. 2011;6:e25031. doi: 10.1371/journal.pone.0025031. [DOI] [PMC free article] [PubMed] [Google Scholar]
- Sowell ER, Thompson PM, Leonard CM, Welcome SE, Kan E, Toga AW. Longitudinal mapping of cortical thickness and brain growth in normal children. Journal of Neuroscience. 2004;24:8223–8231. doi: 10.1523/JNEUROSCI.1798-04.2004. [DOI] [PMC free article] [PubMed] [Google Scholar]
- Stein E. Teachers’ assessments of children in foster care. Developmental Disabilities Bulletin. 1997;25:1–17. [Google Scholar]
- Sullivan RM, Gratton A. Prefrontal cortical regulation of hypothalamic-pituitary-adrenal function in the rat and implications for psychopathology: Side matters. Psychoneuroendocrinology. 2002;27:99–114. doi: 10.1016/s0306-4530(01)00038-5. [DOI] [PubMed] [Google Scholar]
- Tamm L, Menon V, Reiss AL. Maturation of brain function associated with response inhibition. Journal of the American Academy of Child and Adolescent Psychiatry. 2002;41:1231–1238. doi: 10.1097/00004583-200210000-00013. [DOI] [PubMed] [Google Scholar]
- Tarter RE, Kirisci L, Mezzich A, Cornelius JR, Pajer K, Vanyukov M, Clark D. Neurobehavioral disinhibition in childhood predicts early age at onset of substance use disorder. American Journal of Psychiatry. 2003;160:1078–1085. doi: 10.1176/appi.ajp.160.6.1078. [DOI] [PubMed] [Google Scholar]
- Thatcher RW, Walker RA, Giudice S. Human cerebral hemispheres develop at different rates and ages. Science. 1987;236:1110–1113. doi: 10.1126/science.3576224. [DOI] [PubMed] [Google Scholar]
- Thesen S, Heid O, Mueller E, Schad LR. Prospective acquisition correction for head motion with image-based tracking for real-time fMRI. Magnetic Resonance in Medicine. 2000;44:457–465. doi: 10.1002/1522-2594(200009)44:3<457::aid-mrm17>3.0.co;2-r. [DOI] [PubMed] [Google Scholar]
- Toupin J, Déry M, Pauzé R, Mercier H, Fortin L. Cognitive and familial contributions to conduct disorder in children. Journal of Child Psychology and Psychiatry. 2000;41:333–344. [PubMed] [Google Scholar]
- U.S. Department of Health and Human Services. The AFCARS Report: Preliminary FY 2010 estimates as of July 2011. Washington, DC: Author; 2011. [Google Scholar]
- Valiente C, Lemery-Chalfant K, Reiser M. Pathways to problem behaviors: Chaotic homes, parent and child effortful control, and parenting. Social Development. 2007;16:249–267. [Google Scholar]
- van Veen V, Carter CS. The timing of action-monitoring processes in the anterior cingulate cortex. Journal of Cognitive Neuroscience. 2002;14:593–602. doi: 10.1162/08989290260045837. [DOI] [PubMed] [Google Scholar]
- Vaughn MG, Ollie MT, McMillen JC, Scott L, Munson M. Substance use and abuse among older youth in foster care. Addictive Behaviors. 2007;32:1929–1935. doi: 10.1016/j.addbeh.2006.12.012. [DOI] [PMC free article] [PubMed] [Google Scholar]
- Zhou Q, Eisenberg N, Wang Y, Reiser M. Chinese children’s effortful control and dispositional anger/frustration: Relations to parenting styles and children’s social functioning. Developmental Psychology. 2004;40:352–366. doi: 10.1037/0012-1649.40.3.352. [DOI] [PubMed] [Google Scholar]
- Zima BT, Bussing R, Freeman S, Yang X, Belin TR, Forness SR. Behavior problems, academic skill delays and school failure among school-aged children in foster care: Their relationship to placement characteristics. Journal of Child and Family Studies. 2000;9:87–103. [Google Scholar]