Abstract
Small-animal tumor models are essential for developing translational therapeutic strategies in oncology research, with imaging having an increasingly important role. Magnetic Resonance Imaging (MRI) offers tumor localization, volumetric measurement, and the potential for advanced physiologic imaging, but is less well suited to high throughput studies and has limited capacity to assess early tumor growth. Bioluminescence imaging (BLI) identifies tumors early, monitors tumor growth, and efficiently measures response to therapeutic intervention. Generally, BLI signals have been found to correlate well with MR measurements of tumor volume. However, in our studies of small-animal models of malignant brain tumors, we have observed specific instances in which BLI data do not correlate with corresponding MR images. These observations led us to hypothesize that use of BLI and MR imaging together, rather than in isolation, would allow more effective and efficient measures of tumor growth in preclinical studies. Herein, we describe combining BLI and MRI studies to characterize tumor growth in a mouse model of glioblastoma. Results lead us to suggest a cost-effective, multi-modality strategy for selecting cohorts of animals with similar tumor growth patterns that improves the accuracy of longitudinal in vivo measurements of tumor growth and treatment response in pre-clinical therapeutic studies.
Keywords: Bioluminescence Imaging (BLI), Magnetic Resonance Imaging (MRI), Small-animal imaging, Brain tumor, Tumor growth
Introduction
In oncology research, small-animal models are critical for the development of effective therapeutic strategies. The majority of rodent studies involve mice, due in large part to the ability to readily manipulate the murine genome. Mice are now used routinely to probe the effects of individual genes on tumor growth and development and in pre-clinical studies of new therapeutics. Methods to accurately monitor tumor growth and response to therapy in vivo are a key to the effectiveness of these pre-clinical investigations. This is particularly true for brain tumors. Intracranial models of brain tumors, in which tumor cell lines are implanted directly into the brain (1-4) or mice that are genetically engineered to spontaneously initiate tumor growth (5-7) are the most clinically relevant, since the tumor grows directly within the microenvironment of the brain itself. However, use of these models requires the development and application of methods to quantitatively measure intracranial tumor growth.
Non-invasive small-animal imaging can provide a solution to this challenging problem (1, 2, 8-12). Magnetic resonance imaging offers excellent anatomic tumor localization and accurate volumetric measurement (1, 9, 11) and is well-suited to longitudinal studies of tumor growth and therapeutic response. Experiments such as diffusion-weighted imaging (13-16), dynamic contrast imaging (17-21), and magnetic resonance spectroscopy (22, 23) afford insights into tumor biology extending beyond anatomic measures. In vivo bioluminescence is a valuable tool for monitoring the growth of small-animal tumor models, characterizing signaling pathways, and quantifying response to therapeutic intervention in large cohorts of animals (24-27) and its use has increased dramatically over the past ten years. The utility of BLI in neuro-oncology research has been discussed (28, 29) and BLI has proven particularly useful for studying small-animal models of brain tumors (4, 10, 30, 31).
One important factor in the success of small-animal pre-clinical studies is the selection of cohorts of animals having similar tumor growth patterns. Because of its ability to detect growing tumor early following implantation, BLI can be a valuable tool for this animal selection. MRI can also play an important role, as solid tumors of 1-2 mm in diameter can be detected and their growth measured quantitatively. While a number of studies have suggested a strong correlation between bioluminescence measurements and MR based calculations of tumor volumes (3, 4, 30, 32), only a small number of studies comparing BLI and MRI for characterizing tumor growth and response to therapy have been described (3, 4).
A second important factor in the success of small animal preclinical studies is having a surrogate, in vivo, marker for both tumor growth and for tumor regression in response to successful therapeutic interventions. Many investigators have suggested that BLI would be useful for testing investigational therapeutic agents. However, this use is dependent upon confirming that stabilization or regression of the BLI signal corresponds to a stabilization or diminution of tumor size.
In our laboratory, we are particularly interested in the diagnosis, staging and treatment of high-grade brain tumors, and have significant experience with malignant murine brain tumors using the DBT-FG-cell model. While not a perfect model of human glioblastoma, the DBT-FG-cell model has imaging, growth, and histopathologic features that are similar to high-grade gliomas (1), shows some degree of cellular infiltration, and displays genetic changes (e.g., loss of p53 and PTEN) similar to those seen in human tumors. In our experience with this model, we have observed specific instances where BLI data do not directly correlate with corresponding anatomic MR images. In this work, we describe a comprehensive, combined MRI/BLI study of tumor growth in the DBT-FG-cell model. Based on this study, we identify cautions that must be exercised in the interpretation of BLI or MRI data alone in the context of tumor growth and therapeutic response and describe a cost-effective, multi-modality imaging strategy for selecting cohorts of animals having similar tumor growth patterns.
Materials and Methods
Luciferase-Expressing Tumor Cell Line
The DBT glioblastoma cell line was originally generated from an intracranial tumor induced in an adult mouse after intra-cerebral injection of a Rous sarcoma virus. The DBT cell line used in these experiments was generously donated by Dr. Michael Lai, Department of Microbiology, University of Southern California. Transduction and maintenance of DBT-FG cells, a derivative tumor cell line transduced with a lentivirus for stable expression of both firefly luciferase and GFP, has been described (33, 34). Tumor cells were passaged for up to eight weeks, after which fresh cells were reinnoculated from frozen stock into media and cultured to minimize loss of the luciferase signal.
Intracranial Tumor Injections
Preparation of Cells for Injection
Feeding medium was aspirated from culture flasks containing DBT-FG cells grown to approximately 70% confluence. Cells were washed with DMEM, and then 3 ml of 0.5% trypsin – EDTA were added over one minute. After the cells were suspended, trypsin was inactivated by adding 7 ml DMEM containing 10% fetal calf serum. The suspended cells were centrifuged at 250 G for 10 minutes at 4 °C and re-suspended in 2 ml DMEM. An aliquot of cells was aspirated, stained with trypan blue dye, and counted with a hemocytometer. The cells were re-centrifuged and suspended in serum-free DMEM to a concentration of 10,000 DBT-FG cells/μl.
Animal Surgery
Adult female BALB/c mice weighing approximately 25 g were used in this study. All animal protocols were approved by the Washington University Division of Comparative Medicine and met or exceeded American Association for the Accreditation of Laboratory Animal Care International and National Institutes of Health standards. The mice were anesthetized by intraperitoneal injection of 25 mg/kg ketamine, 5 mg/kg xylazine, and 2.5 mg/kg acepromazine prior to intracranial implantation of DBT-FG cells. After a midline scalp incision, a craniostomy was created over the cortex with a 1-mm cutting burr. Mice were secured in a stereotactic frame and 5 μl of the DBT-FG tumor cell suspension (~50,000 cells) were aspirated into a Hamilton syringe attached to the frame, which was then passed into the brain. Tumor cells were injected into the striatum at a site 2 mm lateral and 2 mm posterior to the bregma and 4 mm deep to the cortical surface. After the needle was removed, the craniostomy was sealed with bone wax and the scalp was closed with super glue. Following surgery, mice were housed in non-barrier animal facilities for the duration of the imaging experiments. While animals with large brain tumors were more likely to die under anesthesia than healthy animals, mice were successfully and routinely imaged at multiple time points with both MR and BL imaging throughout this study.
In Vivo Bioluminescence Imaging (BLI)
Mice were injected intraperitoneally with 150 mg/kg of D-luciferin in PBS ten minutes prior to imaging. Imaging was performed using a charge-coupled device (CCD) camera (IVIS 100, Xenogen-Caliper, Alameda, CA; exposure times 1-120 s, binning 2-8, FOV 15 cm, f/stop 1, no filter). Mice were anesthetized with isoflurane (2% vaporized in O2) prior to and during imaging. Total photon flux (photons/sec) was measured from a fixed region-of-interest (ROI) over the skull using Living Image and IgorPro software (Wavemetrics, Portland, OR) as previously described (35).
Magnetic Resonance Imaging
Images were collected in an Oxford Instruments 4.7-Tesla magnet (33 cm, clear bore) equipped with 15-cm inner diameter, actively shielded gradient coils (maximum gradient, 18 G/cm; rise time, 100 μs). The magnet/gradients are interfaced with a Varian (Palo Alto, CA) INOVA console, and data were collected using a 1.5-cm OD surface coil (receive) and a 9-cm ID Helmholtz coil (transmit). Before the imaging experiments, mice were anesthetized with isoflurane/O2 [4% (v/v)], and maintained on isoflurane/O2 [1.5% (v/v)] throughout the experiments.
Mice were injected intraperitoneally with 500 μl Omniscan (Gadodiamide, GE Healthcare) contrast agent, diluted 1:10 in sterile saline, 15 minutes prior to being placed in the magnet. T1-weighted, gradient-echo multi-slice images (coronal and transaxial views) were collected (TR = .125 s, TE = .0025 s, FOV (transaxial) = 1.5 × 1.5 cm2, FOV (coronal) = 3 × 3 cm2, slice thickness = 0.5 mm). In addition, T2-weighted, multi-slice spin-echo transaxial images were collected for each animal (TR = 1.5 s; TE = .05 s; FOV = 1.5 × 1.5 cm2; thickness = 0.5 mm).
Quantitative Assessment of Tumor Volume (MRI)
For MR imaging studies, tumor volumes were measured by manually segmenting tumors using either Varian's ImageBrowser software or the public domain program ImageJ Image (http://rsb.info.nih.gov/ij). T2-weighted images were sometimes used to help clarify tumor margins. Anatomic abnormalities such as hemorrhage, hydrocephalus, or tumor necrosis were noted and their presence was correlated with optical signals.
Histological Analysis
Following the last day of imaging, mice were heavily sedated with isoflurane and perfused with 4% paraformaldehyde. Brains were removed from the mice and placed in 4% paraformaldehyde for 24 hours at 4°C. The brains were next placed in 70% alcohol for 48 hours and then cut into 2 mm sections for paraffin fixation. The paraffin embedded specimens were cut, again in the coronal plane, into 50 micrometer sections. These fixed specimens were stained with H&E and were correlated with corresponding MR images.
Results and Discussion
Magnetic resonance imaging is effective for measuring tumor growth and therapeutic response and calculations of intracranial tumor volumes from MR images correlate well with postmortem tumor volumes (11, 36). However, MRI is not well suited to high-throughput studies and cannot detect tumor growth early after implantation. For volumetric assays, bioluminescence imaging offers a valuable method for identifying tumors early after implantation (37), monitoring tumor growth (34), and measuring response to intervention (38, 39). Recently, the use of BLI for monitoring the effects of anti-vascular therapy in a breast-cancer xenograft model, emphasizing the importance of luciferin delivery to tumor, was described (40). Previous studies have also documented the linearity of BLI signal measured in vivo with respect to luciferase activity measured ex vivo (34, 41). Compared to MR imaging or other methods for assessing tumor growth in vivo, BLI experiments are quick and easy to perform and offer a relatively inexpensive and efficient method for high-throughput studies.
In this study, four groups of ten mice each were implanted with 50,000 DBT-FG cells constitutively expressing firefly luciferase and then serially imaged using both MRI and BLI. The first objective of the study, using the first twenty mice was to establish a correlation between bioluminescence signal and tumor volume using BLI and MRI over the time course of tumor growth. The second objective, using the second twenty mice was to determine whether early bioluminescence signal accurately predicted subsequent (exponential) tumor growth, and whether, conversely, those tumors showing exponential growth on MR imaging had longitudinal BLI signals that corresponded well to the MR growth curves.
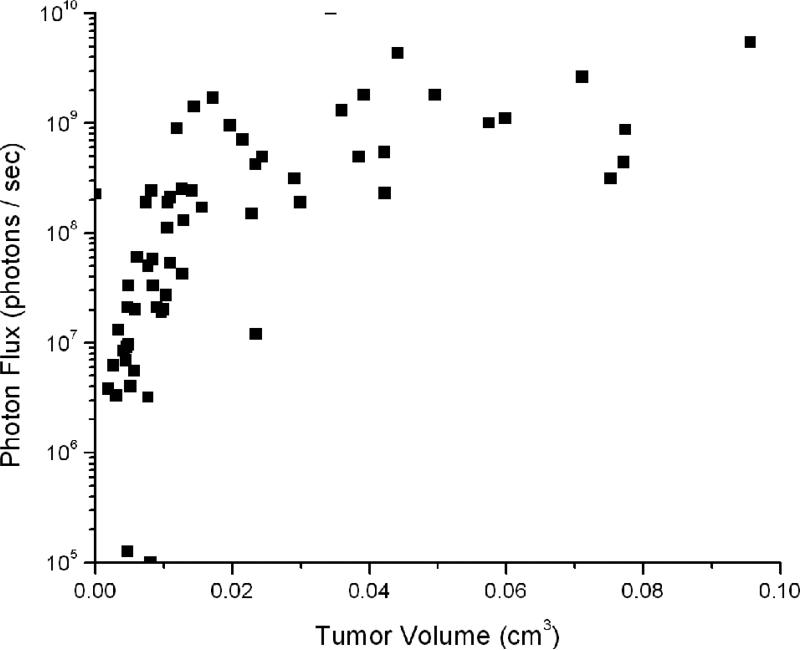
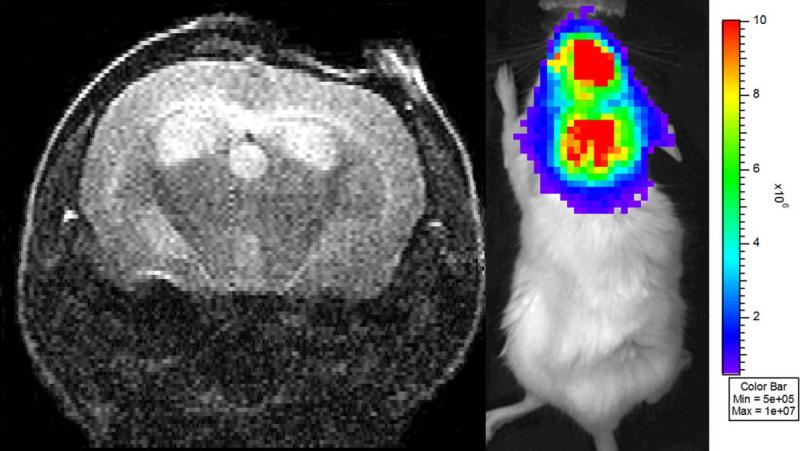
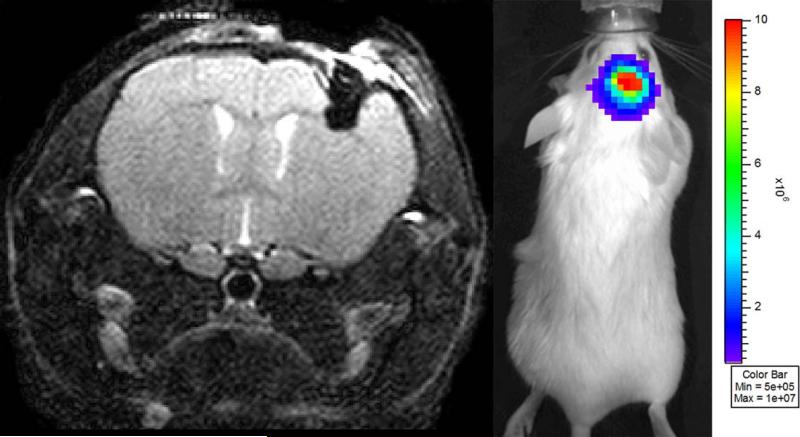
While the majority of the mice showed excellent correlation between tumor volumes as measured by MRI and quantitative BLI signal, particularly at the early stages of tumor growth (Figure 1), we found that at the extremes, (very low BLI signal or very large tumor volumes) this correlation was much weaker. We identified two particular situations in which mice without MRI-visible tumors had strong BLI signal: mice with hydrocephalus (Figure 2) and mice with intracranial hemorrhage (Figure 3). Significant tumor was not visible on MR images of any of these animals. Mice (n=2) with hydrocephalus survived to 13 and 14 days post tumor injection and had BLI growth curves consistent with exponential tumor growth. These mice deteriorated clinically in a similar fashion to animals with growing tumor. One mouse with an intracranial hematoma failed to deteriorate clinically and displayed BLI signal that initially increased exponentially in intensity and declined in the late stages of the experiment.
Figure 1.
BLI optical signal intensities are plotted vs. their corresponding MR-determined tumor volumes (in murine brain tumors generated by injection of luciferase bearing DBT-FG cells). While in the early stages of tumor growth, when tumors are less than 40 mm3, there is a strong correlation between tumor volume and BLI signal (R2=0.78), a significant loss of this correlation is seen once the tumors grow beyond 40 mm3 (R2=0.13).
Figure 2.
(A) Single slice from a series of transaxial, T2-weighted spin-echo MR images of a mouse injected with DBT-FG tumor cells. The mouse has high bioluminescence signal (2.3 × 10⁸ photons/second) but no significant solid tumor burden. Rather, this mouse displays extensive hydrocephalus and the high BLI signal is likely due to the presence of tumor cells in the cerebral spinal fluid (CSF). (B) BLI from this same animal, showing strong bioluminescence signal, indicative of viable, growing tumor cells. The signal is visualized diffusely over the brain, which may be indicative of the absence of a focal tumor source.
Figure 3.
(A) Single slice from a series of transaxial, T2-weighted spin-echo MR images of a mouse injected with DBT-FG tumor cells. The mouse has high optical signal (5.3 × 10⁷ photons/ second) within the intra-parenchymal hemorrhage (dark mass in the upper right portion of the brain) at the site of injection, but no visible intracranial tumor. (B) BLI from this same animal, showing strong bioluminescence signal, indicative of viable, growing tumor cells.
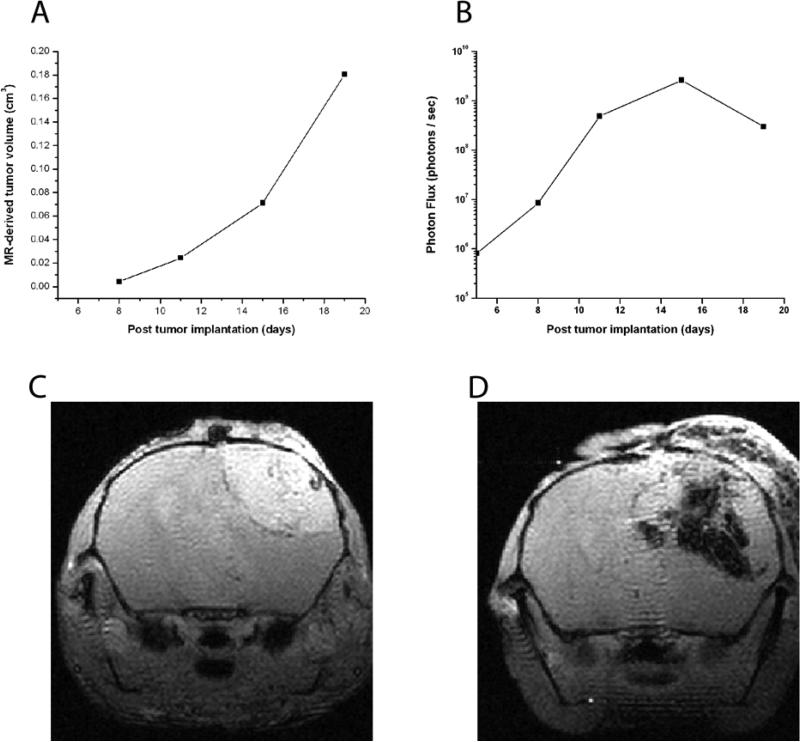
We noticed an additional discrepancy between BLI signal and MR measurement of tumor growth. At late stages of growth in animals with growing solid tumor, MR measurements showed steadily increasing volumes while optical signal tended to plateau. A similar effect, with in vivo BLI signal plateauing in large tumors, has been observed previously in a study of mouse liver (42). This late plateau is seen in the correlations between BLI signal and tumor volumes in Figure 1. A representative example of this discordance is demonstrated longitudinally and anatomically in Figure 4. This change is attributed to development of hemorrhage and necrosis within the tumor bed, a finding which was seen on both anatomic MR images (Figures 4C and 4D) and in histological specimens (Figure 5). Thus, BLI may reflect viable cell mass (34, 41, 43, 44), while MRI reflects overall tumor volume.
Figure 4.
(A) Exponential growth of a DBT-FG cell tumor as measured by MR volumetry. (B) Corresponding optical signal, measured on a logarithmic scale, for the same animal. The optical signal plateaus following the Day 15 measurement and drops modestly at later time points. The imaging time points at post implantation days 15 and 19 correlate to the MR images shown in Figures 5C and 5D. (C) Single slice from a series of transaxial, T1-weighted, gadolinium-enhanced, gradient echo images of mouse injected with DBT-FG tumor cells at post operative day 15. Note the significant enhancing solid tumor in the right hemisphere. (D) Single slice from a series of transaxial, T1-weighted, gadolinium-enhanced, gradient-echo images of the same mouse at post operative day 19. The enhancing solid tumor has increased in size significantly and is now accompanied by significant hemorrhage and necrotic material.
Figure 5.
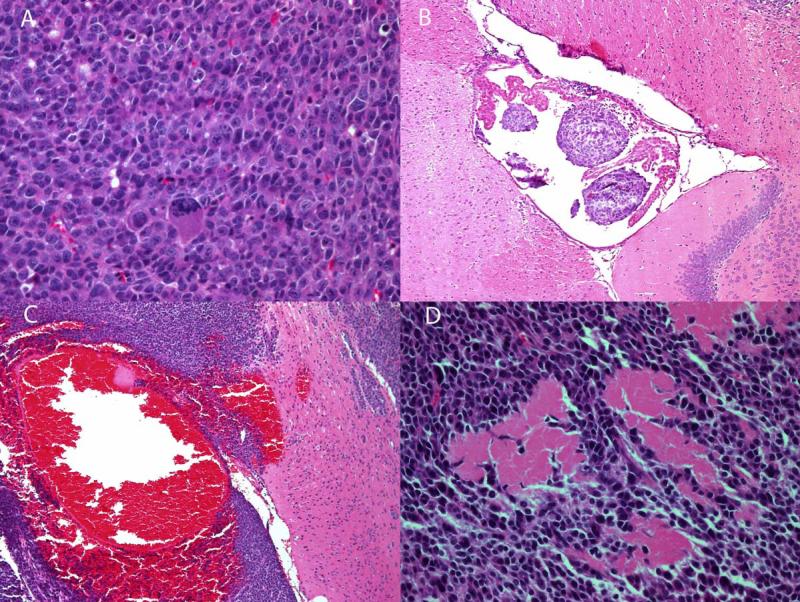
H&E stained slides of sections from mouse brain tumors. (A) Tumor tissue, showing high cellular density and several abnormally large nuclei; (B) Intra-ventricular tumor, the presence of which can obstruct the ventricle, thereby leading to the development of hydrocephalus within the brain; (C) Hemorrhagic tumor tissue; (D) Necrotic tumor tissue.
One of the major strengths of pre-clinical studies in animals is the ability to perfuse organs and perform subsequent histology and immunohistochemistry (IHC) staining. Such correlative histology/IHC provides insight into the cellular changes occurring within tumor tissue and can help to validate the results of imaging studies. Figure 5 illustrates examples of H & E stains from brains imaged in these studies. Figure 5 (A) shows tissue from a region of brain tumor; the tissue is characterized by high cellular density and several unusually large nuclei. This highly cellular tumor, with numerous, densely packed viable cells, is the setting where BLI signal would likely correlate well with MR volume. The presence of intra-ventricular tumor is illustrated in Figure 5 (B). Growth of intraventricular tumor, either within the CSF as isolated cells or in small clusters causing ventricular obstruction and hydrocephalus, offers an anatomic and biological explanation for the high BLI signal in the absence of intraparenchymal tumor seen in Figure 2. Figure 5 (C) shows tissue from a hemorrhagic region of brain, while necrotic tumor tissue is illustrated in Figure 5 (D). Each of these changes occurs late in the time course of tumor growth, and may show focally enhanced absorption of BLI signal or indicate a loss of viable tumor cells.
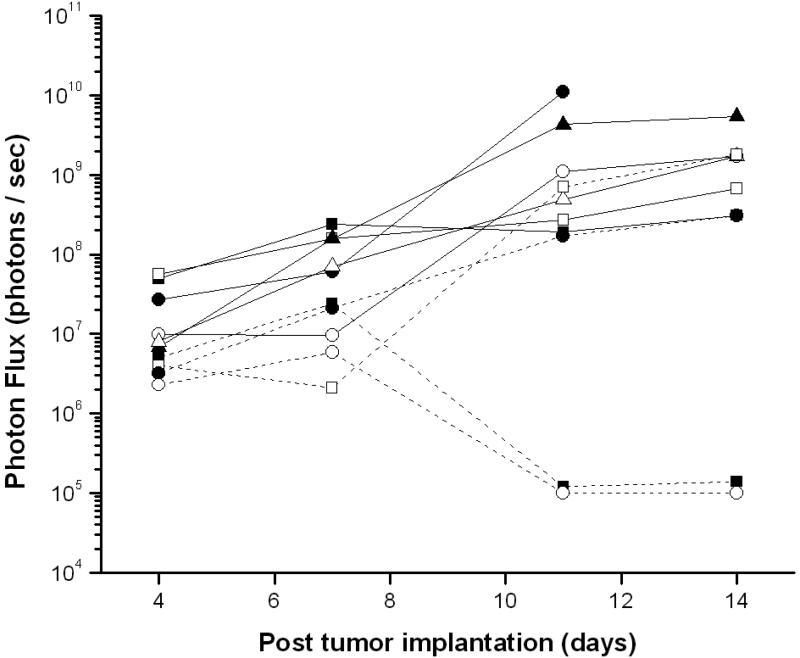
In a combined BLI/MRI study using another cohort of 20 mice, we tested the hypothesis that the presence and growth of BLI signals at early time points would be predictive of subsequent exponential tumor growth, and that those tumors that grew in a standard exponential pattern would all have BLI signals that longitudinally matched that growth. Serial BLI and MRI experiments were performed on all mice. After tumors had grown to the maximally tolerated size, animals whose MR-detected tumor growth was exponential were identified. The optical signals for each of these animals were reviewed retrospectively. We had expected that mice with exponential tumor growth by MR imaging would have optical growth curves similar to one another. However, we found a few examples of spontaneous diminution of luciferase signal (a finding noted in previous studies of luciferase tumor models (45)) that confounded our ability to reliably predict tumor growth from optical signal curves alone (Figure 6). Although the number of animals with spontaneous regression of BLI signal was small (n = 2), if this study had been a preclinical therapeutic response trial, these two animals, with progressive exponential growth in tumor size, would have, by BLI alone, been described as “responders”. This observation demonstrates the value of using BLI and MRI in combination to best evaluate tumor regression in pre-clinical therapeutic trials.
Figure 6.
BLI signal from a longitudinal study of ten mice, all of whom, based upon serial anatomic MR imaging studies, showed exponential growth of solid tumor without confounding hemorrhage or hydrocephalus. Two outliers, whose tumor growth was significant but whose optical signal declined early in the time course of growth, are noted.
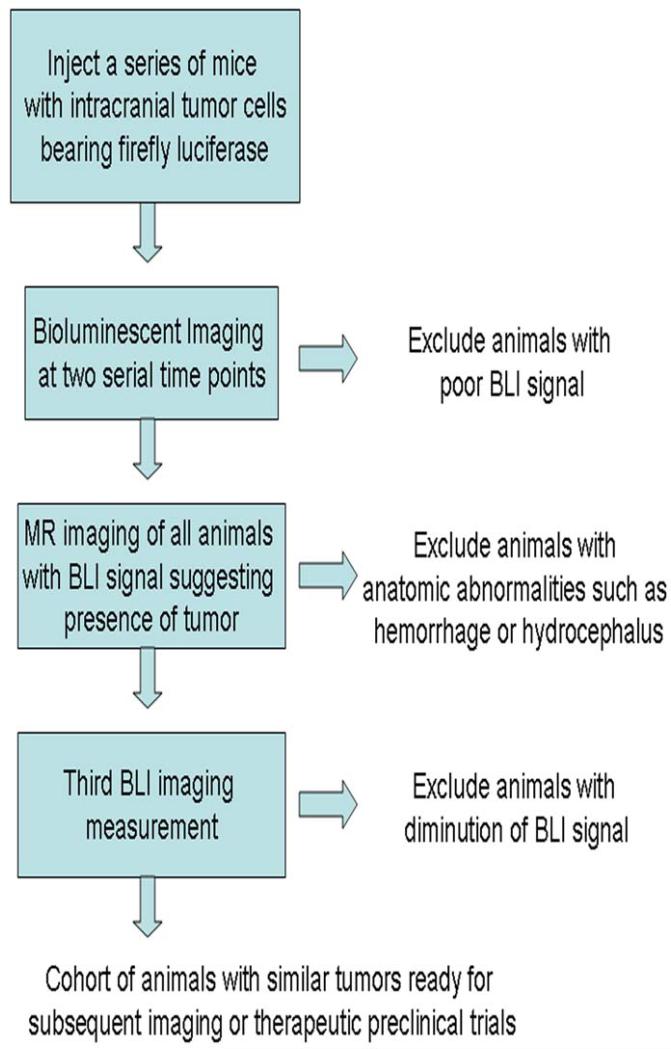
Our successes in using a combined BLI and MR imaging to measure tumor growth, along with the complementary information available with each imaging method, leads us to suggest a strategy for combining these two imaging modalities to identify and select animals for pre-clinical therapeutic studies. This multimodality strategy, designed to identify animals with similar tumor growth rates while limiting the impact of confounding factors such as hemorrhage, necrosis, and loss of luciferase signal, is summarized in the flow-chart in Figure 7. Methodologically, we propose beginning by injecting a group of animals larger than the intended study sample size with a luciferase bearing tumor cell line (e.g., for an intended sample size of 6 - 8 mice, we typically inject 10 mice). Animals are assessed shortly after implantation and serially using BLI semi-weekly or at appropriate time points based upon the anticipated growth rate of the chosen tumor cell line. Regular measurement of BLI signal permits us to match photon outputs across mice, thereby allowing us to select cohorts of animals having similar amounts of viable tumor-cell mass. In addition, all animals with visible BLI signal undergo standard anatomic MR imaging early in the course of the study to identify confounding anatomic features such as hemorrhage or hydrocephalus. Following multiple BLI scans and the single MR scan, animals with abnormal tumor growth patterns or unusual anatomical findings are excluded from subsequent preclinical experiments. In our experience, approximately 20% of animals initially injected with tumor cells would be eliminated from later preclinical studies by the strategy outlined in Figure 7.
Figure 7.
Schematic representation of proposed strategy for combining bioluminescent optical imaging and anatomic MR imaging to select cohorts of animals for pre-clinical trials.
The timing of the steps suggested in Figure 7 will vary depending upon the growth rate of the tumor cell line, the number of cells injected, and the elapsed time following injection of cells prior to initiation of treatment. In our previously published imaging study of BCNU chemotherapy in DBT-FG-cell tumors (1), tumors typically had grown to a volume of 20 – 30 mm3 at the time that treatment was initiated. The combination of anatomic MR imaging and BLI summarized in Figure 7 provides a multidisciplinary approach for selecting a subset of animals with similar patterns of tumor growth for subsequent imaging or therapeutic studies, while eliminating the confounding effects of hemorrhage or hydrocephalus. While we performed this study using the DBT-FG-cell tumor model, the methodology can be readily extended to include other glioma cell lines (e.g., U87 cells) that can be modified to stably express luciferase (34).
Although performing the MR scan adds a step to these studies, we have found that this additional set of scans does not significantly complicate the overall logistics of these experiments, nor, in centers where small-animal imaging is available, does it add dramatically to the cost. Indeed, by enabling efficient selection of cohorts of animals with similar tumor growth that are free of confounding anatomical features, we predict that this multi-modal approach will ultimately decrease both the number of animals and the number of scans needed to obtain meaningful results. Further, we suggest that adding periodic MR scans to longitudinal BLI at later stages of therapeutic studies will increase the role of imaging in assessing treatment efficacy by allowing measurement of both remaining viable tumor cell mass (BLI) and residual tumor volume/mass, including intratumoral regions of hemorrhage and necrosis (MRI). The two imaging modalities have the capacity to function synergistically, and each can offset the potential challenges of the other: BLI can identify early tumor growth and improve efficiency, and MRI can identify anatomic anomalies (hemorrhage, hydrocephalus, necrosis) and catch the rare instances of spontaneous BLI diminution. The combination of the two modalities will further increase the likelihood that useful information will be gleaned from imaging-based preclinical studies, allowing efficient translation to stage-1 human clinical trials.
Acknowledgments
We thank Dr. Neha Dahiya for assistance in reviewing the histology results. This work was supported by an NIH/NCI Small Animal Imaging Resource Program (SAIRP) grant (U24 CA83060), an NIH/NCI In vivo Cellular and Molecular Imaging Center (ICMIC) grant (P50 CA094056), and the Alvin J. Siteman Cancer Center at Washington University in St. Louis, an NCI Comprehensive Cancer Center (P30 CA91842).
References
- 1.Jost SC, Wanebo JE, Song SK, et al. Small Animal Imaging as a Tool for In Vivo Monitoring in a Murine Model for Glioblastoma. Neurosurgery. 2007;60:360–370. doi: 10.1227/01.NEU.0000249264.80579.37. [DOI] [PubMed] [Google Scholar]
- 2.Nelson A, Algon S, Munasinghe J, et al. Magnetic resonance imaging of patched heterozygous and xenografted mouse brain tumors. J Neurooncol. 2003;62:259–267. doi: 10.1023/a:1023339902812. [DOI] [PubMed] [Google Scholar]
- 3.Rhemtulla A, Stegman LD, Cardozo SJ, et al. Rapid and quantitative assessment of cancer treatment response using in vivo bioluminescence imaging. Neoplasia. 2000;2:491–495. doi: 10.1038/sj.neo.7900121. [DOI] [PMC free article] [PubMed] [Google Scholar]
- 4.Szentirmai O, Baker CH, Lin N, et al. Noninvasive bioluminescence imaging of luciferase expressing intracranial U87 xenografts: correlation with magnetic resonance imaging determined tumor volume and longitudinal use in assessing tumor growth and antiangiogenic treatment effect. Neurosurgery. 2006;58:365–372. doi: 10.1227/01.NEU.0000195114.24819.4F. [DOI] [PubMed] [Google Scholar]
- 5.Kwon CH, Zhao D, Chen J, et al. Pten haploinsufficiency accelerates formation of high-grade astrocytomas. Cancer Res. 2008;68:3286–94. doi: 10.1158/0008-5472.CAN-07-6867. [DOI] [PMC free article] [PubMed] [Google Scholar]
- 6.McConville P, Hambardzumyan D, Moody JB, et al. Magnetic resonance imaging determination of tumor grade and early response to temozolomide in a genetically engineered mouse model of glioma. Clin Cancer Res. 2007;13:2897–2904. doi: 10.1158/1078-0432.CCR-06-3058. [DOI] [PubMed] [Google Scholar]
- 7.Zhu Y, Guignard F, Zhao D, et al. Early inactivation of p53 tumor suppressor gene cooperating with NF1 loss induces malignant astrocytoma. Cancer Cell. 2005;8:119–30. doi: 10.1016/j.ccr.2005.07.004. [DOI] [PMC free article] [PubMed] [Google Scholar]
- 8.Adzamli K, Yablonskiy DA, Chicoine MR, et al. Albumin-binding MR blood pool agents as MRI contrast agents in an intracranial mouse glioma model. Magn Reson Med. 2003;49:586–590. doi: 10.1002/mrm.10382. [DOI] [PubMed] [Google Scholar]
- 9.Bock NA, Zadeh G, Davidson LM, et al. High-resolution longitudinal screening with magnetic resonance imaging on a murine brain cancer model. Neoplasia. 2003;5:546–554. doi: 10.1016/s1476-5586(03)80038-6. [DOI] [PMC free article] [PubMed] [Google Scholar]
- 10.Rustamzadeh E, Hall WA, Todhunter D, et al. Intracranial therapy of glioblastoma with the fusion protein DTIL13 in immunodeficient mice. Int J Cancer. 2006:118. doi: 10.1002/ijc.21647. [DOI] [PubMed] [Google Scholar]
- 11.Schmidt KF, Ziu M, Schmidt NO, et al. Volume reconstruction techniques improve the correlation between histological and in vivo tumor volume measurements in mouse models of human gliomas. J Neurooncol. 2004;68:207–215. doi: 10.1023/b:neon.0000033364.43142.bf. [DOI] [PubMed] [Google Scholar]
- 12.Sherburn EW, Wanebo JE, Kim P, et al. Gliomas in rodent whisker barrel cortex: a new tumor model. J Neurosurgery. 1999;91:814–821. doi: 10.3171/jns.1999.91.5.0814. [DOI] [PubMed] [Google Scholar]
- 13.Chenevert TL, Stegman LD, Taylor JM, et al. Diffusion MRI: Early Surrogate Marker of Therapeutic Efficacy. Journal of the NCI. 2000;92:2029–2036. doi: 10.1093/jnci/92.24.2029. [DOI] [PubMed] [Google Scholar]
- 14.Hall DE, Moffat BA, Stojanovska J, et al. Therapeutic efficacy of DTI-015 using diffusion magnetic resonance imaging as an early surrogate marker. Clin Cancer Res. 2004;10:7852–7859. doi: 10.1158/1078-0432.CCR-04-1218. [DOI] [PubMed] [Google Scholar]
- 15.Moffat BA, Chenevert TL, Lawrence TS, et al. Functional diffusion map: A noninvasive MRI biomarker for stratification of clinical brain tumor response. Proc Natl Acad Sci USA. 2005;102:5524–5529. doi: 10.1073/pnas.0501532102. [DOI] [PMC free article] [PubMed] [Google Scholar]
- 16.Yablonskiy DA, Bretthorst GL, Ackerman JJH. Statistical Model for Diffusion Attenuated MR Signal. Magn Reson Med. 2003;50:664–669. doi: 10.1002/mrm.10578. [DOI] [PMC free article] [PubMed] [Google Scholar]
- 17.Ah-See ML, Makris A, Taylor NJ, et al. Early changes in functional dynamic magnetic resonance imaging predict for pathologic response to neoadjuvant chemotherapy in primary breast cancer. Clin Cancer Res. 2008;14:6580–9. doi: 10.1158/1078-0432.CCR-07-4310. [DOI] [PubMed] [Google Scholar]
- 18.Barrett T, Brechbiel M, Bernardo M, et al. MRI of tumor angiogenesis. J Magn Reson Imaging. 2007;26:235–49. doi: 10.1002/jmri.20991. [DOI] [PubMed] [Google Scholar]
- 19.Huang W, Li X, Morris EA, et al. The magnetic resonance shutter speed discriminates vascular properties of malignant and benign breast tumors in vivo. Proc Natl Acad Sci U S A. 2008;105:17943–8. doi: 10.1073/pnas.0711226105. [DOI] [PMC free article] [PubMed] [Google Scholar]
- 20.Jackson A, O'Connor JP, Parker GJ, et al. Imaging tumor vascular heterogeneity and angiogenesis using dynamic contrast-enhanced magnetic resonance imaging. Clin Cancer Res. 2007;13:3449–59. doi: 10.1158/1078-0432.CCR-07-0238. [DOI] [PubMed] [Google Scholar]
- 21.Knopp MV, Giesel FL, Marcos H, et al. Dynamic contrast-enhanced magnetic resonance imaging in oncology. Top Magn Reson Imaging. 2001;12:301–8. doi: 10.1097/00002142-200108000-00006. [DOI] [PubMed] [Google Scholar]
- 22.Bernsen HJJA, Heerschap A, Kogel AJ, et al. Image-guided 1H NMR spectroscopical and histological characterization of a human brain tumor model in the nude rat; a new approach to monitor changes in tumor metabolism. J Neurooncol. 1992;13:119–130. doi: 10.1007/BF00172761. [DOI] [PubMed] [Google Scholar]
- 23.Howe FA, Barton SJ, Cudlip SA, et al. Metabolic profiles of human brain tumors using quantitative in vivo 1H magnetic resonance spectroscopy. Magn Reson Med. 2003;49:223–232. doi: 10.1002/mrm.10367. [DOI] [PubMed] [Google Scholar]
- 24.Contag CH, Jenkins D, Contag P, et al. Use of reporter genes for optical measurements of neoplastic disease in vivo. Neoplasia. 2000;2:41–51. doi: 10.1038/sj.neo.7900079. [DOI] [PMC free article] [PubMed] [Google Scholar]
- 25.Edinger M, Cao YA, Hornig YS, et al. Advancing animal models of neoplasia through in vivo bioluminescence imaging. Eur J Cancer. 2002;38:2128–2136. doi: 10.1016/s0959-8049(02)00410-0. [DOI] [PubMed] [Google Scholar]
- 26.Jenkins DE, Hornig YS, Oei Y, et al. Bioluminescent human breast cancer cell lines that permit rapid and sensitive in vivo detection of mammary tumors and multiple metastases in immune deficient mice. Breast Cancer Res. 2005;7:R444–R454. doi: 10.1186/bcr1026. [DOI] [PMC free article] [PubMed] [Google Scholar]
- 27.Gross S, D P W. Spying on cancer: molecular imaging in vivo with genetically encoded reporters. Cancer Cell. 2005;7:5–15. doi: 10.1016/j.ccr.2004.12.011. [DOI] [PubMed] [Google Scholar]
- 28.Paroo Z, Bollinger RA, Braasch DA, et al. Validating bioluminescence imaging as a high throughput, quantitative modality for assessing tumor burden. Mol Imaging. 2004;3:117–124. doi: 10.1162/15353500200403172. [DOI] [PubMed] [Google Scholar]
- 29.Soling A, Rainov NG. Biouminescence imaging in vivo: Application to cancer research. Expert Opin Biol Ther. 2003;3:1163–1172. doi: 10.1517/14712598.3.7.1163. [DOI] [PubMed] [Google Scholar]
- 30.Rubin JB, Kung AL, Klein RS, et al. A small-molecule antagonist of CXCR4 inhibits intracranial growth of primary brain tumors. Proc Natl Acad Sci USA. 2003;100:13513–13518. doi: 10.1073/pnas.2235846100. [DOI] [PMC free article] [PubMed] [Google Scholar]
- 31.Soling A, Theiss C, Jungmichel S, et al. A dual function fusion protein of Herpes simplex virus type 1 thymidine kinase and firefly luciferase for noninvasive in vivo imaging of gene therapy in malignant glioma. Genet Vaccines Ther. 2004;2:7. doi: 10.1186/1479-0556-2-7. [DOI] [PMC free article] [PubMed] [Google Scholar]
- 32.Dinca EB, Sarkaria JN, Schroeder MA, et al. Bioluminescence monitoring of intracranial glioblastoma xenograft: response to primary and salvage temozolomide therapy. J Neurosurg. 2007;107:610–616. doi: 10.3171/JNS-07/09/0610. [DOI] [PubMed] [Google Scholar]
- 33.Yuan L, Siegel M, Choi K, et al. Transglutaminase 2 inhibitor, KCC009, disrupts fibronectin assembly in the extracellular matrix and sensitizes orthotopic glioblastomas to chemotherapy. Oncogene. 2007;26:2563–73. doi: 10.1038/sj.onc.1210048. [DOI] [PubMed] [Google Scholar]
- 34.Goldhoff P, Warrington NM, Limbrick DD, Jr., et al. Targeted inhibition of cyclic AMP phosphodiesterase-4 promotes brain tumor regression. Clin Cancer Res. 2008;14:7717–25. doi: 10.1158/1078-0432.CCR-08-0827. [DOI] [PMC free article] [PubMed] [Google Scholar]
- 35.Gross S, Piwnica-Worms D. Monitoring proteasome activity in cellulo and in living animals by bioluminescent imaging: technical considerations for design and use of genetically encoded reporters. Methods Enzymol. 2005;399:512–30. doi: 10.1016/S0076-6879(05)99035-6. [DOI] [PubMed] [Google Scholar]
- 36.Cornelissen B, Kersemans V, Staelens J, et al. Comparison between 1 T MRI and non-MRI based volumetry in inoculated tumours in mice. Br J Radiol. 2005;78:338–342. doi: 10.1259/bjr/20260420. [DOI] [PubMed] [Google Scholar]
- 37.Edinger M, Sweeney TJ, Tucker AA, et al. Non-invasive assessment of tumor proliferation in animal models. Neoplasia. 1999;1:303–310. doi: 10.1038/sj.neo.7900048. [DOI] [PMC free article] [PubMed] [Google Scholar]
- 38.Uhrbom L, Nerio E, Holland EC. Dissecting tumor maintenance requirements using bioluminescence imaging of cell proliferation in a mouse glioma model. Nat Med. 2004;10:1257–60. doi: 10.1038/nm1120. [DOI] [PubMed] [Google Scholar]
- 39.Vooijs M, Jonkers J, Lyons S, et al. Noninvasive imaging of spontaneous retinoblastoma pathway-dependent tumors in mice. Cancer Res. 2002;62:1862–7. [PubMed] [Google Scholar]
- 40.Zhao D, Richer E, Antich PP, et al. Antivascular effects of combretastatin A4 phosphate in breast cancer xenograft assessed using dynamic bioluminescence imaging and confirmed by MRI. FASEB J. 2008;22:2445–51. doi: 10.1096/fj.07-103713. [DOI] [PMC free article] [PubMed] [Google Scholar]
- 41.Contag CH, Bachmann MH. Advances in in vivo bioluminescence imaging of gene expression. Annu Rev Biomed Eng. 2002;4:235–60. doi: 10.1146/annurev.bioeng.4.111901.093336. [DOI] [PubMed] [Google Scholar]
- 42.Sarraf-Yazdi S, Mi J, Dewhirst MW, et al. Use of in vivo bioluminescence imaging to predict hepatic tumor burden in mice. J Surg Res. 2004;120:249–55. doi: 10.1016/j.jss.2004.03.013. [DOI] [PubMed] [Google Scholar]
- 43.Piwnica-Worms D, Schuster DP, Garbow JR. Molecular imaging of host-pathogen interactions in intact small animals. Cell Microbiol. 2004;6:319–31. doi: 10.1111/j.1462-5822.2004.00379.x. [DOI] [PubMed] [Google Scholar]
- 44.El Hilali N, Rubio N, Blanco J. Different effect of paclitaxel on primary tumor mass, tumor cell contents, and metastases for four experimental human prostate tumors expressing luciferase. Clin Cancer Res. 2005;11:1253–8. [PubMed] [Google Scholar]
- 45.Brutkiewicz S, Mendonca M, Stantz K, et al. The expression level of luciferase within tumour cells can alter tumour growth upon in vivo bioluminescence imaging. Luminescence. 2007;22:221–228. doi: 10.1002/bio.953. [DOI] [PubMed] [Google Scholar]


