Abstract
We propose a cross-correlation-based method to measure blood flow velocity by using photoacoustic microscopy. Unlike in previous auto-correlation-based methods, the measured flow velocity here is independent of particle size. Thus, an absolute flow velocity can be obtained without calibration. We first measured the flow velocity ex vivo, using defibrinated bovine blood. Then, flow velocities in vessels with different structures in a mouse ear were quantified in vivo. We further measured the flow variation in the same vessel and at a vessel bifurcation. All the experimental results indicate that our method can be used to accurately quantify blood velocity in vivo.
With 100% absorption sensitivity, photoacoustic microscopy (PAM) has been widely used for structural and functional imaging in vasculature [1-6]. Among those functional studies, one of the major interests is flowmetry. Recently, various PAM-based methods have been used to detect flow velocity. These methods include photoacoustic Doppler (PAD) shift [7], time-domain photoacoustic (PA) autocorrelation [8], frequency-domain PAD bandwidth broadening [9], and a combination of Doppler shift with cross correlation [10-11]. Although all these methods show very promising flow measurement results, each still has limitations in different aspects. For example, in Doppler shift or Doppler shift combined methods, measurement results are sensitive to Doppler angles, and thus it is challenging to apply them for in vivo quantification of blood flow, where the Doppler angle usually approaches 90°. Although the time-domain PA autocorrelation and frequency-domain PAD bandwidth broadening methods have shown successful flow measurements in vivo, their results are influenced by the particle size, and calibrations are always required.
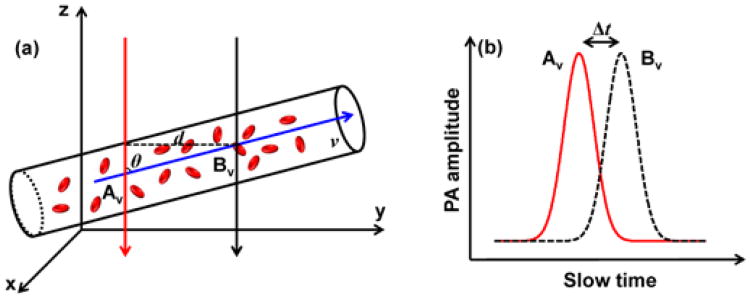
In this Letter, we report a calibration-free method to measure flow velocity in vivo based on cross-correlation of the slow-time PA amplitude profiles from PAM. The underlying principle of this method is that when the same group of red blood cells (RBCs) flows in the stream, the slow-time PA amplitude profiles measured at two close upstream and downstream spots have an identical shape. As shown schematically in Fig. 1(a), the same RBCs are detected at two spots, Av and Bv. The spatial distance d between these two spots can be quantified from the PA images of the vessel. As shown in Fig. 1(b), the generated slow-time PA amplitude profiles from Av and Bv have the same shape but with a time shift Δt, which can be extracted by cross correlating the two profiles. Thus, the flow velocity v of the RBCs can be calculated by
Fig. 1.
(a) Two laser beams (red and black arrows) illuminate the measurement area of a blood vessel alternately. The axes of the two beams are separated by distance d. (b) The slow-time PA profiles from Av and Bv are shifted in time by Δt.
| (1) |
where θ is the angle of the particle flow direction with respect to the detection (z) axis. The sign of the time shift Δt reports the flow direction. Thus, both the flow speed and direction can be obtained simultaneously from the cross-correlation-based method. In addition, based on Fig. 1(b) and Eq. (1), we can see that the flow velocity is independent of the shape of the PA amplitudes, which enables us to obtain an absolute flow velocity without calibration. We have reported phantom experimental results in a previous publication [12], where detailed analyses of the size-independent property, the maximum measurable velocity, and the minimum measurable velocity were presented. In this paper, we focus on ex vivo and in vivo demonstrations.
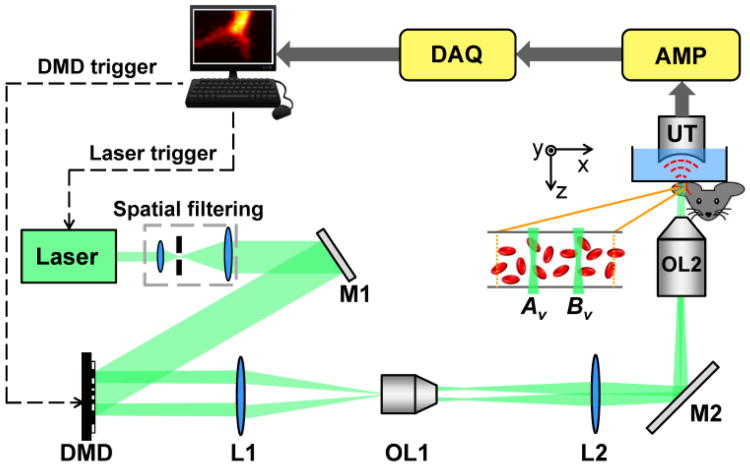
To achieve cross-correlation-based flow measurement, in this work, we used an optical-resolution PAM enhanced by a digital micromirror device (DMD) (Fig. 2). For a detailed description of this system, readers can refer to our previous work [12-13]. Briefly, a diode-pumped solid-state laser (INNOSLAB, Edgewave) generated laser pulses (10 ns pulse duration, 532 nm wavelength) with a repetition rate of 10 kHz. The laser beam passed through a spatial filter and then illuminated the DMD (.7XGA DDR Discovery™ 4100, Texas Instruments). Patterns loaded on the DMD were imaged into the target. A 50 MHz ultrasound transducer (V214-BB-RM, Olympus NDT Panametrics), with a 4.4 mm radius of curvature acoustic lens carved in its delay line, was used in our system. To fit the acoustic focus of the transducer, the field of view was set to 40 × 40 μm2.
Fig. 2.
System schematic, not to scale. AMP, signal amplifiers and filters; DAQ, data acquisition system; DMD, digital micromirror device; L1-L2, lenses; M1-M2, mirrors; OL1, objective lens (Mitutoyo, M PLAN APO 10×/0.28); OL2, objective lens (Olympus, LUCPlanFLN 40×/0.60); UT, ultrasound transducer.
The measurement was conducted in the following steps. First, a tissue region was raster scanned to identify the vessel of interest. Second, a pair of spots on the vessel was chosen for the flow velocity measurement. The distance d between them could be quantified from the raster scanned PA image. Finally, the two spots were illuminated alternately by turning on the corresponding micromirrors on the DMD. The slow-time PA profiles were obtained by taking the maximum amplitude projection—along the z axis—of a series of radiofrequency PA A-lines. The time courses of the slow-time PA profiles from these two spots were cross-correlated to extract the time shift Δt, and the flow velocity was calculated using Eq. (1).
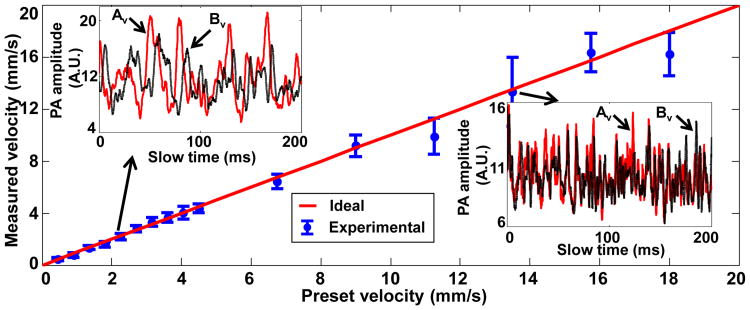
In an ex-vivo study, fresh defibrinated bovine blood (910-250, Quad Five) was driven through a straight plastic tube (60985-700, inner diameter = 300 μm, VWR) by a syringe pump (BSP-99M, Braintree Scientific), with flow velocities ranging from 0.45 to 18 mm/s. In the experiment, the distance d between the two measurement spots Av and Bv was set to 5 μm, and the angle θ was set to 90°. The standard deviation at each data point was calculated from 10 measurements. As shown in Fig. 3, the measured flow velocities agreed well with the preset values in the flow velocity range. The similar shape of the slow-time PA amplitude profiles in each of the two inset figures clearly illustrates that the same group of RBCs was accurately captured at Av and Bv. The unequal PA amplitudes from Av and Bv are due to the uneven spatial light intensity distribution and uneven detection sensitivity of the transducer in the field of view. Because Δt must be an integral multiple of the laser pulse interval, the cross-correlation process had low precision when Δt digitally approached zero, displaying as larger error bars in Fig. 3.
Fig. 3.
Measured transverse flow velocities of defibrinated bovine blood versus preset values. Inset figures show time courses of slow-time PA profiles from Av (red line) and Bv (black dashed line) in (a) at two selected flow velocities, v = 2.25 mm/s and v = 13.5 mm/s.
We next measured flow velocities of vessels in a mouse ear in vivo. A nude mouse (Hsd:Athymic, Nude Mouse; Harlan, Indianapolis, Indiana) was used in the experiment. The experimental animal procedure was carried out in conformance with the laboratory animal protocols approved by the Animal Studies Committee of Washington University in St. Louis. For all the in vivo experiments, we targeted shallow micro-vascular structures that were parallel to the tissue surface. As a result, all the measured vessels were perpendicular to the detection axis (θ = 90°).
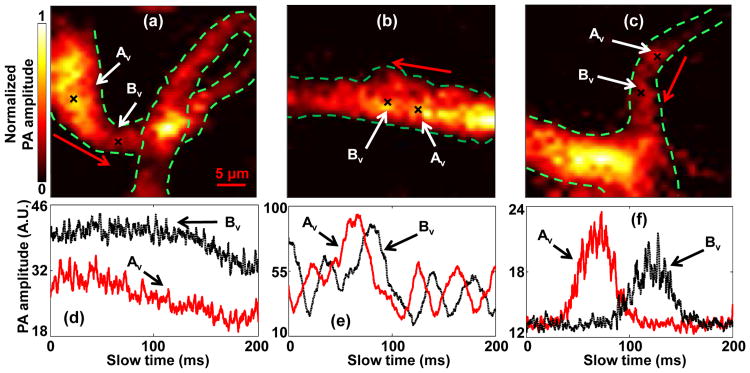
To show that our method can be used to measure flow velocity in vessels with different structures, we imaged three representative structures: a loop a straight vessel, and a bifurcation, as shown in Fig. 4(a-c). To quantify the flow velocities in these vessels, two close spots Av and Bv were selected in each vessel. The measured slow-time PA amplitude profiles from Av and Bv in Fig. 4(a-c) are shown in Fig. 4(d-f), respectively. The measured distances d, time shifts Δt, and flow velocities v are shown in Table 1. In addition, the signs of the time shift Δt in each vessel denote the flow direction of the blood, as marked by the red arrows in Fig. 4(a-c). Our results show that, in vessels with different structures, the flow velocity can be quantified by our method.
Fig. 4.
In vivo blood flow measurements in vessels with different structures. Black crosses denote locations of the two measurement spots. Red arrows denote the flow direction. PA images of (a) a loop vessel, (b) a straight vessel, and (c) a vessel bifurcation. (d-f) Time courses of slow-time PA profiles from Av and Bv in (a-c), respectively.
Table 1.
Flow velocity measurements in vessels with different structures, as shown in Fig. 4.
| Corresponding figures | d(μm) | Δt (ms) | v(mm/s) |
|---|---|---|---|
| (a) and (d) | 7.8 | 2.3 | 3.4 |
| (b) and (e) | 3.2 | 13.9 | 0.23 |
| (c) and (f) | 5.8 | 55.1 | 0.11 |
In addition, we studied spatial flow velocity changes in the same vessel. As shown in Fig. 5(a), two pairs of spots denoted as Av1-Bv1, Av2-Bv2, were chosen to measure flow velocities in different locations of a curved vessel. The measured slow-time PA amplitude profiles from Av1-Bv1 and Av2-Bv2 are shown in Fig. 5(b-c), respectively. As shown in Table 2, the flow velocities calculated from Av1-Bv1 and Av2-Bv2 were 0.24 mm/s and 0.14 mm/s, respectively. The similar profiles from Av1, Bv1, Av2, and Bv2 illustrate that the same group of RBCs was imaged at these spots. However, while travelling in the vessel, this group of RBCs slowed down. This might be caused by blood leakage, blood flux conservation, or interaction between RBCs and the vessel wall. To our knowledge, this is the first time that a flow velocity change was observed for the same group of RBCs, which might be useful for many blood disorder studies.
Fig. 5.
Measurement of flow changes in a curved vessel. (a) PA image of the vessel. Black crosses denote the locations of the monitoring spots. Red arrow denotes the flow direction. Time courses of slow-time PA profiles from (b) Av1 and Bv1, (c) Av2 and Bv2 in (a).
Table 2.
Flow velocity measurements in a single vessel, as shown in Fig. 5.
| Monitoring spots | d(μm) | Δt (ms) | v(mm/s) |
|---|---|---|---|
| Av1 and Bv1 | 4.0 | 16.5 | 0.24 |
| Av2 and Bv2 | 5.0 | 36.9 | 0.14 |
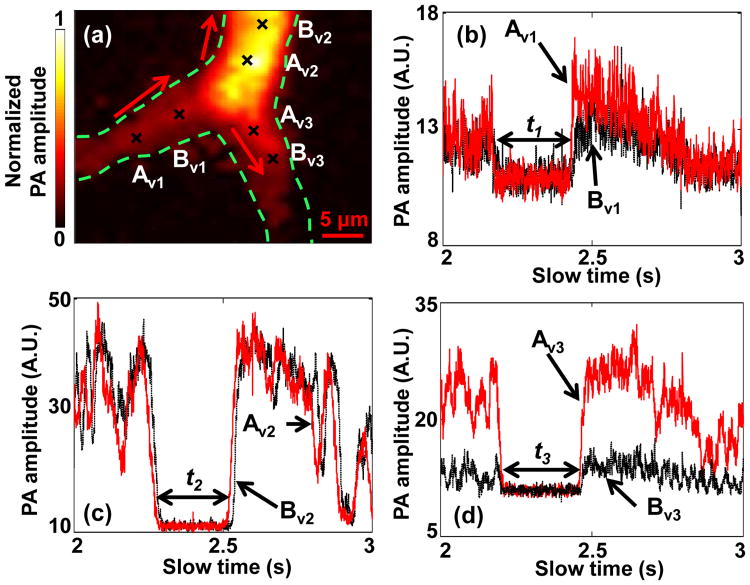
Finally, we further quantified the flow velocity from the same feature in a vessel bifurcation. A PA image of the vessel bifurcation is shown in Fig. 6(a). For flow measurement, three pairs of spots (Av1-Bv1, Av2-Bv2, and Av3-Bv3) were chosen in the bifurcation. The measured slow-time PA amplitude profiles from Av1 -Bv1, Av2-Bv2, and Av3-Bv3 are shown in Fig. 6(b-d), respectively. The measured distances d, time shifts Δt, and flow velocities v are shown in Table 3. Because of the conservation of blood flux in the vessel [14], the features appearing upstream should be also observed downstream. If the cross section of the feature keeps constant in the stream, which might be true over a very short distance, the length of the features should be the same. As shown in Fig. 6(b-d), the same “valley” was observed in all three pairs. The time durations of this valley in all the three figures were quantified to be t1 = 262.2 ms, t2 = 277.8 ms, and t3 = 272.4 ms, respectively. Thus, the valley in the upstream vessel had a length of t1 × v1 = 186.2 μm. Meanwhile, the sum of the valley lengths in the two downstream vessels was calculated to be t2 × v2 + t3 × v3 = 170.9 μm, close to the valley length in the upstream vessel. Taken together, these observations supported the idea of blood flux conservation.
Fig. 6.
Observation of feature conservation in a vessel bifurcation. (a) PA image of a vessel bifurcation. Black crosses denote locations of the monitoring spots. Red arrows denote the flow directions. Time courses of slow-time PA profiles from (b) Av1 and Bv1, (c) Av2 and Bv2, (d) AV3 and Bv3 in (a). The duration of the valley was (b) t1, (c) t2, and (d) t3.
Table 3.
Flow velocity measurements in a vessel bifurcation, as shown in Fig. 6.
| Monitoring spots | d (μm) | Δt (ms) | v(mm/s) |
|---|---|---|---|
| Av1 and Bv1 | 5.0 | 7.1 | 0.71 |
| Av2 and Bv2 | 4.5 | 12.1 | 0.37 |
| Av3 and Bv3 | 3.2 | 12.7 | 0.25 |
In our previous paper, we reported a minimum measurable flow velocity of about 0.2 mm/s [12], which was based on a total measurement time of 100 ms and a particle size of 10 μm. In this paper, we measured a flow velocity of 0.11 mm/s (Fig 4), smaller than the previously reported minimum measurable velocity. The decrease of minimum measurable flow velocity resulted from the increase of total measuement time and the decrease of particle size: a longer easurement time and a smaller particle size (RBC diaeter = 2-8 μm) were used here than in the previous paer (i.e., 200 ms versus 100 ms and 2-8 μm versus 10 μm).
In summary, we provided a cross-correlation-based method to measure flow velocity in vivo by using PAM. Different from previous flow measurement methods, this method was independent of particle size. Thus, a calibration-free absolute flow velocity can be measured, including both the flow speed and direction. Taking advantage of absolute flow velocity information, we observed accurate flow velocity changes and the feature conservation nature in the vessel. With more accurate flow information, our method provides a promising tool for more accurate measurement of the metabolic rate of oxygen, and for blood disorder studies.
Acknowledgments
The authors thank Professor James Ballard for his close reading of the manuscript. This work was sponsored in part by National Institutes of Health grants DP1 EB016986 (NIH Director's Pioneer Award), R01 EB008085, R01 CA134539, U54 CA136398, R01 EB010049, R01 CA157277, and R01 CA159959.
Footnotes
L.W. has a financial interest in Microphotoacoustics, Inc. and Endra, Inc., which, however, did not support this work. K.M. has a financial interest in Microphotoacoustics, Inc., which, however, did not support this work.
References
- 1.Wang LV, Hu S. Photoacoustic tomography: in vivo imaging from organelles to organs. Science. 2012;335(6075):1458–1462. doi: 10.1126/science.1216210. [DOI] [PMC free article] [PubMed] [Google Scholar]
- 2.Song W, Wei Q, Liu T, Kuai D, Burke JM, Jiao S, Zhang HF. Integrating photoacoustic ophthalmoscopy with scanning laser ophthalmoscopy, optical coherence tomography, and fluorescein angiography for a multimodal retinal imaging platform. J Biomed Opt. 2012;17(6):061206. doi: 10.1117/1.JBO.17.6.061206. [DOI] [PMC free article] [PubMed] [Google Scholar]
- 3.Zhang C, Zhou Y, Li C, Wang LV. Slow-sound photoacoustic microscopy. Appl Phys Lett. 2013;102(16):163702. doi: 10.1063/1.4803444. [DOI] [PMC free article] [PubMed] [Google Scholar]
- 4.Xie Z, Chen S, Ling T, Guo LJ, Carson PL, Wang X. Pure optical photoacoustic microscopy. Opt Express. 2011;19(10):9027–9034. doi: 10.1364/OE.19.009027. [DOI] [PMC free article] [PubMed] [Google Scholar]
- 5.Zhou Y, Yao J, Wang LV. Optical clearing-aided photoacoustic microscopy with enhance resolution and imaging depth. Opt Lett. 2013;38(14):2407–2409. doi: 10.1364/OL.38.002592. [DOI] [PMC free article] [PubMed] [Google Scholar]
- 6.Yuan Y, Yang S, Xing D. Optical-resolution photoacoustic microscopy based on two-dimensional scanning galvanometer. Appl Phys Lett. 2012;100:023702. [Google Scholar]
- 7.Fang H, Maslov K, Wang LV. Photoacoustic Doppler Effect from Flowing Small Light-Absorbing Particles. Phys Rev Lett. 2007;99:184501. doi: 10.1103/PhysRevLett.99.184501. [DOI] [PubMed] [Google Scholar]
- 8.Chen SL, Ling T, Huang SW, Won Baac H, Guo LJ. Photoacoustic correlation spectroscopy and its application to low-speed flow measurement. Opt Lett. 2010;35:1200–1202. doi: 10.1364/OL.35.001200. [DOI] [PMC free article] [PubMed] [Google Scholar]
- 9.Yao J, Maslov KI, Shi Y, Taber LA, Wang LV. In vivo photoacoustic imaging of transverse blood flow by using Doppler broadening of bandwidth. Opt Lett. 2010;35:1419–1421. doi: 10.1364/OL.35.001419. [DOI] [PMC free article] [PubMed] [Google Scholar]
- 10.Brunker J, Beard P. Pulsed photoacoustic Doppler flowmetry using time-domain cross-correlation: Accuracy, resolution and scalability. J Acoust Soc Am. 2012;132:1780–1791. doi: 10.1121/1.4739458. [DOI] [PubMed] [Google Scholar]
- 11.Song W, Liu W, Zhang HF. Laser-scanning Doppler photoacoustic microscopy based on temporal correlation. Appl Phys Lett. 2013;102:203501. doi: 10.1063/1.4807290. [DOI] [PMC free article] [PubMed] [Google Scholar]
- 12.Liang J, Zhou Y, Maslov KI, Wang LV. Cross-correlation-based transverse flow measurements using optical-resolution photoacoustic microscopy with a digital micromirror device. J Biomed Opt. 2013;18(9):096004. doi: 10.1117/1.JBO.18.9.096004. [DOI] [PMC free article] [PubMed] [Google Scholar]
- 13.Liang J, Zhou Y, Winkler A, Wang L, Maslov K, Li C, Wang L. Random-access optical-resolution photoacoustic microscopy using a digital micromirror device. Opt Lett. 2013;38:2683–2686. doi: 10.1364/OL.38.002683. [DOI] [PMC free article] [PubMed] [Google Scholar]
- 14.Yao J, Maslov KI, Zhang Y, Xia Y, Wang LV. Label-free oxygen-metabolic photoacoustic microscopy in vivo. J Biomed Opt. 2011;16(7):076003. doi: 10.1117/1.3594786. [DOI] [PMC free article] [PubMed] [Google Scholar]


