In two recent papers, Mao et al. (1, 2) present the trimeric structure of the HIV-1 gp160 trimer at 11- and 6-Å resolutions, respectively. The authors repeatedly emphasize their “reference-free,” “gold standard” methodology, but in neither of their papers do they state how the particles were selected from the electron micrographs. They do state (figure S3 in ref. 1): “Each row shows a sequence of average images from the same projection class, progressing from the initial average to the converged average,” and “refinements started without an external or prior reference images and did not assume any symmetry.” These projection classes thus must have existed prior to the refinements, as the result of an explicit search for specific molecular views, namely projection images generated from an earlier 3D structure. Because the reference bias is introduced at this earlier stage, it becomes irrelevant that the projection classes can be averaged without using further references or symmetry assumptions. In contrast to local-variance particle detection (3), correlation function picking looks for specific views in specific orientations and may introduce reference bias (4), as do all forms of reference-based alignment (4, 5). My best guess is that an earlier structure (EMDataBank EMD-5019) was used to pick particles in ref. 1.
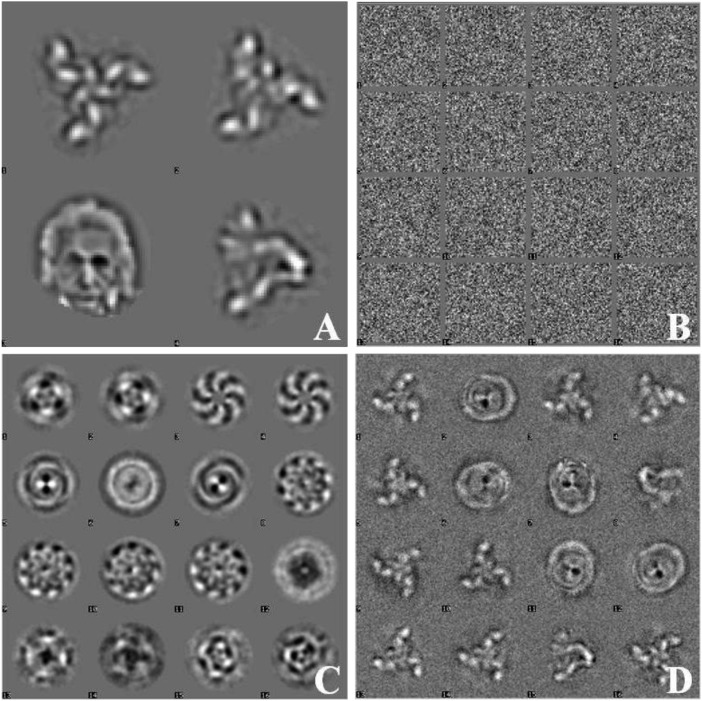
To illustrate the particle-picking bias problem, I picked molecular images from a random noise data set using four references (Fig. 1A, three of which are projection classes from ref. 2). A total of ∼109,000 molecular images were picked from 1,024 random noise micrographs (Fig. 1B) by searching for these references in different orientations. The Eigenimages (Fig. 1C) and class averages (Fig. 1D) came directly (no further alignments/references) from the set of picked particles using alignment by classification (4). One can find anything one wishes to find in random noise!
Fig. 1.
(A) Four reference images (each 64 × 64 pixels) used for picking from 1,024 random noise images (of 1,024 × 1,024 pixels). (B) Correlation function–picked particles (from a total of ∼109,000 picked molecular images). (C) Eigenimages of the picked particles. (D) Some typical class averages (from a total of 160), calculated directly from the extracted particles without any further alignments or processing.
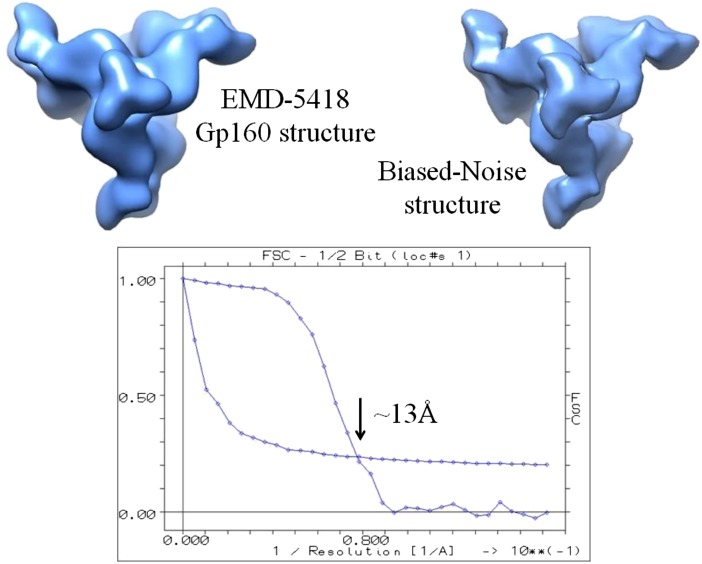
A second test (Fig. 2) encompassed the full procedure from particle picking to final 3D reconstruction. The only reference bias in this overall procedure lies in the correlation-based particle picking. The resulting 3D reconstruction, compared with the 3D search structure, yields a 13-Å cross-resolution, surprisingly better than the ∼18 Å found between the two published structures (6) by Mao et al. (1, 2), although the latter is supposed to be a refined version of the first. The two maps are entirely uncorrelated at ∼11-Å resolution [Fourier shell correlation (FSC) ∼ 0], showing that the particles for the 6-Å map were picked/aligned with other reference images and not with those derived from the 11-Å map, as stated.
Fig. 2.
Generating a gp160 trimer from random noise: 50 projection images of the published 11-Å gp160 map [EMB 5418 (1)] were used as references to pick 670,000 particles from 25,000 random noise micrographs with the Imagic pick-m-all program in cross-correlation mode (4). No further alignments (no references) were applied to the picked particles. After data compression and classification, these particles were summed into 10,000 class averages, which were then used directly for automatic 3D reconstruction using angular reconstitution (4). The cross-resolution [FSC 0.5-bit (4)] between the biased noise map and the gp160 search structure is 13 Å.
The facts that trimeric envelope glycoprotein oligomers and Einstein’s face can be recovered from the same pure noise images and that one can recover the full 3D map used to pick particles from pure random noise illustrate that the results of Mao et al. (1, 2) are invalid due to the use of an undisclosed reference-biased methodology. Moreover, the well-defined secondary structure in the final map of Mao et al. (2) appears to have come from reiterating their reference-based particle-picking procedures after modeling in secondary structures, thereby adding new bias of the “Einstein” kind. These authors must make their datasets, their particle-picking references, and their 670,000 selected particle images available for scrutiny by the scientific community or retract these papers.
The authors have been given a chance to respond to my letter above, and they have provided a Methodological Details document, plus 10 image pairs, representing less than 0.2% of the data set requested. (The dataset was said to contain 5,591 images.) Note that the images provided were preprocessed and were not the raw images requested. Their new document refers to numerous side issues but also describes how they searched for specific molecular views in the raw micrographs using, as reference, projection images generated from an earlier 3D structure filtered to 12-Å resolution. This was done, as I had feared, as the first step toward production of the 6-Å map published in PNAS. This procedure was not described in the original Materials and Methods sections, and is prone to introduce serious bias. The authors have ignored the request to make their full data set of raw images and 670,000 selected particles publically available and have not described their particle-picking references. This failure to disclose their data for public scrutiny is disappointing and deepens the concern about the results described in their PNAS paper.
Note Added in Proof.
This letter is accompanied by a related Letter from Sriram Subramaniam and Perspective article by Richard Henderson.
Acknowledgments
This study was financed by grants from the Brazilian science foundation, Conselho Nacional de Desenvolvimento Científico e Tecnológico (CNPq) (Grants CNPq-152746/2012-9 and CNPq-400796/2012-0), and the Dutch Ministry of Economic Affairs (Cyttron II: FES-0908). The computations for Fig. 2 were performed by Pavel Afanasyev, on equipment financed by BBSRC Grant BB/G015236/1.
Footnotes
The author declares no conflict of interest.
References
- 1.Mao Y, et al. Subunit organization of the membrane-bound HIV-1 envelope glycoprotein trimer. Nat Struct Mol Biol. 2012;19(9):893–899. doi: 10.1038/nsmb.2351. [DOI] [PMC free article] [PubMed] [Google Scholar]
- 2.Mao Y, et al. Molecular architecture of the uncleaved HIV-1 envelope glycoprotein trimer. Proc Natl Acad Sci USA. 2013;110(30):12438–12443. doi: 10.1073/pnas.1307382110. [DOI] [PMC free article] [PubMed] [Google Scholar]
- 3.van Heel M. Detection of objects in quantum noise limited images. Ultramicroscopy. 1982;7(4):331–342. [Google Scholar]
- 4. van Heel M, et al. (2012) Four-dimensional cryo-electron microscopy at quasi atomic resolution: IMAGIC 4D. International Tables for Crystallography Volume F: Crystallography of Biological Macromolecules, eds Arnold E, Himmel DM, Rossmann MG (Wiley, Chichester, UK), 2nd Ed, pp 624–628.
- 5.Boekema EJ, Berden JA, van Heel MG. Structure of mitochondrial F1-ATPase studied by electron microscopy and image processing. Biochim Biophys Acta. 1986;851(3):353–360. doi: 10.1016/0005-2728(86)90071-x. [DOI] [PubMed] [Google Scholar]
- 6.Subramaniam S. Structure of trimeric HIV-1 envelope glycoproteins. Proc Natl Acad Sci USA. 2013;110:E4172–E4174. doi: 10.1073/pnas.1313802110. [DOI] [PMC free article] [PubMed] [Google Scholar]


