Abstract
The morphology of citric acid production strains of Aspergillus niger is sensitive to a variety of factors, including the concentration of manganese (Mn2+). Upon increasing the Mn2+ concentration in A. niger (ATCC 11414) cultures to 14 ppb or higher, the morphology switches from pelleted to filamentous, accompanied by a rapid decline in citric acid production. The molecular mechanisms through which Mn2+ exerts effects on morphology and citric acid production in A. niger cultures have not been well defined, but our use of suppression subtractive hybridization has identified 22 genes responsive to Mn2+. Fifteen genes were differentially expressed when A. niger was grown in media containing 1,000 ppb of Mn2+ (filamentous form), and seven genes were expressed in 10 ppb of Mn2+ (pelleted form). Of the 15 filament-associated genes, seven are novel and eight share 47 to 100% identity with genes from other organisms. Five of the pellet-associated genes are novel, and the other two genes encode a pepsin-type protease and polyubiquitin. All 10 genes with deduced functions are either involved in amino acid metabolism-protein catabolism or cell regulatory processes. Northern blot analysis showed that the transcripts of all 22 genes were rapidly enhanced or suppressed by Mn2+. Steady-state mRNA levels of six selected filament-associated genes remained high during 5 days of culture in a filamentous state and remained low under pelleted growth conditions. The opposite behavior was observed for four selected pellet-associated genes. The full-length cDNA of the filament-associated clone, Brsa-25, was isolated. Antisense expression of Brsa-25 permitted pelleted growth and increased citrate production at concentrations of Mn2+ that were higher than the parent strain could tolerate. These results suggest the involvement of the newly isolated genes in the regulation of A. niger morphology.
The morphology of filamentous fungi in fermentation processes is critical to maximum product output. The optimal morphology for the production of organic acids, enzymes, and secondary metabolites differs among fungi, but growth as small pellets is usually correlated with highly efficient fungal processes. For example, pelleted morphology is necessary for maximum production of citric acid by Aspergillus niger (9), itaconic acid by Aspergillus terreus (30), pravastatin precursor by Penicillium citrinum (17, 47), and certain heterologous proteins by A. niger (57). It has been reported that filamentous growth is preferable for penicillin production by Penicillium chrysogenum (49) and fumaric acid production by Rhizopus arrhizus (6). The ability to obtain and maintain a particular morphology is one of the key parameters in the development of productive fungal fermentations. Empirically determined process conditions, such as agitation, dissolved oxygen concentration, substrate (carbon) concentration, nitrogen, phosphorous, and micronutrient concentrations, pH, ionic strength, and inoculum concentration have all been demonstrated to have effects on morphology which differ among different fungi (5, 10, 22, 29, 53). Decreasing mass transfer limitations is a likely beneficial effect of fungi adopting a small-pellet morphology (less than approximately 1 mm in diameter) in submerged fermentations. The small pellets decrease the culture viscosity (47), which increases the efficiency of mixing and thus mass transfer. In the cited study, the product output declined precipitously at pellet diameters greater than 1 mm. Michel et al. showed that oxygen concentration falls rapidly with the depth below the surface of pellets of Phanerochaete chrysosporium (31). The exact depth varied with the external oxygen concentration but did not exceed 0.8 mm. These studies imply that there is a practical upper limit for pellet size associated with high product output in aerobic bioprocesses (31). Despite the known benefits of proper fungal morphology, the molecular mechanisms involved in the regulation of the morphology of filamentous fungi in submerged culture remain inadequately defined. Knowledge of the genes and enzymes involved in the complex process of fungal morphology determination is a prerequisite for the application of genetic engineering to the control of morphology in fungi. It is our hypothesis that this preferred morphology in the filamentous fungi, though induced by various nutritional or environmental conditions, is controlled by common genetic factors. To test this hypothesis, we have chosen a citric acid-producing strain of A. niger as the model organism.
Industrial strains of A. niger are capable of growing on solutions in excess of 20% (wt/vol) glucose or sucrose and converting approximately 90% of the supplied carbohydrate to citric acid. These remarkable properties are the reason that A. niger has been used to produce citric acid for 80 years and is currently the primary source of commercial citric acid production (28). This complex bioprocess is known to depend on a variety of environmental factors, including the concentration of Mn2+ in the medium. The effects of Mn2+ on citric acid production, cell wall composition, and morphology have been examined by using biochemical approaches. Röhr and Kubicek (41) found that A. niger produced reasonable amounts of citric acid only when the Mn2+ concentration in the culture medium was well below 1 μM (55 ppb). Manganese deficiency leads to an increase in protein turnover, which ultimately leads to a high intracellular concentration of NH4+ (23, 27). The high NH4+ concentration prevents citrate-mediated feedback inhibition of glucose catabolism (15, 16), thus allowing citric acid accumulation. In addition, Mn2+ deficiency results in peculiar morphology development characterized by increased spore swelling and squat, bulbous hyphae (46). An analysis of cell wall compositions from cultures grown with or without adequate manganese revealed that Mn2+-deficient cultures had increased amounts of chitin but decreased amounts of β-glucan and galactans (21). Despite the interest in the regulation of citric acid biosynthesis in A. niger, the molecular mechanisms responsible for the effects of manganese on morphology formation and citric acid production in liquid culture have not been studied in detail.
Suppression subtractive hybridization (SSH) is a method that utilizes a suppressive PCR to create cDNA libraries from which the cDNAs common to two different physiological states of an organism are subtracted, thus allowing the identification of genes differentially expressed in response to an experimental stimulus (13, 14, 54). The SSH method differs from earlier subtractive methods by including a normalization step that equalizes the relative abundance of cDNA within a target population. This modification enhances the probability of identifying the increased expression of low-abundance transcripts and represents a potential advantage over other methods for identifying differentially regulated genes, such as differential display reverse transcriptase PCR (26) and cDNA representation difference analysis (50). Here, we describe the application of SSH for the identification of genetic elements associated with pelleted and filamentous morphologies, observed as Mn2+-induced and Mn2+-suppressed genes in A. niger. The responses of the newly isolated genes to different developmental stages during the fermentation processes were examined by RNA blot analysis. The full-length Brsa-25 gene was isolated, and its effects on A. niger morphology and citric acid production were examined by using antisense expression.
MATERIALS AND METHODS
Strains and media.
Escherichia coli strains JM109 and DH5α were used as hosts for routine cloning experiments. Agrobacterium tumefaciens AGL0, containing a Bo542 chromosomal background and a disarmed helper-Ti plasmid pEHA101 (25), was used for the transformation of A. niger. A. niger strain ATCC 11414, obtained from the American Type Culture Collection (Rockville, Md.), was grown on potato dextrose agar plates at 30°C for culture maintenance and spore preparation. The cultures were incubated for 5 days, and the spores were harvested by washing with sterile 0.8% Tween 80 (polyoxyethylenesorbitan monooleate). Conidia were enumerated with a hemacytometer. Aliquots of the resulting spore suspension (109 spores/ml) were used to inoculate culture tube or baffled-flask liquid cultures. The citric acid production (CAP) medium contained 140 g of glucose/liter, 3.1 g of NH4NO3/liter, 0.15 g of KH2PO4/liter, 0.15 g of NaCl/liter, 2.2 g of MgSO4 · 7H2O/liter, 6.6 mg of ZnSO4 · 7H2O/liter, and 0.1 mg of FeCl3/liter adjusted to pH 2.0 with 4 M H2SO4. Cations were removed from the glucose solution by ion exchange on Dowex 50W-X8, 100/200-mesh, H cation exchange resin (Fisher Scientific, Pittsburgh, Pa.) prior to adding the other nutrient components. The manganese concentration in the medium was adjusted by the addition of appropriate volumes of a stock solution of MnCl2 · 4H2O (10 mM). The Mn2+ concentration in the medium, before and after growth of A. niger, was determined by using a Hewlett-Packard 4500 series inductively coupled plasma mass spectrometer (ICP-MS) with a sub-part per billion detection limit (Agilent Technologies, Palo Alto, Calif.). The samples and the manganese standard solutions were serially diluted to optimal mass ranges with ultrapure deionized water before being injected into the ICP-MS for measurement. Three replicates of each sample and standard were measured. Concentrations of manganese in the samples were calculated based on the signal response of the manganese standards.
Culture methods.
Glass baffled flasks of 250 and 1,000 ml and 16- by 125-mm glass culture tubes were silanized with SigmaCote (Sigma, St. Louis, Mo.) to minimize leaching of metals. For citric acid production tests, A. niger was grown in 50 ml of CAP media containing 10 or 1,000 ppb of Mn2+ in 250-ml baffled flasks at 30°C and 250 rpm. Samples for citric acid analysis were taken at intervals. Small cultures for examining the effects of Mn2+ on morphology and citric acid production were grown in 16- by 125-mm culture tubes containing 2 ml of CAP medium and incubated at 30°C and 250 rpm for 3 days. The culture tubes were laid at an angle of approximately 20° against the platform of the shaker.
To produce sufficient biomass for RNA isolation, 12 1-liter baffled flasks containing 250 ml of CAP medium with 10 ppb of Mn2+ were used. Each flask was inoculated with 106 spores/ml and incubated for 12 h at 30°C and 250 rpm to obtain pelleted morphology, and then 1,000 ppb of Mn2+ was added to six of the flasks to induce filamentous growth. This procedure was replicated four times to obtain time points 20, 40, 60, and 120 min after manganese induction of filamentous growth. At each time point, the growth of fungal cultures was suspended by rapid cooling in an ice water bath. The biomass was immediately separated from the culture supernatant by centrifugation for 10 min at 4°C and 15,000 × g. The biomass was transferred from 500-ml centrifugation bottles to 50-ml centrifugation tubes, immediately frozen in liquid N2 for 5 min, and stored at −80°C. The biomass was also prepared from 50-ml cultures with or without 1,000 ppb of Mn2+ at different developmental stages (0.5 to 5 days) for examining the expression patterns of newly isolated genes. The biomass from these cultures was collected by centrifugation at 9,500 × g in 50-ml centrifuge tubes. The biomass of transgenic clones was prepared from cultures grown in 16- by 125-mm glass culture tubes. The biomass was collected by centrifugation in a 1.8-ml microcentrifuge tube at 20,000 × g and 4°C for 5 min.
Citric acid measurements.
Citric acid concentrations were determined with an endpoint spectrophotometric enzyme assay (4). Five microliters of each culture supernatant was assayed (see above).
RNA isolation.
Total RNA was isolated from A. niger according to the modified acid-guanidinium isothiocyanate phenol-chloroform extraction method described previously (7, 11). The total RNA concentration was quantified spectrophotometrically. Polyadenylated RNA was isolated from the total RNA with the Oligotex kit (QIAGEN, Valencia, Calif.).
SSH.
The SSH procedure was performed with a PCR-Select cDNA subtraction kit (Clontech, Palo Alto, Calif.) as directed by the manufacturer, except a twofold-greater amount of “driver” cDNA was added to the first and second hybridizations. Starting material consisted of 2 μg of an mRNA pool comprised of 25% of each mRNA preparation from the 20-, 40-, 60-, and 120-min Mn2+-induced (filamentous morphology) cultures. The second mRNA pool was comprised of 25% of each mRNA preparation from the 20-, 40-, 60-, and 120-min non-Mn2+-induced (pellet morphology) cultures. For isolation of cDNAs associated with pellet morphology, the cDNA from non-Mn2+-induced A. niger cells was used as the “tester” and the cDNA from the Mn2+-induced cells was used as the driver. For isolation of cDNAs associated with filamentous morphology, the cDNA from the Mn2+-induced cells was used as the tester and the cDNA from the non-Mn2+-induced A. niger cells was used as the driver. One of two restriction endonucleases, RsaI or AluI, was used to digest the initial cDNA pools employed in the construction of the SSH cDNA libraries described above. Thus, four SSH libraries were prepared: Arsa designates pellet-associated genes from the SSH library generated with the RsaI-digested cDNA, Brsa designates filament-associated genes from the SSH library generated with the RsaI-digested cDNA, Aalu designates pellet-associated genes from the SSH library generated with the AluI-digested cDNA, and Balu designates filament-associated genes from the SSH library generated with the AluI-digested cDNA.
Differential screening of SSH cDNA libraries and sequencing of SSH cDNA fragments from SSH.
The PCR products generated by SSH were cloned into the pGEM-T Easy vector (Promega, Madison, Wis.) to form the SSH cDNA libraries described above. The JM109 E. coli colonies containing the pGEM-T Easy vector with the SSH cDNA inserts from the four libraries were selected randomly and cultured overnight for plasmid DNA purification. Plasmid DNAs were purified and digested with the restriction endonuclease EcoRI. Two sets of EcoRI-digested DNA fragments were separated by gel electrophoresis and transferred to two separate nylon membranes. Alternatively, the intact plasmid DNAs were directly arrayed on two separate nylon membranes for differential screening. For differential screening of SSH cDNA clones associated with pelleted or filamentous morphology, the forward SSH cDNA radioactive probes were synthesized by randomly priming the same SSH cDNA used to construct the SSH cDNA library associated with pelleted or filamentous morphology by using [α-32P]dCTP and the Klenow fragment of DNA polymerase I (Rediprime II DNA labeling system; Amersham Biosciences, Piscataway, N.J.) and the reverse SSH cDNA radioactive probes from the same SSH cDNAs used for construction of the SSH cDNA library associated with filamentous or pelleted morphology, respectively. DNA sequencing of the SSH cDNA clones of interest identified by differential screening was performed at Iowa State University by using BigDye terminator cycle sequencing kits, followed by analysis on an ABI Prism 377 DNA sequencer. The DNA sequences obtained were compared to the nonredundant NCBI nucleotide and protein databases by using BLAST (1), to the EMBL-EBI FUNGI nucleotide database and the Swiss-Prot database by using FASTA3 (36), and to the fungal (Aspergillus nidulans, Neurospora crassa, and Magnaporthe grisea) genome sequence databases at the Center for Genome Research of the Whitehead Institute via BLAST search.
RNA blotting analysis.
Fifteen or twenty micrograms of total RNA was used for RNA blotting analysis as described by Dai et al. (11) with Zeta-probe blotting membranes (Bio-Rad, Richmond, Calif.). Hybridizations were performed at 65°C (8) to radioactive probes synthesized by random priming of an EcoRI fragment containing the SSH cDNA fragment with [α-32P]dCTP and the Klenow fragment of DNA polymerase I (Amersham Biosciences). The blots were exposed to X-ray film at −30°C with intensifying screens. The film was developed and scanned by using an Epson Expression 800 scanner with a transparency unit (Epson America, Inc., Long Beach, Calif.), and the relative expression levels of mRNAs were quantified by using GelExpert software (NucleoTech, San Carlos, Calif.). The amount of 18S rRNA in each sample was also determined; as an internal control, the blots were stripped according to the manufacturer's instructions (Bio-Rad) and hybridized with a radiolabeled 18S rRNA probe. The relative abundance of each gene transcript was normalized to the amount of 18S rRNA at each time point and expressed as a percentage.
Isolation of the full-length Brsa-25 cDNA with RACE-PCR and the full-length gene by PCR.
The full-length Brsa-25 clone was isolated by 5′ and 3′ rapid amplification of cDNA ends (RACE)-PCR. Poly(A)+ RNA (1 μg) pooled from different treatments described in the “SSH” section was used to synthesize anchored, double-stranded cDNA templates for amplification of the 5′ and 3′ ends of cDNA clones via a Marathon cDNA amplification kit (Clontech). The oligonucleotide FP-8 (5′-GGGTGGTGGAGATATCTGGGAAGT-3′) and adapter primer (AP1) provided by the manufacturer were used for the isolation of the 5′-end fragment, while FP-7 (5′-GCAGTATATTCACACGCCAAGTCTCATC-3′) and AP1 were used for the isolation of the 3′-end fragment via RACE-PCR. The amplified fragments were cloned into pGEM-T Easy vectors (Promega), and three or four independent plasmids were sequenced. The sequences of the 5′- and 3′-end cDNA fragments were aligned with the sequence of the Brsa-25 SSH cDNA fragment to verify that the newly isolated fragments belonged to the proper gene. The full-length cDNA clone of Brsa-25 was amplified by PCR with the primer pair FP-37 (5′-CCTCTATTCTGTCTCCCTTCGGCGAT-3′) and FP-38 (5′-GACACCATCACAGACATATACAGAGA-3′). The fragment was cloned into the pGEM-T Easy vector to form pZD557 and was sequenced. Genomic DNA fragments for Brsa-25 were isolated with the oligonucleotide pair FP-81 (5′-GGTTTCTTTATCCTGTCCGTATGCTG-3′) and FP-82 (5′-CTGTGGAGTAGATGGGCACTCTTGAT-3′). The genomic fragments were cloned into the pGEM-T Easy vector and sequenced.
Antisense expression vector and Agrobacterium-mediated transformation of A. niger.
The Brsa-25 antisense expression vector was constructed by amplifying a 1,900-bp fragment containing the whole coding region and a portion of the terminator by using plasmid DNA (pZD557) as the template, high-fidelity DNA polymerase, and a primer pair designed to introduce BamHI and HpaI sites (in bold) at the 5′ and 3′ ends, respectively (FP-66, 5′-CAGGATCCCCTCTATTCTGTCTCCCTTCGGCGAT-3′; FP-67, 5′-GGGTTAACGACACCATCACAGACATATACAGAGA-3′). The PCR fragment was first cloned into the PCR-Blunt II-TOPO vector (Invitrogen, Carlsbad, Calif.) to form pZD570. Second, the full-length cDNA fragment was excised with the restriction endonucleases BamHI and HpaI and ligated to the appropriately digested vector pZD567 (modified from pAN8-1 [39]) to form pZD574, in which the Brsa-25 cDNA fragment in antisense orientation was under the control of the gpdA promoter and the trpC transcriptional terminator. Third, the fragment containing the gpdA promoter, the Brsa-25 cDNA fragment in antisense orientation, and the trpC transcription terminator was excised with restriction endonucleases BglII and NdeI, treated with Klenow enzyme, and ligated to the SmaI fragment of pZD581 to form binary vector pZD586. The resulting construct was introduced into Agrobacterium tumefaciens strain AGL0 and transferred into A. niger cells based on the methods described by Piers et al. (38) and de Groot et al. (12).
RESULTS AND DISCUSSION
Detailed examination of the effects of Mn2+ on citric acid production and morphology of A. niger.
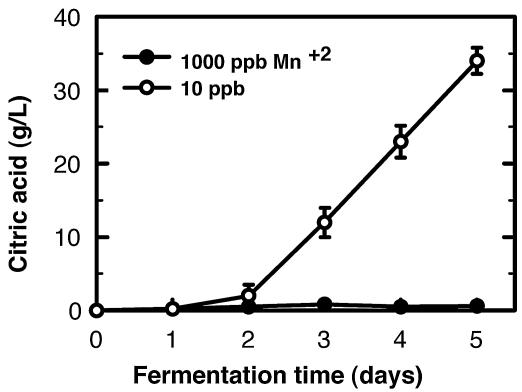
The effects of Mn2+ concentration on citric acid synthesis, uptake, and export have been examined in different A. niger strains (2, 32, 41, 45). However, a detailed analysis of the effects of Mn2+ on morphology formation and its linkage to citric acid production in A. niger cultures has not been performed. The effect of Mn2+ concentration on citric acid production by A. niger versus time was examined in baffled-flask cultures with 10 or 1,000 ppb of Mn2+. Citric acid production dramatically increased after 48 h of growth in 10-ppb Mn2+ cultures, while it remained very low in 1,000-ppb Mn2+ cultures (Fig. 1). Cultures of A. niger in CAP medium with 10 ppb of Mn2+ produced about 35 g of citric acid/liter after 5 days of growth, exhibiting a sixfold increase from day two to day three. Similar citric acid accumulation patterns have been observed in other A. niger strains (43).
FIG. 1.
Citric acid production by A. niger in the presence of 10 or 1,000 ppb of manganese. A. niger was cultured under citric acid-producing conditions with 10 and 1,000 ppb of Mn2+. The conidia (106 conidia/ml) were inoculated into 50 ml of CAP medium in 250-ml baffled flasks and incubated at 30°C and shaken at 250 rpm. The samples were harvested at different time points after 2 days of growth. Data are means of determinations from at least three independent fermentations.
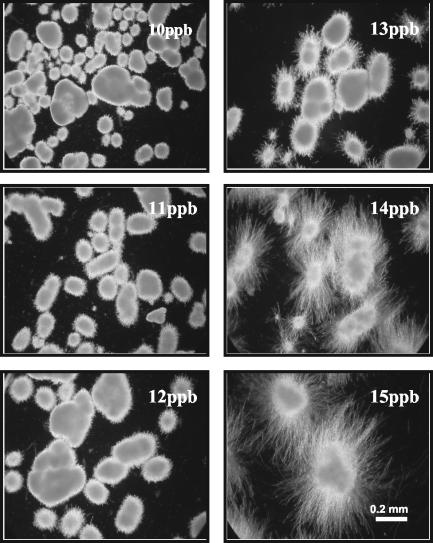
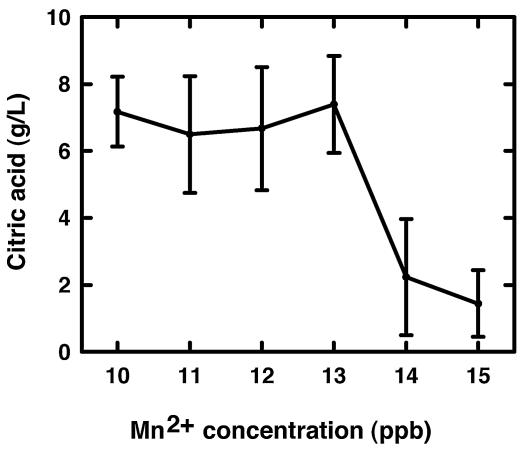
We further examined the effects of Mn2+ levels on the morphology formation and citric acid production of A. niger cells grown in glass culture tubes. Cultures with Mn2+ concentrations from 10 (background level) to 13 ppb had restricted hyphal growth (pellet morphology was maintained), but an increase of just 1 to 2 ppb in Mn2+ concentration dramatically enhanced the hyphal growth (Fig. 2). Citric acid concentrations in 3-day A. niger cultures were similar for Mn2+ concentrations from 10 to 13 ppb but decreased more than 70% in the 14- and 15-ppb Mn2+ cultures (Fig. 3). The effects of Mn2+ concentration on citric acid production have been reported previously (21, 44, 45), but in the present study, the effects of Mn2+ on A. niger morphology and citric acid production were examined concurrently. Low Mn2+ concentrations (10 to 13 ppb) also significantly suppressed the biomass accumulation (data not shown). The results provide the information on the proper culture conditions necessary for the isolation and characterization of genes that are responsive to Mn2+ concentration and likely to be involved in the control of morphology.
FIG. 2.
Effects of Mn2+ on A. niger morphological formation. The conidia (106 conidia/ml) were inoculated into 2 ml of CAP medium supplemented with different amounts of Mn2+ in 16- by 125-mm silanized glass tubes that were positioned at about 15° from horizontal on the shaker platform. The cultures were incubated at 30°C with shaking at 250 rpm. The mycelia from each culture were observed microscopically after 3 days of growth to assess the effects of Mn2+ on development. All photos were taken at the same magnification (×75).
FIG. 3.
Effects of Mn2+ on citric acid production in A. niger cultures. A. niger conidia (106 conidia/ml) were inoculated into 2.0 ml of CAP medium containing different concentrations of Mn2+ in 16- by 125-mm silanized glass tubes that were positioned about 15° from horizontal against the shaker platform. The cultures were incubated at 30°C and shaken at 250 rpm. Citric acid was measured in the culture medium after 3 days of growth.
Isolation of cDNA clones for Mn2+-responsive morphology control genes in A. niger.
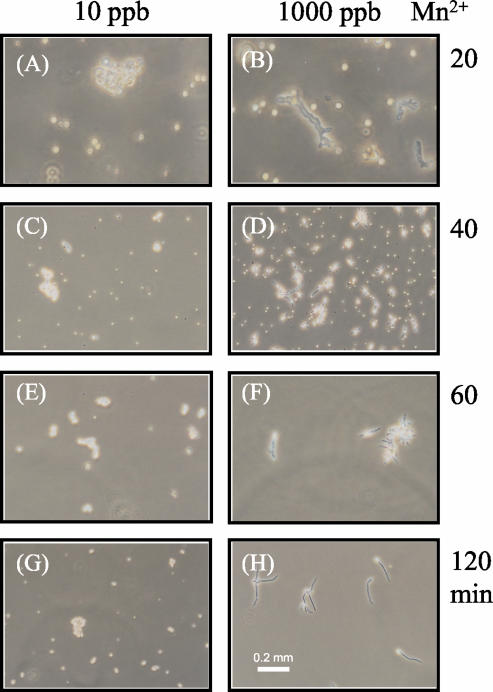
Previous observations (9, 21, 41) and the results reported here demonstrate that optimal citric acid production in A. niger cultures is associated with pelleted morphology. Fungal morphology formation is regulated by different factors, such as dissolved O2 concentration, agitation, substrate concentration, and the minerals in the culture media (10, 21, 55). In order to synchronize A. niger growth and minimize temporal variations in the mRNA pool, 12 shake flask cultures were grown under pelleted growth conditions (10 ppb of Mn2+) for the first 12 h. Then, 1,000 ppb of Mn2+was added to six of the cultures to induce hyphal growth. The addition of 1,000 ppb of Mn2+ induced hyphal growth in most of the cells after just 40 min and in all of the cells by 120 min (Fig. 4).
FIG. 4.
Early induction of filamentous mycelia growth. Conidia (106 conidia/ml) were inoculated into 250 ml of CAP medium in 1,000-ml baffled flasks and incubated at 30°C at 250 rpm. A. niger was precultured under citric acid production conditions for 12 h. Thereafter, 1,000 ppb of Mn2+ was added to half of the A. niger cultures for induction of filamentous growth while the other half of the A. niger cultures were maintained in CAP medium (10 ppb of Mn2+) for pelleted growth. The mycelia were harvested at different induction intervals for microscopic observation and RNA extraction. The photos in the left panels were taken from mycelia harvested from a citric acid-producing culture (pellet growth), and the ones in the right panels were taken from mycelia harvested from Mn2+-inducing filamentous growth. All photos were taken at the same magnification (×75). The labels to the right of the panels represent the length of induction.
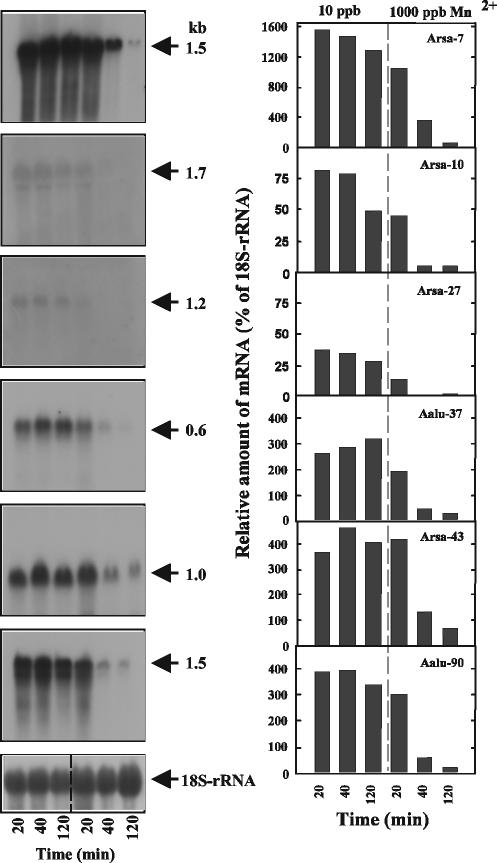
Based on the conspicuous effect of Mn2+ concentration on morphology (Fig. 2 and 4), we hypothesized that a set of genes may be involved in Mn2+-inducible morphology changes in A. niger cultures. In order to isolate the few critical genes from the estimated 14,000 genes found in A. niger (G. Groot, H. Pel, N. van Peij, and A. van Ooyen, Abstr. Annu. Meet. Soc. Ind. Microbiol., 2002), the highly selective SSH method was employed. The SSH and Southern differential screening analysis suggested differential expression of 18 mRNAs in A. niger cells induced by 1,000 ppb of Mn2+ and of nine mRNAs in A. niger cells with the initial (10-ppb Mn2+) culture medium. Differential expression of 15 of the 18 genes represented by the cloned fragments for the high-Mn2+ (1,000-ppb) cultures and seven of nine genes represented by the cloned fragments for the low-Mn2+ (10-ppb) cultures were confirmed by Northern analysis (data not shown). These 15 Mn2+-enhanced clones had relatively low expression levels when A. niger cells were maintained at low-Mn2+ conditions, while their expression was significantly enhanced upon the addition of 1,000 ppb of Mn2+. In contrast, the seven Mn2+-suppressed clones exhibited very high expression levels in low-Mn2+ cultures and drastically decreased expression after a 40-min exposure to high Mn2+ concentrations. The full-length mRNAs for the 15 Mn2+-enhanced clones were between 1 and 2.2 kb and were between 0.6 and 1.7 kb for the seven Mn2+-suppressed clones (Table 1).
TABLE 1.
mRNA size and DNA sequence analysis of the SSH cDNAs differentially expressed in pellet or filamentous morphology cells
| Clone type and name | Putative gene identificationa | mRNA length (kb)b | cDNA obtained (bp)c |
|---|---|---|---|
| Filamentous morphology-associated | |||
| Balu-4 | A. nidulans G-protein β-subunit (sfaD) gene (69.9%) | 2.0 | 293 |
| Balu-42 | Unknown | 1.2 | 606 |
| Balu-52 | Unknown | 2.2 | 191 |
| Brsa-25 | Unknown | 1.9 | 413 |
| Brsa-35 | Unknown | 1.5 | 372 |
| Brsa-43 | A. oryzae peptidase (tppA) gene (47%) | 2.1 | 348 |
| Brsa-47 | N. crassa inositol-1-phosphate synthase (MIPS) gene (76.7%) | 1.8 | 153 |
| Brsa-48 | Unknown | 1.0 | 350 |
| Brsa-61 | A. nidulans cobalamin-independent methionine synthase (metH/D) gene (89%) | 2.2 | 235 |
| Brsa-62 | A. nidulans “pyridoxine synthesis” (pyroA) gene (60%) | 2.1 | 525 |
| Brsa-64 | Unknown | 1.0 | 198 |
| Brsa-109 | Unknown | 1.9 | 272 |
| Brsa-112 | N. crassa ATP citrate lyase (acl1) (85%) | 2.0 | 130 |
| Brsa-116 | P. chrysogenum homocitrate synthase (lys1) gene (80.6% in the first 200 bp) | 1.5 | 515 |
| Brsa-118 | S. cerevisiae hydroxymethylglutaryl-CoA synthase (erg13) gene (55%) | 2.0 | 299 |
| Pellet morphology-associated | |||
| Arsa-7 | Unknown | 1.5 | 619 |
| Arsa-10 | Talaromyces emersonii pepsin-type protease (54%) | 1.7 | 404 |
| Arsa-27 | Unknown | 1.2 | 550 |
| Aalu-37 | Unknown | 0.6 | 305 |
| Arsa-43 | Arthroderma benhamiae polyubiquitin (ubi) gene (100%) | 1.1 | 390 |
| Arsa-48 | Unknown | 0.8 | 615 |
| Aalu-90 | Unknown | 1.5 | 338 |
The percentages of nucleotide sequence identity shown in parentheses were obtained by using BLAST to search the NCBI nonredundant database.
The length of mRNAs was estimated based on the RNA ladder size.
The length of SSH cDNA clones was determined by DNA sequencing with an automated ABI Prism 377 DNA sequencing system.
Sequence analysis of SSH cDNA clones.
The nucleotide sequences of the partial cDNA clones (ranging from 130 to 619 bp) were determined to gain insight into the functions of the encoded proteins. BLAST and FASTA3 analyses of the nucleotide and translated sequences of the cDNA clones against GenBank, the EMBL-EBI FUNGI nucleotide database, and the genome databases of A. nidulans, N. crassa, and M. grisea revealed that seven of the Mn2+-enhanced (filament-associated) clones did not have significant similarity to known sequences. Eight of the clones possessed various degrees of identity to known genes from other organisms (Table 1). The gene products with homology to known proteins fell into one of two groups, those involved in signal transduction or those involved in amino acid synthesis or protein catabolism.
There are two genes associated with the signaling group. The translated sequence of Balu-4 is 96% identical to the A. nidulans G-protein β-subunit gene, sfaD. This heterotrimeric G-protein component is known to be required for normal growth and repression of sporulation in A. nidulans (42, 58). The translated sequence of Brsa-47 is 60% identical to the Pichia pastoris inositol-1-phosphate synthase (ino1) gene. This is the first enzyme on the biosynthetic pathway to inositol phosphates involved in intracellular signaling. For example, inositol-1,4,5-trisphosphate induces Ca2+ release, which stimulates hyphal tip growth in N. crassa (48).
The remaining six genes with putative functions fall into the amino acid synthesis or protein utilization group. The deduced amino acid sequence of Brsa-43 shares 59% identity with the tripeptidyl peptidase A (tppA) of Aspergillus oryzae. Tripeptidyl peptidases have been well studied in mammalian systems, where they release N-terminal tripeptides from oligopeptides generated by different endopeptidases. The tripeptides are further degraded by other exopeptidases to release amino acids and dipeptides (52). Expression of tppA in Streptomyces lividans was enhanced during filamentous growth and suppressed during pelleted growth (59). The translated protein sequence of Brsa-62 shares 86% identity with the A. nidulans pyroA gene product, an enzyme involved in pyridoxine biosynthesis, which is important for amino acid metabolism. The deduced amino acid sequence of Brsa-112 shares 85% identity with that of the N. crassa acl1 gene product, ATP citrate lyase, which provides cytosolic acetyl coenzyme A (acetyl-CoA) for lipid synthesis and is crucial for the accumulation of substantial amounts of lipid in fungi (56). In a fungus from the same family as N. crassa, Sordaria macrospora, the ATP citrate lyase was found to be specifically induced at the beginning of the sexual cycle, thus producing the acetyl-CoA required for biosynthesis during fruiting body formation at later stages of sexual development (33). Clearly the expression of ATP citrate lyase during filamentous growth would lead to a net decrease in the production of citric acid. However, the relative contribution of this enzyme to decreasing citrate accumulation has not been quantified. The increased levels of the acl1 transcript are also consistent with increased amino acid biosynthesis, as the oxaloacetate produced can be transaminated to l-aspartate and subsequently to other amino acids of the aspartate group. The clone Brsa-116 shares 88% identity with the P. chrysogenum lys1 gene encoding homocitrate synthase, the first step in lysine biosynthesis in fungi. Brsa-118 shares 54% identity with the Saccharomyces cerevisiae erg13 gene encoding hydroxymethylglutaryl-CoA synthase. This enzyme produces the first metabolite on the pathway to branched-chain amino acid synthesis, as well as sterol synthesis (though the latter is controlled at the level of hydroxymethylglutaryl-CoA reductase). The genes acl1, erg13, ino1, lys1, pyroA, and tppA were found to be involved in cell growth and tissue development (3, 20, 35, 51). The deduced peptide sequence of the Brsa-61 product is identical to that of the A. nidulans metH/D gene product. This gene encodes the cobalamin-independent methionine synthase, which is the enzyme responsible for methionine synthesis in eukaryotic organisms.
BLAST analysis of the Mn2+-suppressed clones (pellet associated) showed that five of seven clones had no significant homology to known sequences in GenBank and other databases. The deduced amino acid sequence of Arsa-10 is 59% identical to A. oryzae aspergillopepsin O (pepO), an aspartic proteinase. The Northern blot analysis of Arsa-10 showed high expression during early pelleted growth and suppression when A. niger switched to filamentous growth (see Fig. 6). Reichard et al. examined the aspergillopepsin PEP with immunofluorescence and found that it was mainly located in developing conidiophores of aspergilli, in submerged mycelia, and on the tips of growing aerial mycelia, whereas mature aerial hyphae and spores showed no immunofluorescence (40). The results suggest a role for such enzymes in the growth of hyphae and the development of conidiophores, and thus for the sporulation process in aspergilli.
FIG. 6.
Suppression of Arsa-7, Arsa-10, Arsa-27, Aalu-37, Arsa-43, and Aalu-90 mRNA by 1,000 ppb of Mn2+. Twenty micrograms of the total RNA pools was subjected to denaturing gel electrophoresis and hybridized with radioactively labeled probes prepared from the cloned cDNA fragments. Autoradiographs of the Northern blots are shown on the left. Relative RNA levels are plotted on the right. The percentages of relative amounts of mRNA were estimated by densitometry of bands and normalized to the relative amount of 18S rRNA.
Another gene, Arsa-43, is identical to the translated ubiquitin (ubi) gene of Arthroderma benhamiae (Table 1) (18). Ubiquitin is attached to other proteins via an isopeptide linkage formed by multiple enzymatic steps to form a polyubiquitinated protein. The attachment of ubiquitin through K48 or K29 marks the modified proteins for proteolysis by the 26S proteasome. Proteins modified by this process are generally tightly regulated proteins involved in the control of cellular processes, for example, meiosis in fission yeast (34). The attachment of ubiquitin through K63 occurs for proteins involved in other critical cellular processes, such as stress response in S. cerevisiae (37).
Expression pattern of the Mn2+-responsive transcripts during early developmental stages.
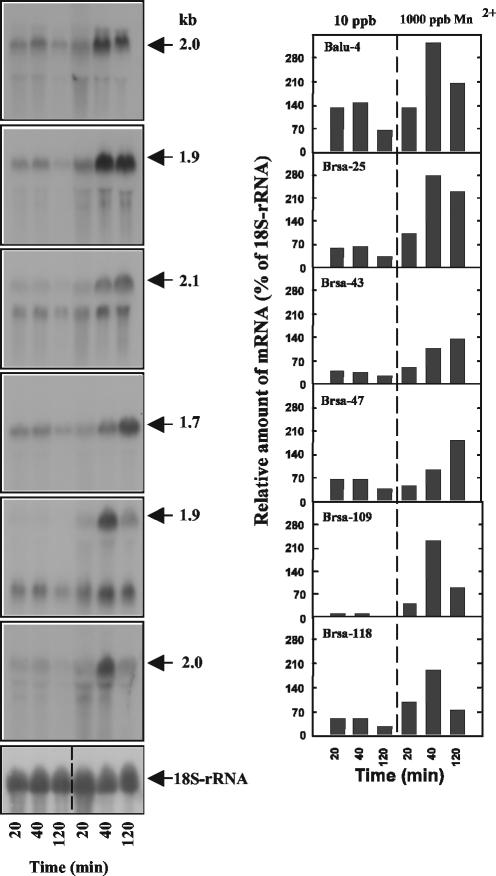
In order to investigate the relative levels and temporal expression patterns of mRNA transcripts, Northern blot analyses were performed for a selection of 12 of the 22 genes potentially involved in Mn2+-responsive morphology switching. The 20-, 40-, and 120-min RNA pools for the Northern analyses were the same as those used for the SSH library construction. All of the filament-associated genes, except the Brsa-43 and Brsa-109 genes, had one transcript (Fig. 5). The levels of the transcripts for each gene were determined at different time points by densitometry of the Northern blots. The relative transcription levels for all six genes at different time points both before and after addition of Mn2+ (induction of filamentous growth) were estimated based on the 18S rRNA amounts at each time point (Fig. 5, right panel). In the absence of Mn2+ induction (pelleted growth condition), the transcription of the six filament-associated genes remained relatively low. Brsa-43 and Brsa-47 transcription gradually increased throughout the time course of Mn2+ induction, while Brsa-25 transcription reached a maximum within 40 min and maintained that level. The transcription of Balu-4, Brsa-109, and Brsa-118 was transient, attaining peak expression at 40 min and declining thereafter (the transcript levels at 40 min were 326, 233, and 192% of the 18S rRNA transcript, respectively).
FIG. 5.
Induction of Balu-4, Brsa-25, Brsa-43, Brsa-47, Brsa-109, and Brsa-118 mRNA by 1,000 ppb of Mn2+. Twenty micrograms of total RNA used in SSH was subjected to denaturing gel electrophoresis and hybridized with radioactively labeled probes prepared from cDNA clone fragments. Autoradiographs of the RNA blotting are shown on the left. Relative RNA levels are plotted on the right. The percentage of the relative amount of mRNA estimated by gel blot intensities was calculated based on relative levels of 18S rRNA.
Similarly, RNA blotting analysis was used to examine the expression patterns of the pellet-associated (Mn2+-suppressed) genes in cultures harvested 20, 40, and 120 min after the addition of 1,000 ppb of Mn2+ or without additional Mn2+ (Fig. 6). The relative transcript levels for the three time points with or without Mn2+ induction were estimated based on the amount of 18S rRNA for each time point (Fig. 6, right panel). The relative transcript levels of clones Arsa-7, Aalu-37, Arsa-43, and Aalu-90 under pelleted growth conditions were at least 300% of the 18S rRNA transcript. The transcripts associated with these four clones decreased significantly 40 min after 1,000 ppb of Mn2+ was added to the 12-h culture. After 120 min, the transcript levels of the four genes (Arsa-7, Aalu-37, Arsa-43, and Aalu-90) were only 57, 26, 70, and 22% of the 18S rRNA levels, respectively. In contrast to the four genes above, Arsa-10 and Arsa-27 exhibited relatively low expression under pelleted growth conditions (10 ppb); however, their response to filamentous growth conditions (addition of 1,000 ppb of Mn2+) was similar to that of the other four highly transcribed, pellet-associated genes, i.e., transcript levels rapidly decreased.
Expression patterns of the Mn2+-responsive transcripts during the citrate production process.
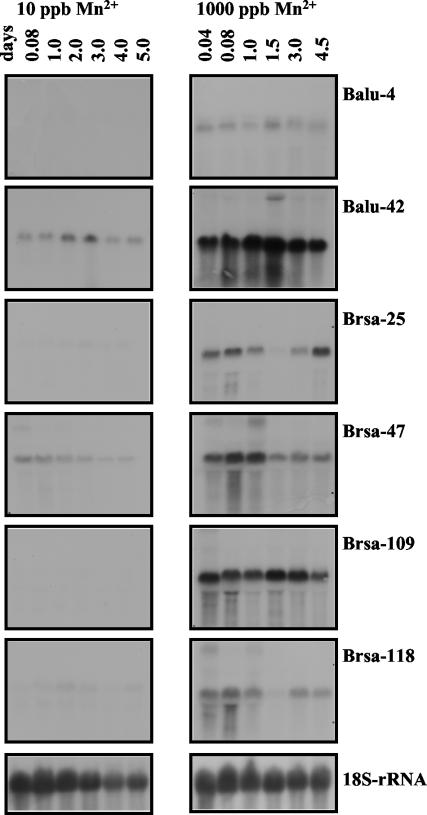
Pelleted morphology and citric acid overproduction are associated physiological traits, as are filamentous morphology and a lack of citrate production. The entire developmental time course of growth and citric acid production in A. niger is completed in approximately 5 days. To evaluate the potential involvement of various morphology control genes with regard to citric acid production, the expression patterns of selected genes were examined at different growth stages extending to 5 days. Figure 7 shows the mRNA accumulation patterns for six filamentous morphology-associated genes (Balu-4, Balu-42, Brsa-25, Brsa-47, Brsa-109, and Brsa-118) from 1 to 5 days after the addition of 1,000 ppb of Mn2+ (noncitrate production condition [NCP]) (right panel of Fig. 7) and without addition of Mn2+ (citrate production condition [CP]) (left panel of Fig. 7). The transcription of all six genes was suppressed under pelleted growth (CP) conditions during the 5-day time course and dramatically enhanced under filamentous growth (NCP) conditions. The transcript levels of clone Balu-4 (G-protein β-subunit) were lower than those of the other five selected clones during the NCP time course, while the Balu-4 transcript was not even detected during the CP time course. The results shown in Fig. 5 and 7 suggest that Balu-4 is indeed required for filamentous (NCP) growth and that Mn2+ only enhanced a transient expression of the Balu-4 gene. This is consistent with previous observations for A. nidulans and N. crassa (42, 58). The suppressive effect of the G-protein β-subunit on vegetative growth of Cryphonectria parasitica was also observed on synthetic medium (19). This suggests that the G-protein β-subunit has dynamic effects on fungal growth and development. Clones Balu-42 and Brsa-109 maintained relatively high steady-state transcription levels over 4.5 days of NCP growth (Fig. 7). The transcription levels of these two genes (on the basis of rRNA levels) were at least four times greater than those of Balu-4 and Brsa-118 and at least two times greater than those of Brsa-25 and Brsa-47 during NCP growth (data not shown). Low transcription was observed for clones Balu-42 and Brsa-47 during the 5 days of pelleted (CP) growth. The Brsa-25, Brsa-109, and Brsa-118 genes, like Balu-4, were specifically expressed under NCP growth conditions. Interestingly, Brsa-25 and Brsa-118 had relatively high transcription levels on the first day of NCP growth but decreased to undetectable levels by 1.5 days (Fig. 7). Transcription of Brsa-25 and Brsa-118 increased on day 3 of NCP growth, but thereafter, the transcription of Brsa-25 increased further while Brsa-118 decreased slightly. This suggests that both Brsa-25 and Brsa-118 are required during the rapid growth stage and also during the later vegetative growth stages that may be associated with certain physiological stresses.
FIG. 7.
RNA gel blot analysis of Balu-4, Balu-42, Brsa-25, Brsa-47, Brsa-109, and Brsa-118 during citrate production (10 ppb; pelleted) and noncitrate production (1,000 ppb; filamentous) growth. The blots contained 15 μg of total RNA prepared from the biomass of A. niger cells grown for 0.04, 0.08, 1, 1.5, 2, 3, 4, 4.5, or 5 days after an initial growth period of 12 h with 10 ppb of Mn2+. All membranes were stripped and hybridized with an 18S rRNA probe to verify equivalent sample loading and for the estimation of the relative transcription of those genes.
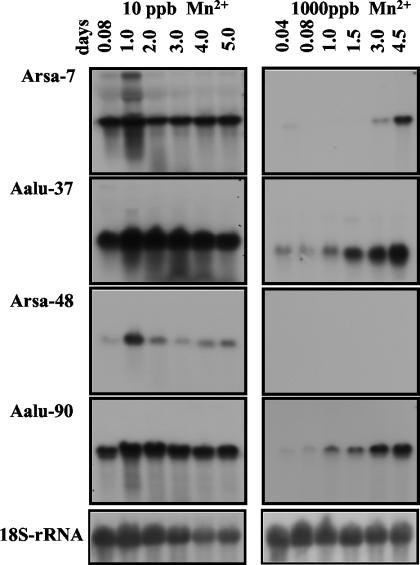
Four pellet-associated clones were also examined during CP and NCP growth conditions. The clones Arsa-7, Aalu-37, and Aalu-90 exhibited high levels of transcription during 5 days of pelleted (CP) growth (Fig. 8, left panel). The relative mRNA levels of these clones (normalized to the 18S rRNA amount) gradually increased (data not shown). During filamentous (NCP) growth, clones Aalu-37 and Aalu-90 had very low transcript levels on the first day of NCP growth, followed by a gradual increase in transcription (Fig. 8). In contrast, the transcription of clone Arsa-7 was suppressed during the first 3 days of NCP growth and rapidly increased thereafter. The transcription of Arsa-48 exhibited a third pattern, increasing rapidly on the first day of pelleted (CP) growth and then gradually decreasing until day 3, followed by another increase during the later stages of CP growth (days 4 and 5) (Fig. 8). Arsa-48 was suppressed during the entire 4.5 days of NCP growth. The results indicate that these genes not only respond to Mn2+ but are also responsive to other factors during filamentous growth.
FIG. 8.
RNA gel blot analysis of Arsa-7, Aalu-37, Arsa-48, and Aalu-90 during citrate production (10 ppb; pelleted) and noncitrate production (1,000 ppb; filamentous) growth. The blots contained 15 μg of total RNA prepared from the biomass of A. niger cells grown for 0.04, 0.08, 1, 1.5, 2, 3, 4, 4.5, or 5 days after an initial growth period of 12 h with 10 ppb of Mn2+. All membranes were stripped and hybridized with an 18S rRNA probe to verify equivalent sample loading and for the estimation of the relative transcription of those genes.
Isolation of the full-length Brsa-25 cDNA and its genomic clone.
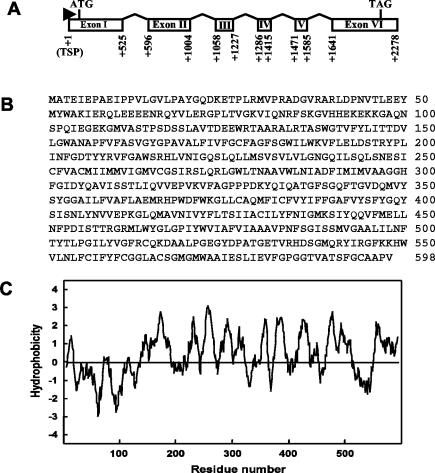
For the putative morphology control genes, isolation of the full-length genomic clone and untranslated regions would be of interest in the search for regulatory elements. In addition, for cDNA clones of unknown function, perhaps a full-length gene would reveal homologies not detected with the partial cDNA sequence. To this end, the SSH clone Brsa-25 (unknown function) was selected for further characterization in this study. The 413-bp fragment of Brsa-25 was used to design two gene-specific oligonucleotide primers. The 5′ and 3′ ends of the Brsa-25 gene were isolated by using RACE-PCR. Sequence analysis confirmed the newly isolated 5′ and 3′ ends of Brsa-25. The full-length cDNA has a 1,797-bp open reading frame, a 62-bp 5′ untranslated region, and a 198-bp 3′ untranslated region. The cDNA encodes a 598-amino-acid protein with an apparent molecular mass of 66.3 kDa, as shown in Fig. 9B. The hydropathy profile analysis of this protein, performed with the Kyte-Doolittle algorithm (24), indicated a highly hydrophobic nature and predicted 8 to 11 putative transmembrane domains (Fig. 9C). To determine the genomic structure and organization of Brsa-25, a 2.28-kb genomic DNA fragment was amplified by PCR with primers based on the two ends of the Brsa-25 cDNA and was sequenced. This full-length gene was compared with the Brsa-25 cDNA sequence. As shown in Fig. 9A, the Brsa-25 gene consists of six exons and five introns. To ensure maximum likelihood of identifying homologous sequences, both the nonredundant database (GenBank) and focused-coverage databases (N. crassa, A. nidulans, and Aspergillus fumigatus genome sequence databases) were used for BLAST analyses. The amino acid sequence of Brsa-25 showed 22% identity with the N amino acid transport system protein of N. crassa. The result of an NCBI conserved-domain search (RPS-BLAST) indicated that Brsa-25 contained transmembrane regions that were 98.2% aligned to the conserved domain of the transmembrane amino acid transporter protein. This suggests that Brsa-25 may be an amino acid transporter or, at minimum, an integral membrane protein.
FIG. 9.
Putative protein encoded by Brsa-25. (A) The diagram shows the Brsa-25 gene structure containing six exons (rectangles) and five introns. ATG is the translation start codon and TAG is the translation stop codon. (B) Deduced amino acid sequence of Brsa-25. (C) Hydropathy plot of the predicted Brsa-25 protein. The plot was constructed according to the method of Kyte and Doolittle (24), with a window of 11 amino acid residues.
Antisense expression of Brsa-25 in A. niger.
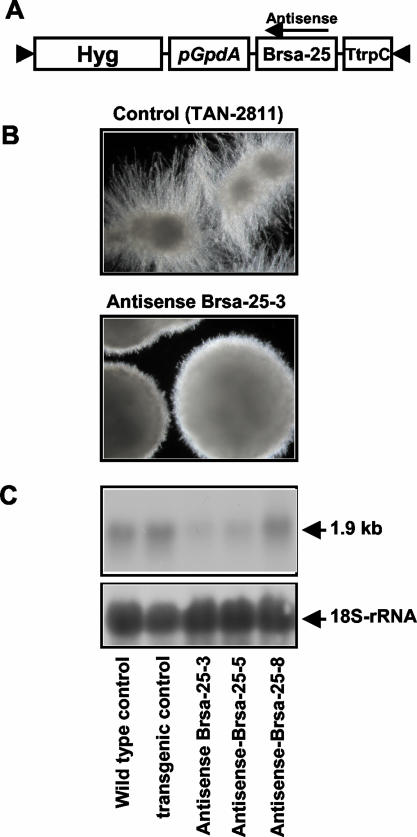
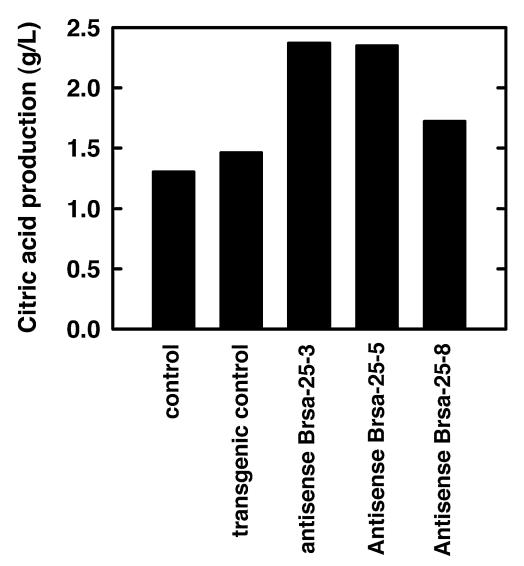
To investigate the potential role of the Brsa-25 gene in A. niger morphology control and citric acid production, an antisense expression vector was constructed (Fig. 10A). A construct containing only the gpdA promoter and trpC terminator was introduced into A. niger as a transgenic control. Ten transgenic controls and 15 antisense A. niger transformants were examined in CAP medium containing 15 ppb of Mn2+ (conditions normally leading to filamentous growth). Eleven of the antisense Brsa-25 transformants of A. niger restricted the filamentous growth compared with the transgenic control in 60-h cultures (Fig. 10B). The citric acid concentration in 60-h cultures was determined and showed that citrate production in the antisense transformants increased an average of 30% versus the production of the transgenic control. Figure 11 shows the citric acid production in the 60-h cultures of the control and transgenic clones shown in Fig. 10C. The citric acid production in the cultures of antisense strains Brsa-25-3 and Brsa-25-5 was about 35% higher than that of the selected control, while the citric acid production in antisense strain Brsa-25-8 was only 11% higher than that of the control. The citric acid production observed in these selected clones was inversely correlated to the levels of mRNA seen in the Northern blot analysis (Fig. 10C). The differences in citric acid production and mRNA depletion by different antisense strains of Brsa-25 likely result from positional effects on transcription resulting from the integration of the antisense cassette into different points in the genome. When the Brsa-25 antisense transformants of A. niger were grown at even higher Mn2+ concentrations (20 ppb), the inhibition of filamentous growth and increase in citrate production became less pronounced (data not shown). The data are consistent with the gene Brsa-25 having the expected effect on A. niger morphology in response to manganese. However, the retention of the sensitivity of morphology development to higher Mn2+ concentrations suggests that morphology control in A. niger is effected by multiple genes.
FIG. 10.
Effect of antisense expression of Brsa-25 on A. niger morphology formation. (A) Diagram of the plasmid pZD570 containing the Brsa-25 gene in antisense orientation. The pGpdA corresponds to the promoter of the glyceraldehyde-3-phosphate dehydrogenase of A. nidulans. TtrpC is the A. nidulans TrpC transcription terminator. This plasmid also contains the hph gene of E. coli, which confers hygromycin resistance. (B) Microscopic observation of the morphology of the transgenic control (TAN-2811) containing the transgene expression vector with only the promoter (pGpdA) and terminator (TtrpC) and the selected Brsa-25 antisense transgenic line (antisense Brsa-25-3) after 60-h culture at 30°C and 250 rpm. (C) The RNA gel blot analysis of steady-state mRNA levels of Brsa-25 in antisense suppression strains. Total RNA was isolated from 60-h cultures of wild-type A. niger (lane 1), transgenic control strains (lane 2), antisense strain Brsa-25-3, -5, and -8 (lanes 3 to 5). Twenty micrograms of total RNA was loaded on each lane and hybridized with the radioactive labeled probe of the Brsa-25 SSH cDNA fragment. The same blot was stripped and hybridized with 18S rRNA for equivalent loading.
FIG. 11.
Suppression of filament-associated gene Brsa-25 leads to enhanced citric acid production. Citric acid in the supernatants of 60-h test tube cultures was measured biochemically. The control was a transformed strain carrying the pGpdA promoter and TtrpC terminator.
In summary, the differentially expressed genes that have a tentatively identified function can be assigned to two general categories: those involved in amino acid or protein metabolism (or cell growth) and those involved in cell regulation. The genes erg13, lys1, metH/D, pyroA, acl1, and tppA that are induced by high Mn2+ levels and the gene pepO that is suppressed by Mn2+ belong in the amino acid metabolism category. The rapid hyphal growth associated with the switch to filamentous morphology observed upon induction by sufficient Mn2+ levels probably requires increased protein production, as well as degradation and utilization of proteins required for the maintenance of the pelleted growth state. The observed induction of genes involved in amino acid anabolism is consistent with this requirement. The expression patterns of lys1 and erg13 exhibited a rapid increase before decreasing, suggesting a transient high demand for de novo protein synthesis. The induced genes, ino1, sfaD, and acl1, and the repressed gene, ubi, belong in the category of cell regulation. One of the 13 genes without a known function or one of the tentatively identified cell regulatory genes may be a keystone gene that controls morphology. Alternatively, multiple genes acting in concert may be required for the observed effect on morphology and citric acid production. Encouragingly, the functional analysis of Brsa-25 indicated that this “unknown” gene was indeed involved in the regulation of morphology formation. Further functional evaluation of the known and unknown genes may reveal their roles in the associated physiological properties of morphology control and citric acid production in A. niger.
Acknowledgments
We thank Thomas W. Wietsma of the William R. Wiley Environmental Molecular Sciences Laboratory at PNNL for performing manganese analyses with an ICP-MS, Diane F. Hu and Katie S. Panther for RNA gel blot image scanning and densitometry, and Scott E. Baker for critical review of the manuscript. DNA sequencing was conducted by the DNA Sequencing and Synthesis Facility of Iowa State University.
Xingxue Mao received a visiting scholarship from Guangdong Academy of Agriculture Science, China. This work was supported by the PNNL Laboratory Directed Research and Development program. Pacific Northwest National Laboratory is operated by the Battelle Memorial Institute for the U.S. Department of Energy under contract DE-AC06-76RL01830.
REFERENCES
- 1.Altschul, S. F., T. L. Madden, A. A. Schaffer, J. Zhang, Z. Zhang, W. Miller, and D. J. Lipman. 1997. Gapped BLAST and PSI-BLAST: a new generation of protein database search programs. Nucleic Acids Res. 25:3389-3402. [DOI] [PMC free article] [PubMed] [Google Scholar]
- 2.Banik, A. K. 1976. Mineral nutrition of Aspergillus niger for citric acid production. Folia Microbiol. (Prague) 21:139-143. [DOI] [PubMed] [Google Scholar]
- 3.Banuelos, O., J. Casqueiro, S. Gutierrez, and J. F. Martin. 2000. Overexpression of the lys1 gene in Penicillium chrysogenum: homocitrate synthase levels, alpha-aminoadipic acid pool and penicillin production. Appl. Microbiol. Biotechnol. 54:69-77. [DOI] [PubMed] [Google Scholar]
- 4.Bergmeyer, H. U. 1985. Metabolites 2: tri- and dicarboxylic acids, purines, pyrimidines and derivatives, coenzymes, inorganic compounds, p. 5-10. In Citric acids. VCH Publishers, Weinheim, Germany.
- 5.Braun, S., and S. E. Vecht-Lifshitz. 1991. Mycelial morphology and metabolite production. Trends Biotechnol. 9:63-68. [Google Scholar]
- 6.Byrne, G. S., and O. P. Ward. 1989. Effect of nutrition on pellet formation by Rhizopus arrhizus. Biotechnol. Bioeng. 33:912-914. [DOI] [PubMed] [Google Scholar]
- 7.Chomczynski, P., and N. Sacchi. 1987. Single-step method of RNA isolation by acid guanidinium thiocyanate-phenol-chloroform extraction. Anal. Biochem. 162:156-159. [DOI] [PubMed] [Google Scholar]
- 8.Church, G. M., and W. Gilbert. 1984. Genomic sequencing. Proc. Natl. Acad. Sci. USA 81:1991-1995. [DOI] [PMC free article] [PubMed] [Google Scholar]
- 9.Clark, D. S. 1962. Submerged citric acid fermentation of ferrocyanide treated beet molasses: morphology of pellets of Aspergillus niger. Can. J. Microbiol. 8:133-136. [DOI] [PubMed] [Google Scholar]
- 10.Cui, Y. Q., R. C. Van Der Lans, and K. C. Luyben. 1997. Effect of agitation intensities on fungal morphology of submerged fermentation. Biotechnol. Bioeng. 55:715-726. [DOI] [PubMed] [Google Scholar]
- 11.Dai, Z., B. S. Hooker, D. B. Anderson, and S. R. Thomas. 2000. Expression of Acidothermus cellulolyticus endoglucanase E1 in transgenic tobacco: biochemical characteristics and physiological effects. Transgenic Res. 9:43-54. [DOI] [PubMed] [Google Scholar]
- 12.de Groot, M. J., P. Bundock, P. J. Hooykaas, and A. G. Beijersbergen. 1998. Agrobacterium tumefaciens-mediated transformation of filamentous fungi. Nat. Biotechnol. 16:839-842. [DOI] [PubMed] [Google Scholar]
- 13.Diatchenko, L., Y. F. Lau, A. P. Campbell, A. Chenchik, F. Moqadam, B. Huang, S. Lukyanov, K. Lukyanov, N. Gurskaya, E. D. Sverdlov, and P. D. Siebert. 1996. Suppression subtractive hybridization: a method for generating differentially regulated or tissue-specific cDNA probes and libraries. Proc. Natl. Acad. Sci. USA 93:6025-6030. [DOI] [PMC free article] [PubMed] [Google Scholar]
- 14.Gurskaya, N. G., L. Diatchenko, A. Chenchik, P. D. Siebert, G. L. Khaspekov, K. A. Lukyanov, L. L. Vagner, O. D. Ermolaeva, S. A. Lukyanov, and E. D. Sverdlov. 1996. Equalizing cDNA subtraction based on selective suppression of polymerase chain reaction: cloning of Jurkat cell transcripts induced by phytohemaglutinin and phorbol-12-myristate-13-acetate. Anal. Biochem. 240:90-97. [DOI] [PubMed] [Google Scholar]
- 15.Habison, A., C. P. Kubicek, and M. Roehr. 1983. Partial purification and regulatory properties of phosphofructokinase from Aspergillus niger. Biochem. J. 209:669-676. [DOI] [PMC free article] [PubMed] [Google Scholar]
- 16.Habison, A., C. P. Kubicek, and M. Rohr. 1979. Phospho-fructokinase as a regulatory enzyme in citric-acid producing Aspergillus niger. FEMS Microbiol. Lett. 5:39-42. [Google Scholar]
- 17.Hosobuchi, M., F. Fukui, H. Matsukawa, T. Suzuki, and H. Yoshikawa. 1993. Morphology control of preculture during production of ML-236B, a precursor of pravastatin sodium, by Penicillium citrinum. J. Ferment. Bioeng. 76:476-481. [Google Scholar]
- 18.Kano, R., Y. Nakamura, S. Watanabe, and A. Hasegawa. 1999. Repeated ubiquitin genes in Trichophyton mentagrophytes. Curr. Microbiol. 39:302-305. [DOI] [PubMed] [Google Scholar]
- 19.Kasahara, S., and D. L. Nuss. 1997. Targeted disruption of a fungal G-protein beta subunit gene results in increased vegetative growth but reduced virulence. Mol. Plant-Microbe Interact. 10:984-993. [DOI] [PubMed] [Google Scholar]
- 20.Katayama, S., N. Adachi, K. Takao, T. Nakagawa, H. Matsuda, and M. Kawamukai. 1995. Molecular cloning and sequencing of the hcs gene, which encodes 3-hydroxy-3-methylglutaryl coenzyme A synthase of Schizosaccharomyces pombe. Yeast 11:1533-1537. [DOI] [PubMed] [Google Scholar]
- 21.Kisser, M., C. P. Kubicek, and M. Roehr. 1980. Influence of manganese on morphology and cell wall composition of Aspergillus niger during citric acid fermentation. Arch. Microbiol. 128:26-33. [DOI] [PubMed] [Google Scholar]
- 22.Kossen, N. W. F. 2000. The morphology of filamentous fungi. Adv. Biochem. Eng. Biotechnol. 70:1-33. [DOI] [PubMed] [Google Scholar]
- 23.Kubicek, C. P., W. Hampel, and M. Roehr. 1979. Manganese deficiency leads to elevated amino-acid pools in citric acid accumulating Aspergillus niger. Arch. Microbiol. 123:73-80. [DOI] [PubMed] [Google Scholar]
- 24.Kyte, J., and R. F. Doolittle. 1982. A simple method for displaying the hydropathic character of a protein. J. Mol. Biol. 157:105-132. [DOI] [PubMed] [Google Scholar]
- 25.Lazo, G. R., P. A. Stein, and R. A. Ludwig. 1991. A DNA transformation-competent Arabidopsis genomic library in Agrobacterium. Bio/Technology 9:963-967. [DOI] [PubMed] [Google Scholar]
- 26.Liang, P., and A. B. Pardee. 1992. Differential display of eukaryotic messenger RNA by means of the polymerase chain reaction. Science 257:967-971. [DOI] [PubMed] [Google Scholar]
- 27.Ma, H., C. P. Kubicek, and M. Roehr. 1985. Metabolic effects of manganese deficiency in Aspergillus niger: evidence for increased protein degradation. Arch. Microbiol. 141:266-268. [DOI] [PubMed] [Google Scholar]
- 28.Magnuson, J. K., and L. L. Lasure. Organic acid production by filamentous fungi. In J. Tkacz (ed.), Advances in fungal bio/technology for industry, agriculture and medicine, in press. Kluwer Academic Publishers, Norwell, Mass.
- 29.Metz, B., and N. W. F. Kossen. 1977. The growth of molds in the form of pellets: a literature review. Biotechnol. Bioeng. 19:781-800. [Google Scholar]
- 30.Metz, B., N. W. F. Kossen, and J. C. van Suizdum. 1979. The rheology of mold suspensions. Adv. Biochem. Eng. 11:103. [Google Scholar]
- 31.Michel, F. C., Jr., E. A. Grulke, and C. A. Reddy. 1992. Determination of the respiration kinetics for mycelial pellets of Phanerochaete chrysosporium. Appl. Environ. Microbiol. 58:1740-1745. [DOI] [PMC free article] [PubMed] [Google Scholar]
- 32.Netik, A., N. V. Torres, J.-M. Riol, and C. P. Kubicek. 1997. Uptake and export of citric acid by Aspergillus niger is reciprocally regulated by manganese ions. Biochim. Biophys. Acta 1326:287-294. [DOI] [PubMed] [Google Scholar]
- 33.Nowrousian, M., S. Masloff, S. Poggeler, and U. Kuck. 1999. Cell differentiation during sexual development of the fungus Sordaria macrospora requires ATP citrate lyase activity. Mol. Cell. Biol. 19:450-460. [DOI] [PMC free article] [PubMed] [Google Scholar]
- 34.Okazaki, K., H. Okayama, and O. Niwa. 2000. The polyubiquitin gene is essential for meiosis in fission yeast. Exp. Cell Res. 254:143-152. [DOI] [PubMed] [Google Scholar]
- 35.Osmani, A. H., G. S. May, and S. A. Osmani. 1999. The extremely conserved pyroA gene of Aspergillus nidulans is required for pyridoxine synthesis and is required indirectly for resistance to photosensitizers. J. Biol. Chem. 274:23565-23569. [DOI] [PubMed] [Google Scholar]
- 36.Pearson, W. R., and D. J. Lipman. 1988. Improved tools for biological sequence comparison. Proc. Natl. Acad. Sci. USA 85:2444-2448. [DOI] [PMC free article] [PubMed] [Google Scholar]
- 37.Pickart, C. M. 2000. Ubiquitin in chains. Trends Biochem. Sci. 25:544-548. [DOI] [PubMed] [Google Scholar]
- 38.Piers, K. L., J. D. Heath, X. Liang, K. M. Stephens, and E. W. Nester. 1996. Agrobacterium tumefaciens-mediated transformation of yeast. Proc. Natl. Acad. Sci. USA 93:1613-1618. [DOI] [PMC free article] [PubMed] [Google Scholar]
- 39.Punt, P. J., and C. A. van den Hondel. 1992. Transformation of filamentous fungi based on hygromycin B and phleomycin resistance markers. Methods Enzymol. 216:447-457. [DOI] [PubMed] [Google Scholar]
- 40.Reichard, U., M. Monod, and R. Ruchel. 1996. Expression pattern of aspartic proteinase antigens in aspergilli. Mycoses 39:99-101. [DOI] [PubMed] [Google Scholar]
- 41.Röhr, M., and C. P. Kubicek. 1981. Regulatory aspects of citric acid fermentation by Aspergillus niger. Process Biochem. 16:34-37. [Google Scholar]
- 42.Rosen, S., J. H. Yu, and T. H. Adams. 1999. The Aspergillus nidulans sfaD gene encodes a G protein beta subunit that is required for normal growth and repression of sporulation. EMBO J. 18:5592-5600. [DOI] [PMC free article] [PubMed] [Google Scholar]
- 43.Ruijter, G. J. G., H. Panneman, D.-B. Xu, and J. Visser. 2000. Properties of Aspergillus niger citrate synthase and effects of citA overexpression on citric acid production. FEMS Microbiol. Lett. 184:35-40. [DOI] [PubMed] [Google Scholar]
- 44.Sanchez-Marroquin, A., R. Carreno, and M. Ledezma. 1970. Effect of trace elements on citric acid fermentation by Aspergillus niger. Appl. Microbiol. 20:888-892. [DOI] [PMC free article] [PubMed] [Google Scholar]
- 45.Schreferl, G., C. P. Kubicek, and M. Roehr. 1986. Inhibition of citric acid accumulation by manganese ions in Aspergillus niger mutants with reduced citrate control of phosphofructokinase. J. Bacteriol. 165:1019-1022. [DOI] [PMC free article] [PubMed] [Google Scholar]
- 46.Schweiger, L. B. 1961. Production of citric acid by fermentation. Miles Laboratories, Inc., Elkhart, Ind.
- 47.Serizawa, N., M. Hosobuchi, and H. Yoshikawa. 1997. Biochemical and fermentation technological approaches to production of pravastatin, a HMG-CoA reductase inhibitor, p. 779-804. In Drugs and pharmaceutical sciences. Marcel Dekker, New York, N.Y.
- 48.Silverman-Gavrila, L. B., and R. R. Lew. 2002. An IP(3)-activated Ca(2+) channel regulates fungal tip growth. J. Cell Sci. 115:5013-5025. [DOI] [PubMed] [Google Scholar]
- 49.Smith, J. J., M. D. Lilly, and R. I. Fox. 1990. The effect of agitation on the morphology and penicillin production of Penicillium chrysogenum. Biotechnol. Bioeng. 35:1011-1023. [DOI] [PubMed] [Google Scholar]
- 50.St. John, T. P., and R. W. Davis. 1979. Isolation of galactose-inducible DNA sequences from Saccharomyces cerevisiae by differential plaque filter hybridization. Cell 16:443-452. [DOI] [PubMed] [Google Scholar]
- 51.Sugiyama, M., and J. Nikawa. 2001. The Saccharomyces cerevisiae Isw2p-Itc1p complex represses INO1 expression and maintains cell morphology. J. Bacteriol. 183:4985-4993. [DOI] [PMC free article] [PubMed] [Google Scholar]
- 52.Tomkinson, B. 1999. Tripeptidyl peptidases: enzymes that count. Trends Biochem. Sci. 24:355-359. [DOI] [PubMed] [Google Scholar]
- 53.Tucker, K. G., and C. R. Thomas. 1992. Mycelial morphology: the effect of spore inoculum level. Biotechnol. Lett. 14:1071-1074. [Google Scholar]
- 54.Von Stein, O. D., W. G. Thies, and M. Hofmann. 1997. A high throughput screening for rarely transcribed differentially expressed genes. Nucleic Acids Res. 25:2598-2602. [DOI] [PMC free article] [PubMed] [Google Scholar]
- 55.Wongwicharn, A., B. McNeil, and L. M. Harvey. 1999. Effect of oxygen enrichment on morphology, growth, and heterologous protein production in chemostat cultures of Aspergillus niger B1-D. Biotechnol. Bioeng. 65:416-424. [DOI] [PubMed] [Google Scholar]
- 56.Wynn, J. P., A. bin Abdul Hamid, and C. Ratledge. 1999. The role of malic enzyme in the regulation of lipid accumulation in filamentous fungi. Microbiology 145:1911-1917. [DOI] [PubMed] [Google Scholar]
- 57.Xu, J., L. Wang, D. Ridgway, T. Gu, and M. Moo-Young. 2000. Increased heterologous protein production in Aspergillus niger fermentation through extracellular proteases inhibition by pelleted growth. Biotechnol. Prog. 16:222-227. [DOI] [PubMed] [Google Scholar]
- 58.Yang, Q., S. I. Poole, and K. A. Borkovich. 2002. A G-protein beta subunit required for sexual and vegetative development and maintenance of normal G alpha protein levels in Neurospora crassa. Eukaryot. Cell 1:378-390. [DOI] [PMC free article] [PubMed] [Google Scholar]
- 59.Yun, S. I., A. R. Yahya, M. Malten, D. Cossar, W. A. Anderson, J. M. Scharer, and M. Moo-Young. 2001. Peptidases affecting recombinant protein production by Streptomyces lividans. Can. J. Microbiol. 47:1137-1140. [PubMed] [Google Scholar]


