

Significance
Lab-on-a-chip devices aim to miniaturize laboratory procedures on microfluidic chips, which contain liquid circuits instead of electronics. Although the chips themselves are small, they are typically dependent on off-chip control machinery that negates their size advantage. If a computer controller could be built out of microfluidic valves and channels, it could be integrated to create a complete system-on-a-chip. We engineer a critical component for such a computer: a microfluidic clock oscillator with suitable timing accuracy to control diagnostic assays. Further, we leverage this oscillator to build a self-driving pump for on-chip liquid transport. Thus, we demonstrate two critical components for building self-contained lab-on-a-chip devices.
Keywords: fluid dynamics, digital computing
Abstract
Frequency references are fundamental to most digital systems, providing the basis for process synchronization, timing of outputs, and waveform synthesis. Recently, there has been growing interest in digital logic systems that are constructed out of microfluidics rather than electronics, as a possible means toward fully integrated laboratory-on-a-chip systems that do not require any external control apparatus. However, the full realization of this goal has not been possible due to the lack of on-chip frequency references, thus requiring timing signals to be provided from off-chip. Although microfluidic oscillators have been demonstrated, there have been no reported efforts to characterize, model, or optimize timing accuracy, which is the fundamental metric of a clock. Here, we report pneumatic ring oscillator circuits built from microfluidic valves and channels. Further, we present a compressible-flow analysis that differs fundamentally from conventional circuit theory, and we show the utility of this physically based model for the optimization of oscillator stability. Finally, we leverage microfluidic clocks to demonstrate circuits for the generation of phase-shifted waveforms, self-driving peristaltic pumps, and frequency division. Thus, pneumatic oscillators can serve as on-chip frequency references for microfluidic digital logic circuits. On-chip clocks and pumps both constitute critical building blocks on the path toward achieving autonomous laboratory-on-a-chip devices.
The complexity of microfluidic systems has exploded over the last decade, achieving highly multiplexed, automated operations by integrating up to thousands of pumps and valves onto a single chip (1–4). Typically in microfluidic large-scale integration, valves are actuated by an off-chip pneumatic source gated by mechanical solenoid valves under computer control. This modular and intuitive approach has seen great success, but the complexity of the off-chip components and connections are detrimental to cost and reliability, posing a barrier to widespread adoption outside of laboratory settings. In particular, size and portability are important for applications such as point-of-care diagnostics. Next-generation microfluidic systems are envisioned to contain embedded controls, enabling self-contained devices that can autonomously execute a set of preprogrammed operations (5).
An elegant solution would be to perform digital logic operations within the microfluidic circuits themselves, thus obviating the need for machinery to interface between the electrical and fluidic realms. Using elastomeric valves as transistor analogs, various groups have demonstrated fundamental building blocks such as Boolean logic gates (6–10), memory latches (6, 8–10), and frequency-sensitive valves (11, 12), as well as more complex systems such as shift-registers (7, 8, 10) and adders (7). Digital logic operations have also been demonstrated by using microfluidic droplets to represent binary information (13–15).
Although a number of digital components have been achieved, the lack of on-chip timing references has remained a key barrier to achieving fully autonomous microfluidic systems. Previous reports have generally required off-chip timing signals to provide synchronization between different circuit blocks (7, 8, 10), drive peristaltic pumping (1, 16, 17), and coordinate the timing of biochemical reactions (12, 18, 19). Recent demonstrations of self-oscillating hydraulic (20, 21) and pneumatic (8, 10) circuits represent an important step forward, but there have been no reported efforts to ensure the frequency stability of these circuits. Here, we characterize, model, and optimize timing accuracy in microfluidic oscillators and thus achieve a microfluidic clock reference. An important step in this process is the development of an analytical model for describing the behavior of pneumatic circuits, which are governed by compressible flow and therefore unsuitable for analysis by conventional circuit theory. In addition, we demonstrate digital logic circuits under the control of integrated clock oscillators. In particular, we successfully demonstrate self-driving peristaltic pumps. We thus achieve clock oscillators and peristaltic pumps that operate without off-chip controls, constituting two critical components for the realization of autonomous microfluidic systems.
Results and Discussion
We use a similar approach to microfluidic logic as that pioneered by Grover, Jensen, Mathies, and colleagues (6, 7, 17) using pneumatic membrane valves that are closed at rest and opened by applying vacuum to the gate input (Fig. 1A). This three-terminal device can be thought of analogously to an n-type metal-oxide-semiconductor (NMOS) field effect transistor, as both are normally-off devices. Pneumatic logic gates and circuits can be constructed by mimicking the NMOS logic family of electronics, with transistors replaced by valves, wires replaced by channels, and resistors replaced by long, narrow channels (Fig. 1B). Instead of being powered by a voltage differential as in electronics, these circuits are powered by a pressure differential. We define vacuum to be the supply and atmospheric pressure to be the ground; vacuum represents binary 1, and atmospheric pressure represents binary 0. This convention maintains the analogy to NMOS logic, because the membrane valves open with an input of 1. All of the fundamental Boolean operations are possible in this technology (6, 8). In the case of a binary inverter (Fig. 1B), an input of 1 opens the valve and pulls down the output to 0, whereas an input of 0 closes the valve, allowing current through the pull-up resistor to bring the output to 1.
Fig. 1.

Pneumatic inverter and ring oscillator. (A) Normally off elastomeric valve (cross section). The sealed channel is opened when vacuum is applied to deform the valve membrane. (B) Pneumatic inverter gate (Right) is analogous to NMOS inverter (Left). Vdd, voltage supply; GND, ground; VAC, vacuum supply; ATM, atmospheric pressure. (C) Inverter transfer function reveals high nonlinear gain. (D) Ring oscillator circuit is formed by an odd number of inverter gates connected in a closed loop. (E) Video microscopy of valve actuation pattern in ring oscillator (22 ms between frames). (F) Oscillatory waveform of a single valve, captured by measuring the deflection of an incident laser beam. (G) Fourier transform of a 10-min time course. The quality factor Q is ∼100.
Vacuum-driven pneumatic logic gates exhibit high nonlinear gain (Fig. 1C), which is critical for noise suppression in digital systems and allows for fan-out and cascading (22). It is likely that gain occurs because the adhesion of the membrane to the valve seat dominates over the mechanical elasticity of the membrane, thus causing the valve to remain fully closed below a threshold pressure and to snap fully open quickly once that threshold is exceeded and adhesion is broken. This intrinsic nonlinear gain is characteristic of all vacuum-driven pneumatic logic technologies (7, 8). In contrast, pressure-driven hydraulic technologies require additional engineering to achieve gain (9, 10, 23, 24).
We constructed ring oscillator circuits by connecting an odd number of pneumatic inverter gates in a closed loop (Fig. 1D), creating stable oscillatory behavior on the application of vacuum power (Fig. 1E and Movies S1 and S2). Circuit dynamics were characterized by measuring laser deflection off of the surface of the gate membrane of a single valve (Fig. 1 F and G). Ring oscillators are highly useful in semiconductor process control, as the output frequency is easy to measure and gives insight into a number of physical device parameters (25). Likewise, our pneumatic ring oscillators proved useful as a characterization tool in the development of an analytical model for pneumatic circuits.
Previously, Mosadegh et al. presented an analytical model for a hydraulic microfluidic oscillator (26). Because water is incompressible, this analysis was similar to conventional electrical circuit theory. In contrast, compressible flow in pneumatic circuits requires a different analytical approach. Let us consider the dynamics of a single valve in the ring oscillator as it switches from closed to open. Once the previous stage switches closed, air begins to be drawn out from the gate input of the valve, thus gradually decreasing the pressure over the valve membrane (Fig. 2A). The rate of airflow is limited by the resistance of the channel between the vacuum supply and the valve chamber. Let us calculate the time required for the pressure to reach the threshold vacuum pressure to open the valve. We will make the approximation that before reaching the threshold pressure, the membrane does not deflect, and thus the volume of the valve chamber,  , remains constant.
Fig. 2.

Definition of variables. (A) During valve opening, air is drawn out of the chamber with volume Vo, through resistance Ro, thus decreasing the pressure, p(t), over the valve membrane until the threshold pressure for valve opening, Pto is reached. Q(t) is volumetric flow rate, and I(t) is molecular flow rate at the entrance to the valve chamber. We define I(t) to be positive for flow into the valve chamber and negative for flow out of the chamber. (B) During valve closing, air flows into the chamber with volume Vc, through resistance Rc, until the threshold pressure for valve closing, Ptc, is reached. Vc < Vo because there is less volume in the valve chamber with the membrane deflected.
We begin with Poiseuille's equation for compressible fluids
 |
where  is the supply vacuum pressure,
  is the pneumatic resistance, and
  is the pressure in the valve chamber. For a compressible fluid, the volumetric flow rate
  is not the same as the molecular flow rate. Using the ideal gas law, the molecular flow rate
  at the entrance to the valve chamber can be expressed as
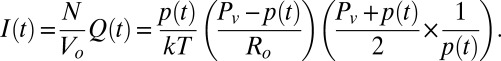 |
The rate of pressure change in the valve chamber can be expressed by differentiating the ideal gas law with respect to time
 |
Because we assume that the valve membrane remains stationary, the first term in the above equation is eliminated. We then set  to give
 |
which can be rearranged to give the following governing equation:
This derivation assumes laminar flow, which is valid because the moderate gas velocities (∼10 m/s) and small channel dimensions (50 µm diameter) of our circuits result in a maximum Reynolds number of 28 (SI Text). In addition, the mean free path of gas molecules is 0.4 µm at the minimum pressure of 2.5 psia, giving a maximum Knudsen number of 0.016 (SI Text). As dimensions are reduced for circuit scaling, adjustments to  to account for slip flow may be required for channel diameters of ∼10 µm. At channel dimensions of ∼1 µm, continuum assumptions will break down and our model may no longer be valid. However, this is a worst-case estimate for the highest flow rates and lowest pressures.
Eq. 1 is a first-order nonlinear ordinary differential equation. Although our system is similar to an electrical resistor-capacitor (RC) circuit, the electrical analog is governed by a linear differential equation, whereas compressible flow in our pneumatic circuit results in a nonlinear equation. Nevertheless, an analytical solution exists. We start with the special case where  (i.e., perfect vacuum supply), giving
Solving this ordinary differential equation with an initial condition of  gives the solution
 |
Thus, the solution has a form  , in contrast to the exponential form that would be obtained with incompressible flow or electrical RC circuits. Solving for the characteristic time to decay to a value of
  , we obtain a time constant
 |
The special case solution gives simple relationships that are helpful for gaining intuition into system behavior. However, the solution to the full governing equation will prove to be necessary in some cases. Solving Eq. 1 (SI Text) with initial condition  gives
gives
 |
Notably, Eq. 3 reduces to Eq. 2 by taking the limit as  , using a Taylor series expansion of the hyperbolic tangent terms (SI Text).
Using Eq. 3, we can solve (SI Text) for the time  required to draw the valve chamber from atmospheric pressure
  down to the threshold pressure
  for opening the valve (Fig. 1C)
 |
In a similar manner, we can solve for the time  required to fill the valve chamber from
  up to the threshold closing pressure
  (Fig. 2B)
 |
Thus, the oscillation period  of a ring oscillator composed of n inverter stages is given by
Our oscillator circuits typically use a large pull-up resistor and a short path from the valve to ground, hence, Ro » Rc and  dominate over
  . Thus, the oscillation period is predicted to vary linearly with
  . To test this prediction, we constructed a set of oscillators with a range of different pull-up resistor sizes. As shown in Fig. 3A, frequency scaled linearly with
  as predicted for larger resistors, but the increase in frequency plateaued at around 5 Hz, even as resistor size continued to decrease. We hypothesized that this resulted from resistance in the circuit separate from the explicit pull-up resistors. This parasitic resistance may begin to dominate in circuits with smaller pull-up resistors, such that the resistors contribute negligibly to the total
  . When the circuit was redrawn to minimize parasitic resistance by reducing interconnect length (Fig. 3B), higher oscillation frequencies were achieved, reaching nearly 50 Hz. As a point of comparison, hydraulic microfluidic oscillators that were recently reported are slower by roughly an order of magnitude (10, 20, 21, 26). The difference in viscosity between air and water likely plays an important role in this difference in speed.
Fig. 3.

Oscillator characterization and optimization. (A) Oscillator frequency scales linearly with the inverse of the pull-up resistance, until plateauing at ∼5 Hz. (B) With reduced parasitic resistance, oscillator frequency reaches almost 50 Hz before plateauing. (C) Frequency also scales linearly with inverse volume. For A–C, error bars denote SD across three devices. (Scale bars, 1 mm.) (D) Frequency variance of three-inverter oscillator over 10 min is 1.4% SD. (E) Frequency variance of 13-inverter oscillator is only 0.1% SD. (Scale bars for D and E, 5 mm.) (F) Frequency drift averaged 4%/h in untreated oscillators, but thermal curing reduced drift to <1%/h. (G) Oscillator frequency as a function of supply vacuum pressure. Error bars denote SD across three trials. The fitted curve represents Eq. 6 plotted with variables chosen as follows: Ptc = 13.92, Pto = 8.8, RoVo = 0.820, RcVc = 0.205, and n = 3.
Oscillation period is also predicted to vary linearly with  , which we tested by the addition of reservoirs of different sizes in series with the inverter valve. As shown in Fig. 3C, frequency scaled linearly with
  as predicted. Because the volume of only one inverter was varied, the delay of the other two inverters began to play a significant role for smaller volumes, leading to a deviation from linearity at higher frequencies.
Frequency stability is one of the most critical qualities of a frequency reference, but this metric has not been previously investigated in microfluidic oscillators. To characterize frequency drift, we recorded oscillator frequency over 400 min of continuous operation, revealing a shift from 2.6 to 3.2 Hz, or 4%/h (Fig. 3F). To understand the physical basis for this drift behavior, we returned to Eq. 4. Resistance,  , and volume,
  , are structural parameters that would not be expected to change significantly over the course of hours. Likewise, vacuum supply pressure,
  , and atmospheric pressure,
  , were maintained to better than 2% (0.2 psi) over the entire time course and thus ruled out as causes. That leaves only
  , the threshold pressure for valve opening. Examination of Eq. 4 reveals that a drift toward higher oscillation frequencies would occur if the threshold shifted such that weaker vacuum pressures became sufficient to open the valve. A possible mechanism for such a shift in threshold is a change in the adhesion of polydimethylsiloxane (PDMS) to glass at the valve seat. Eddington et al. previously reported that PDMS surface properties can change over time due to the diffusion of low molecular weight chains from the bulk of the PDMS to the surface (27). Importantly, this same report indicated that the PDMS surface can be stabilized by accelerated aging through thermal curing (27). Consequently, we attempted thermal curing of assembled ring oscillators before operation, at 85 °C or 120 °C for 15 h. Both treatments resulted in notably reduced frequency drift (Fig. 3F), with the 120 °C treatment reducing drift to less than 1%/h. This level of timing accuracy is suitable for controlling typical biochemical reactions for point-of-care diagnostics and many other laboratory-on-a-chip applications.
In addition to long-term frequency drift, another figure of merit for frequency references is short-term variation, also known as jitter. As shown in Fig. 3D, a three-inverter ring oscillator exhibited a number of fluctuations away from the baseline frequency over a 10-min span, with an SD of 1.4%. In contrast, a 13-inverter ring oscillator exhibited much more stable behavior, with an SD of 0.1% (Fig. 3E). This improvement is likely related to the fact that in the larger ring, the switching of a single inverter occupies a smaller duty cycle, giving more opportunity for transients to settle before it comes time to switch again. Importantly, oscillator period scales with the number of inverter stages (Eq. 6); hence, similar frequencies can be achieved by either a few large inverters or by many small inverters. Therefore, frequency jitter can be reduced in ring oscillators by adding inverter stages without needing to sacrifice a large amount of additional chip real estate.
Up to this point, we assumed that the vacuum supply pressure does not vary; however, this assumption may not be valid for some vacuum sources. Thus, it is valuable to characterize frequency variation as a function of supply pressure. We measured a decrease in oscillator frequency as the supply vacuum strength was decreased (Fig. 3G). Interestingly, the greatest frequency drop occurred between 4 and 8 psia. Below 4 psia, the frequency change was relatively small, which is beneficial because the oscillator is thus somewhat robust against small to moderate deviations in the supply vacuum pressure. Insight into the shape of this frequency-pressure curve can once again be gained by returning to our compressible-flow circuit model. Eq. 4 predicts a relationship between oscillation period,  , and supply pressure,
  ; however, the shape of this function does not reproduce the slow initial drop off that was experimentally observed. It is only when considering both Eqs. 4 and 5 together that key characteristics of the measured curve can be reproduced. The fitted curve in Fig. 3G is produced by plotting Eq. 6 with a 4:1 ratio between
  and
and  . As the strength of the supply vacuum decreases from 2 psia, the opening time,
 , increases, whereas the closing time,
  , decreases; thus, the two effects partially counteract each other. Decreased vacuum supply results in decreased drive current, resulting in slower opening time. However, during closing, decreased vacuum supply means that the valve starts out closer to the threshold, thus resulting in faster closing. At lower levels of vacuum supply, the opening time dominates and the oscillation frequency drops off rapidly.
A possible advantage of microfluidic logic systems is that they could be operated without electricity, which might be useful for limited resource settings or radiation hard applications. We explored a number of manually operated vacuum sources and characterized how long the system could maintain adequate supply pressure while running an oscillator. Based on Fig. 3G, we defined 5 psia as the maximum supply pressure, because oscillator frequency is maintained within a 10% deviation as long as the supply pressure is below this threshold. We found that a single pull of a 60-mL syringe was sufficient to run an oscillator circuit for 1 min (Fig. S1A and Movie S3). A manual vacuum pump with an integrated storage container (Topsider MVP 5060; Airpower America) was able to sustain circuit operation indefinitely with intermittent pumping (about 6 strokes/min) and continued to maintain adequate pressure for >1 h after pumping ceased (Fig. S1B). A hand pump (Mityvac MV8500; Lincoln Industrial Corp.) and mouth suction were also both successful in powering oscillator activity (Fig. S1 C and D); however, the difficulty in maintaining a steady vacuum makes both of these methods impractical.
Having developed a quality frequency reference, we next sought to leverage this component within a digital system. On-chip peristaltic pumping has been critical in enabling the integrated microfluidics revolution of the last decade (1, 16, 17). Pumping requires a set of valves to be rapidly opened and closed in a highly coordinated manner, which usually necessitates off-chip control signals. We recognized that the different nodes within a ring oscillator circuit each follow square wave functions that are phase-shifted with respect to one another. Peristaltic pumping was successfully achieved by driving three in-series liquid valves from the nodes of a three-inverter ring oscillator (Fig. 4A and Movie S4). The resulting pump pattern is similar to the “single chamber” pumping sequence recently described by Stockton et al. (28). In that report, the authors also showed that more efficient pumping (faster by 70%) could be achieved by using a pattern that they termed the “double chamber” sequence (28). Although this sequence is impossible to generate from a three-inverter ring oscillator, the use of more inverters produces a greater number of waveforms to choose from. We found that the double chamber pumping sequence could be readily generated by properly selecting three nodes from a five-inverter ring oscillator (Fig. 4B). A significant improvement in pump efficiency was indeed observed, with the five-inverter system (Movie S5) pumping at 14.7 µL/min compared with 10.7 µL/min for the three-inverter system. Peristaltic pumping is a powerful tool that enables highly versatile routing of liquids on chip, including recirculation around closed loops. In a parallel publication, we leverage on-chip control of peristaltic pumping to demonstrate metering, mixing, incubation, and washing on an integrated chip with minimal external input (29). Peristaltic pumping can also be achieved with a shift-register design, but this approach requires more than twice as many gates and has only been demonstrated with an off-chip clock (10).
Fig. 4.

Waveform synthesis for peristaltic pumping. (A) Connecting the nodes of a three-inverter ring oscillator to three in-series liquid valves results in an actuation pattern that achieves peristaltic pumping. (B) The more efficient double chamber peristaltic pump pattern can be achieved by properly selecting three nodes from a five-inverter ring oscillator. Here, each successive liquid valve is phase-shifted by 72°.
Finally, frequency division is commonly used in digital systems to generate slower reference frequencies based off of a single source. We successfully demonstrated one-half and one-quarter frequency division by using an asynchronous counter circuit (Fig. 5). The input clock signal is first passed through an edge detection circuit (8), which briefly outputs a binary 1 at each rising edge of the input square wave function. Each binary 1 then triggers a T flip-flop (8), which toggles its state between 0 and 1 each time that it is triggered. The output of the T flip-flop is thus a square wave at half the frequency of the input function. Additional stages can be added sequentially, with the frequency being halved again in every subsequent stage. Fig. 5 and Movie S6 illustrate a two-stage frequency divider, generating f/2 and f/4.
Fig. 5.

Frequency divider. (A) Schematic layout of a two-bit counter composed of T flip-flops and edge detectors. The input frequency is divided by a factor of 2 after the first stage and by a factor of 4 after the second stage. The square regions serve as large volumes that function analogously to electrical capacitors. (B) Fabricated frequency divider circuit. Indicator valves are connected to the output nodes to visualize the state of the circuit. (C) Magnified images of the output indicator valves show the operation of the circuit. Whereas the input clock signal completes four cycles, the left bit completes only two cycles, and the right bit completes only one cycle.
In conclusion, we demonstrated that pneumatic oscillators can function as stable frequency references for the control of digital systems. As we have operated such devices for over a million cycles without failure (>1 wk at 3 Hz), the performance and robustness of these circuits should be adequate to provide timing control in digital systems for point-of-care, lab-on-a-chip applications. Importantly, unlike hydraulic and electrical circuits, the engineering of pneumatic circuits requires accounting for the compressibility of air. We demonstrated an analytical approach to evaluating compressible flow circuits and showed that the resulting model can accurately predict the behavior of pneumatic oscillators and successfully guide their optimization. Thus, our approach represents a valuable tool for the design and modeling of future pneumatic circuits.
Materials and Methods
Device Fabrication.
Pneumatic microfluidic circuits were fabricated in glass as previously detailed (17). Briefly, a Borofloat photomask blank (Telic Co.) coated with chromium and AZ1500 photoresist was exposed to UV light through a printed Mylar mask (Fineline Imaging). After development, exposed chromium was removed by chromium etchant (Transene Mask Etchant; Transene Co.). Glass etching was then performed using 49% (wt/vol) hydrofluoric acid. Ports were drilled using a diamond grinding point (4376A11; McMaster-Carr) on a Dremel tool (400XP; Dremel). Via holes were formed in a PDMS membrane (HT-6240; Rogers Corp.) by coring with a blunt hollow needle. Two glass layers and one PDMS layer were aligned manually and sandwiched together with the PDMS in the middle.
High-Speed Microscopy.
High-speed microscopy was performed with an XPRI camera (AOS Technologies) or EX-FH100 camera (Casio Computer Co.). Volumetric pump rates were calculated by extracting the speed of a liquid front within a channel from captured video and combining this data with measured channel dimensions.
Frequency Measurement.
Oscillator frequencies were measured by reflecting the beam from a 650-nm laser off of a valve membrane onto a photodiode (TSL-14S-LF; TAOS) connected to a data acquisition system (DI-158U; DATAQ Instruments). The frequency spectrum of the photodiode voltage was calculated using MATLAB (The Mathworks).
Inverter Transfer Function.
Input and output were connected to separate pressure transducers (PX139-015D4V; Omega) and an Arduino data acquisition system. Input pressure was controlled with a vacuum regulator (V-800–30-W/K; Coast Pneumatics), and the vacuum supply was provided by an electrical pump (4176K11; McMaster-Carr). The input was swept from atmospheric pressure to 2.7 psia and back to atmospheric pressure. Each point on the transfer function was measured at steady state.
Supplementary Material
Acknowledgments
We thank William Grover for providing helpful insights regarding the logic technology and instruction on the fabrication process. This work was supported in part by National Science Foundation Grant ECCS-1102397 and Defense Advanced Research Projects Agency Nanoelectromechanical/Microelectromechanical Science & Technology Fundamentals Program Grant N66001-1-4003 issued by the Space and Naval Warfare Systems Center Pacific to the Micro/Nano Fluidics Fundamentals Focus Center.
Footnotes
The authors declare no conflict of interest.
This article is a PNAS Direct Submission. H.T.S. is a guest editor invited by the Editorial Board.
This article contains supporting information online at www.pnas.org/lookup/suppl/doi:10.1073/pnas.1310254110/-/DCSupplemental.
References
- 1.Unger MA, Chou HP, Thorsen T, Scherer A, Quake SR. Monolithic microfabricated valves and pumps by multilayer soft lithography. Science. 2000;288(5463):113–116. doi: 10.1126/science.288.5463.113. [DOI] [PubMed] [Google Scholar]
- 2.Thorsen T, Maerkl SJ, Quake SR. Microfluidic large-scale integration. Science. 2002;298(5593):580–584. doi: 10.1126/science.1076996. [DOI] [PubMed] [Google Scholar]
- 3.Wang Y, et al. An integrated microfluidic device for large-scale in situ click chemistry screening. Lab Chip. 2009;9(16):2281–2285. doi: 10.1039/b907430a. [DOI] [PMC free article] [PubMed] [Google Scholar]
- 4.Anderson MJ, Hansen CL, Quake SR. Phase knowledge enables rational screens for protein crystallization. Proc Natl Acad Sci USA. 2006;103(45):16746–16751. doi: 10.1073/pnas.0605293103. [DOI] [PMC free article] [PubMed] [Google Scholar]
- 5.Mosadegh B, Bersano-Begey T, Park JY, Burns MA, Takayama S. Next-generation integrated microfluidic circuits. Lab Chip. 2011;11(17):2813–2818. doi: 10.1039/c1lc20387h. [DOI] [PubMed] [Google Scholar]
- 6.Grover WH, Ivester RH, Jensen EC, Mathies RA. Development and multiplexed control of latching pneumatic valves using microfluidic logical structures. Lab Chip. 2006;6(5):623–631. doi: 10.1039/b518362f. [DOI] [PubMed] [Google Scholar]
- 7.Jensen EC, Grover WH, Mathies RA. Micropneumatic digital logic structures for integrated microdevice computation and control. J Microelectromech Syst. 2007;16(6):1378–1385. [Google Scholar]
- 8.Rhee M, Burns MA. Microfluidic pneumatic logic circuits and digital pneumatic microprocessors for integrated microfluidic systems. Lab Chip. 2009;9(21):3131–3143. doi: 10.1039/b904354c. [DOI] [PMC free article] [PubMed] [Google Scholar]
- 9.Weaver JA, Melin J, Stark D, Quake SR, Horowitz MA. Static control logic for microfluidic devices using pressure-gain valves. Nat Phys. 2010;6(3):218–223. [Google Scholar]
- 10.Devaraju NS, Unger MA. Pressure driven digital logic in PDMS based microfluidic devices fabricated by multilayer soft lithography. Lab Chip. 2012;12(22):4809–4815. doi: 10.1039/c2lc21155f. [DOI] [PubMed] [Google Scholar]
- 11.Langelier SM, Chang DS, Zeitoun RI, Burns MA. Acoustically driven programmable liquid motion using resonance cavities. Proc Natl Acad Sci USA. 2009;106(31):12617–12622. doi: 10.1073/pnas.0900043106. [DOI] [PMC free article] [PubMed] [Google Scholar]
- 12.Leslie DC, et al. Frequency-specific flow control in microfluidic circuits with passive elastomeric features. Nat Phys. 2009;5(3):231–235. [Google Scholar]
- 13.Prakash M, Gershenfeld N. Microfluidic bubble logic. Science. 2007;315(5813):832–835. doi: 10.1126/science.1136907. [DOI] [PubMed] [Google Scholar]
- 14.Zagnoni M, Cooper JM. A microdroplet-based shift register. Lab Chip. 2010;10(22):3069–3073. doi: 10.1039/c0lc00219d. [DOI] [PubMed] [Google Scholar]
- 15.Toepke MW, Abhyankar VV, Beebe DJ. Microfluidic logic gates and timers. Lab Chip. 2007;7(11):1449–1453. doi: 10.1039/b708764k. [DOI] [PubMed] [Google Scholar]
- 16.Chou HP, Unger MA, Quake SR. A microfabricated rotary pump. Biomed Microdevices. 2001;3(4):323–330. [Google Scholar]
- 17.Grover WH, Skelley AM, Liu CN, Lagally ET, Mathies RA. Monolithic membrane valves and diaphragm pumps for practical large-scale integration into glass microfluidic devices. Sens Actuators B Chem. 2003;89(3):315–323. [Google Scholar]
- 18.Easley CJ, et al. A fully integrated microfluidic genetic analysis system with sample-in-answer-out capability. Proc Natl Acad Sci USA. 2006;103(51):19272–19277. doi: 10.1073/pnas.0604663103. [DOI] [PMC free article] [PubMed] [Google Scholar]
- 19.Lagally ET, et al. Integrated portable genetic analysis microsystem for pathogen/infectious disease detection. Anal Chem. 2004;76(11):3162–3170. doi: 10.1021/ac035310p. [DOI] [PubMed] [Google Scholar]
- 20.Kim SJ, Yokokawa R, Lesher-Perez SC, Takayama S. Constant flow-driven microfluidic oscillator for different duty cycles. Anal Chem. 2012;84(2):1152–1156. doi: 10.1021/ac202866b. [DOI] [PMC free article] [PubMed] [Google Scholar]
- 21.Kim SJ, Yokokawa R, Takayama S. Microfluidic oscillators with widely tunable periods. Lab Chip. 2013;13(8):1644–1648. doi: 10.1039/c3lc41415a. [DOI] [PMC free article] [PubMed] [Google Scholar]
- 22.Ward SA, Halstead RH. Computation Structures. Cambridge, MA: MIT Press; 1990. p. 812. [Google Scholar]
- 23.Groisman A, Enzelberger M, Quake SR. Microfluidic memory and control devices. Science. 2003;300(5621):955–958. doi: 10.1126/science.1083694. [DOI] [PubMed] [Google Scholar]
- 24.Vestad T, Marr DWM, Munakata T. Flow resistance for microfluidic logic operations. Appl Phys Lett. 2004;84(25):5074–5075. [Google Scholar]
- 25.Bhushan M, Gattiker A, Ketchen MB, Das KK. Ring oscillators for CMOS process tuning and variability control. IEEE T Semiconduct M. 2006;19(1):10–18. [Google Scholar]
- 26.Mosadegh B, et al. Integrated elastomeric components for autonomous regulation of sequential and oscillatory flow switching in microfluidic devices. Nat Phys. 2010;6(6):433–437. doi: 10.1038/nphys1637. [DOI] [PMC free article] [PubMed] [Google Scholar]
- 27.Eddington DT, Puccinelli JP, Beebe DJ. Thermal aging and reduced hydrophobic recovery of polydimethylsiloxane. Sens Actuators B Chem. 2006;114(1):170–172. [Google Scholar]
- 28. Stockton AM, Mora MF, Cable ML, Willis PA (2013) Design rules and operational optimization for rapid, contamination-free microfluidic transfer using monolithic membrane valves. Sens Actuators B Chem 177(1):668–675.
- 29.Nguyen TV, Duncan PN, Ahrar S, Hui EE. Semi-autonomous liquid handling via on-chip pneumatic digital logic. Lab Chip. 2012;12(20):3991–3994. doi: 10.1039/c2lc40466d. [DOI] [PubMed] [Google Scholar]
Associated Data
This section collects any data citations, data availability statements, or supplementary materials included in this article.