

Abstract
Phenotyping of tumor cells by marker-free quantification is important for cancer diagnostics. For the first time, fractal analysis of reflection interference contrast microscopy images of single living cells was employed as a new method to distinguish between different nanoscopic membrane features of tumor cells. Since tumor progression correlates with a higher degree of chaos within the cell, it can be quantified mathematically by fractality. Our results show a high accuracy in identifying malignant cells with a failure chance of 3%, which is far better than today’s applied methods.
Keywords: Marker-free, phenotyping, tumor cells, cell adhesion, fractal analysis, RICM
The determination of tumor cancer cells and their metastatic potential is a crucial step for successful oncological treatment. To date, standard practice for assigning the likely primary site of origin and the grade of differentiation requires the extraction of biopsy samples followed by immunohistochemical staining using specific antibodies and biomarkers.1 However, the expression of such indicative tumor markers can often be misleading and unreliable or unsuccessful due to high dedifferentiation.2−4 Employing a combination of several markers can be helpful in increasing accuracy when determining the tumor grade, but this also makes cell identification more time-consuming and costly. Therefore, there is a great demand in developing label-free and easy to use in vitro detection methods that allow automatic sampling and image analysis of different cell phenotypes.
Label-free cell type characterization techniques comprise the investigation of diverse physical properties such as elasticity, density, and dielectricity.5−13 Especially the mechanical properties of cancer cells vary significantly from that of healthy cells. Therefore, the mechanical properties of individual cells have been proposed as a marker-free parameter which indicates differentiation of healthy cells toward malign cells.6−8 Cell adhesion properties in particular are of great interest for cancer diagnostics because they can reflect the progressive state of cell–matrix and cell–cell loosening during malignant tumor cell transformation in epithelial-derived tumor cells.14,15 The loss of cell adhesion and functional cell polarity are often prerequisites for the invasive and metastatic potential of tumor cells.16 In most cases malignant transformation encompasses the epithelial–mesenchymal transition, and cells downregulate adhesion supporting proteins in exchange for the increased expression of proteins that aid cancer cell migration.17,18 Especially the downregulation of E-Cadherin expression is linked to an increased invasiveness and metastatic potential of tumor cells.19,20 The migratory capabilities of cells determined using in vitro migration assays at interfaces also increase with enhanced E-Cadherin expression.21
Furthermore, the up-regulation of migration-inducing proteins correlates with a higher tumor cell metastasis potential.22 The actin-cross-linking protein fascin functions as a metastasis marker in different tumor cell types, especially in filopodia structures.23−25 In a recent study it was further demonstrated that the up-regulation of the migration inducing protein fascin in breast cancer cells also correlates with the up-regulation of other metastasis inducing proteins and enzymes such as NF-kappa B activity, urokinase-type plasminogen activator, and the matrix metalloproteases MMP-2 and MMP-9. Thus, the formation of filopodia extensions can serve as a prognostic indicator of poor cancer outcome.26,27
Subtle alterations in the adhesion pattern and fine cell-outlining structures of single tumor cells, as they occur during cancer progression, cannot be visualized by standard light microscopy. Instead reflection interference contrast microscopy (RICM) is the method of choice.28 This technique has the ability to measure intersurface distances between a cell and a flat substrate in aqueous conditions with nanometer precision down to ∼5 nm, thus creating an adhesion topology image.29 Furthermore, small cell protrusions like filopodia, which would remain invisible in brightfield microscopy, can be visualized (Figure 1a). RICM has proven to be very useful in imaging adhesion zones in real-time, hence making it possible to derive valuable characteristics concerning the nature of adhesion.30,31 Since image formation merely relies on the reflection of light at the different interphases (Figure 1b), prior fluorophore labeling of cells—as would be needed for TIRF microscopy—is unnecessary. RICM, in contrast, provides an excellent marker-free characterization technology for cell adhesion associated characteristics and cell contours compared to marker-dependent fluorescence microscopy or electron microscopy techniques.
Figure 1.
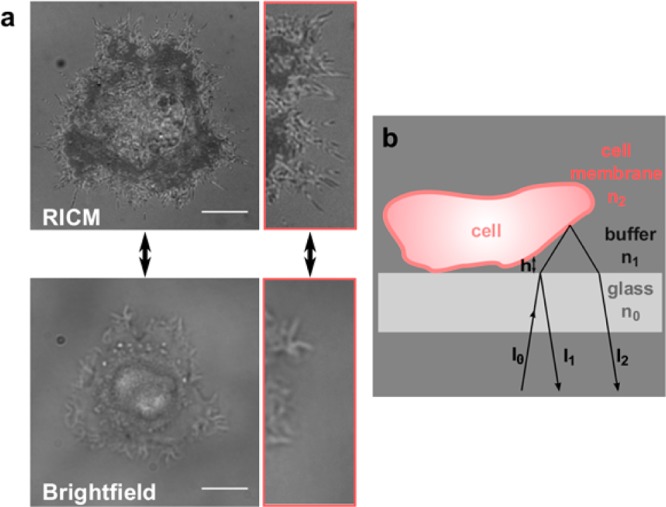
(a) RICM image (top) and bright-field image (bottom) of a cell. The different gray levels in the adhesion topology image correlate with the amount of distance between the cell membrane and the glass interface (dark area = close contact area). In addition, small cell filopodia that are invisible in bright-field images can be visualized with RICM. Scale bar: 10 μm. (b) Scheme of RICM image formation at the cell surface interface. I1 and I2 are the intensities of the light reflected on the glass–buffer and the buffer–cell interface. The interference between these rays is measured.
To analyze and quantify differences in cell adhesion patterns and contours of tumor cells, we performed fractal analysis on single cell RICM images. Fractals are geometric patterns with geometrical and topographical features that are repeated in miniature on smaller and smaller length scales. Such repetition independent of size or refinement level is called “self-similarity”. The fractal dimension measures the rate of addition of structural detail with increasing magnification serving as a quantifier of complexity.32 Fractals are usually triggered by conditions that are far from equilibrium states and are therefore associated with chaos. There is currently a high interest in the application of fractal geometry in the field of biology, because living cells can be seen as complex adaptive systems that show nonlinear dynamics and fractal behavior on different length scales. Applied to the problem of identifying cancerous cells based on cell surface changes, this means that a cell’s surface may appear smooth under a bright field microscope, but zooming in close enough by using RICM will reveal a jagged surface. Fractal dimension changes correlate with changes in the cell phenotype under physiological and pathological conditions.33,34 One general, outstanding feature of tumors is their irregular and complex shape, which explains why fractal analysis plays a pivotal role especially in oncology.35 The occurrence of misbalanced processes during cancer progression is reflected in an increased fractal dimension of the cell’s surface, as has been described for histological tissue samples that were analyzed for tumor cell shape on the macroscale.36 On the subcellular microscale, cancer-specific fractal behavior of tumors was discovered during morphometric analysis of nuclear parameters (area, perimeter) in pathological samples.34,37 Thus, developing cell algorithms for differentiating cancerous cells from normal cells based on their different intrinsic cellular properties, as reported in this study, is of great significance for diagnosis.
In this study, we analyzed the fractal dimensionality of two cancer cell lines PaTu8988S (PatuS) and PaTu8988T (PatuT) by quantifying their respective RICM images. We used three different approaches for fractal analysis including two completely independent aspects to investigate fractal dimensionality by applying the box-counting method. The first aspect we analyzed was the cell’s contour on the microscale, the second one the adhesion topology on the nanoscale (which can be deduced from the different gray values in the RICM images).
The cancer cell lines used in this study were derived from the same metastasis of a pancreas adenocarcinoma but differ in their grade of differentiation and metastatic potential.38 We explored whether changes in the adhesion behavior and cell appearance (monitored by RICM) coincide with the grade of differentiation. Employing cells of the same origin rather than using multiple cell lines originating from multiple different genetic backgrounds offers significant advantages for data interpretation. In contrast to PatuS cells, PatuT cells do not express E-Cadherin receptors and therefore represent the more malignant and dedifferentiated cell line. In vitro and in vivo migration assays have illustrated the more invasive and metastatic behavior of the PatuT cell line.21
To the best of our knowledge, the present study is the first report of fractal analysis applied to single cell RICM images. We were able to distinguish between malignant and benign tumor cells and assign a grade of tumor malignancy solely based of fractal dimension analysis, without using any markers. Our new diagnostic method could have direct applications in pathology: it provides a fast indicator of a patient’s clinical prognosis, which can be critical in determining the type and composition of suitable cancer therapy.
Our analysis of the fractal dimension (FD) of RICM images of human pancreas tumor cells revealed information on cell contour and adhesion topology. We investigated whether two almost identical sister cell lines (PaTuT and PaTuS) can be distinguished in the fractal pattern of their cell surfaces and whether this provides information on the grade of malignancy. More specifically, we investigated three different approaches and used two independent aspects to calculate fractal dimensionality by using the box-counting method, namely, (i) cell contour, (ii) adhesion topology, and (iii) the combination of contour and adhesion topology. In the following these three aspects are referred to as FD contour, FD topology, and FD combined. It is important to note that measures of contour and topology are completely independent from each other.
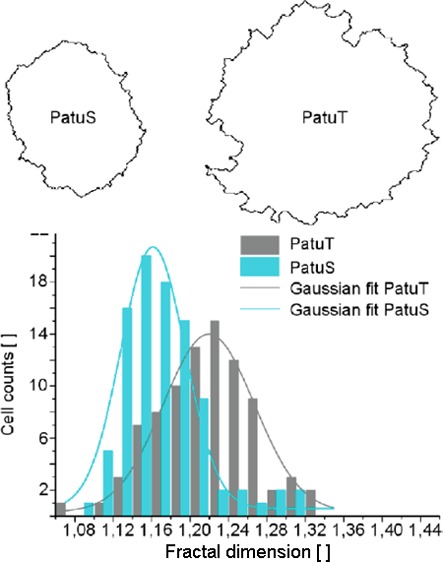
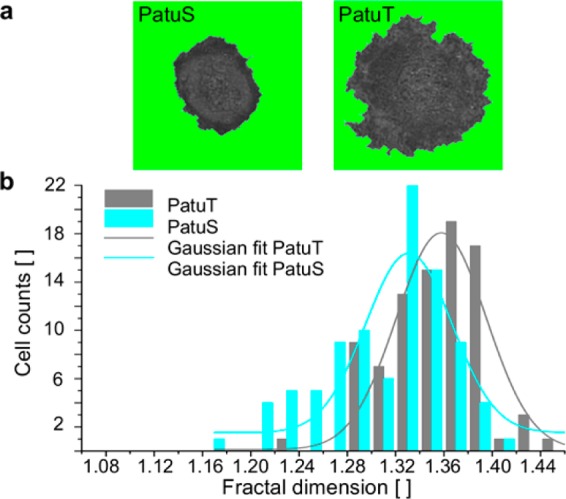
The first approach describes the FD analysis of the cell contour. Prior to fractal analysis we applied a self-written cell segmentation algorithm to the RICM images (Figure 2). The contour of PatuT cells showed a significant (p < 0.001) higher fractal dimension (FDPatuT = 1.218 ± 0.005) than the PatuS cells (FDPatuS = 1.171 ± 0.004). Values of both cell lines showed a Gaussian distribution. To prove that the reported differences in fractal dimension originate from differences in tumor grading between the two cell lines—and not because adhering PatuT cells are approximately 30% larger than PatuS cells—we investigated the FD independent of the cell perimeter. The presented scatter plot (Figure S1) shows no linear correlation, thereby affirming that the higher FD of PatuT cells is not an effect of the larger size of PatuT cells but rather deeply rooted in the unequal intrinsic cellular properties caused by the different tumor grade of the two cell lines.
Figure 2.
(a) Boundary images of two representative PatuS and PatuT cells. In b, the histograms of the fractal dimension for both cell lines are shown. The data could be fitted with a Gaussian curve. The FD of PatuT cells is significantly (p < 0.001) higher than the FD of PatuS cells (NPatuT = 86, NPatuS = 93 cells).
In a second step, we considered the fractal dimensionality of only the adhesion topology (given by the intensity distribution of the RICM image) without considering the cell contour (Figure 3). For this purpose, the FD of adhesion areas within the cell boundary were analyzed in box sizes of 80 × 80 pixels (see Figure 3b right). Using this procedure we can exclude contour effects from the fractal dimensionality calculation. For larger PatuT cells up to three adhesion area boxes were analyzed, whereas for smaller PaTuS cells we only analyzed one or two area boxes. The first box was always placed at the cell periphery, and subsequent boxes were placed next to it, if the entire cell area was large enough. Results revealed that the adhesion topology of the more malignant PatuT cells showed a significantly higher fractal dimensionality than the PatuS cells (FDPatuT = 1.297 ± 0.002; FDPatuS = 1.286 ± 0.002), comparable to the results of the FD analysis of the cell contour.
Figure 3.
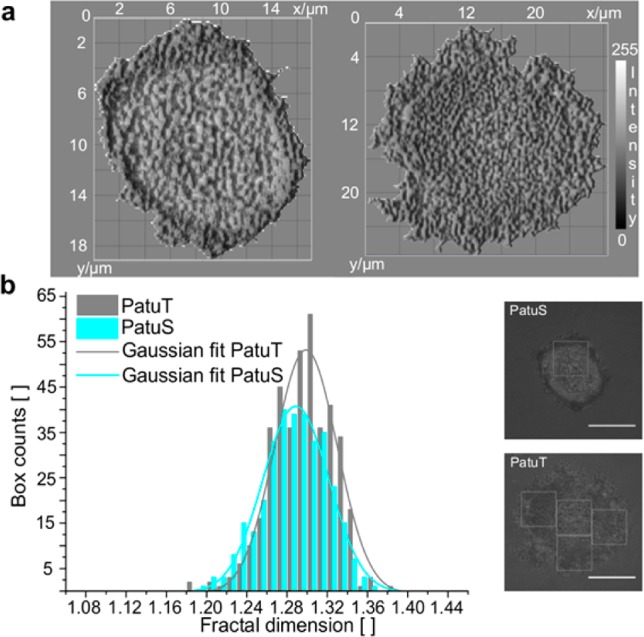
In a, the topology of the cells (left: PatuS, right: PatuT) is visualized in a 3D surface plot (topological adhesion map). Please note the different scale bars for the two cells due to their different size. The different grayscale intensities are a relative measure of the distance between the cell membrane and the substrate from close (dark) to distant. (b) Histograms of the fractal dimension for both cell lines. The data could be fitted with a Gaussian curve. The FD of PatuT is significantly (p < 0.001) higher than the FD of PatuS (NPatuT = 405, NPatuS = 331 boxes). On the right RICM images of two representative PatuS and PatuT cells are shown. The FD of the adhesion topology within the white boxes was analyzed. Scale bar: 10 μm.
In the third approach we combined the aspects cell contour and adhesion topology to increase the significance level in cell line comparisons. Here, the entire adhesion topology area of the cell—not only adhesion area boxes—was taken into account for analysis. Within this combined approach the undesirable gray part of the RICM image outside the cell boundary was removed and replaced by a fixed black background (Figure 4a, for visualization purposes a green background is shown). This analysis also resulted in a significantly (p < 0.001) higher fractal dimension for PatuT (FDPatuT = 1.353 ± 0.004) than for PatuS cells (FDPatuS = 1.312 ± 0.005). In addition, we tested the FD in dependence of the image size (Figure S2). Although a tendency toward higher FD with increasing image size is only vaguely recognizable, it is worth saying that for all investigated image sizes the FD values for the PatuT cells were higher than those of the PatuS cells. This proves that the reported differences stem from cellular physical irregularities (contour and adhesion topology) at the micro- and nanometer level.
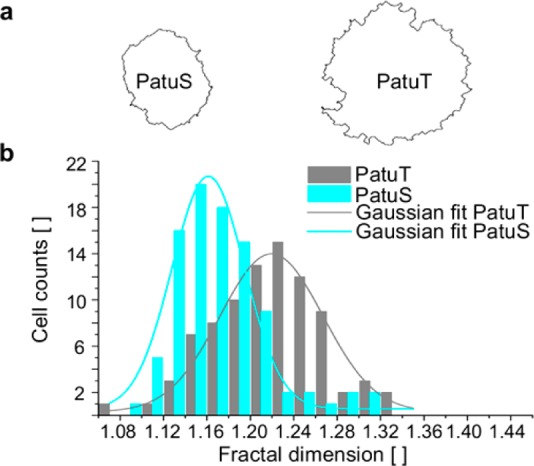
Figure 4.
(a) RICM images of two representative PatuS and PatuT cells. For the FD calculation the image of the whole cell area is used. (b) Histograms of the fractal dimension for both cell lines. The data could be fitted with a Gaussian curve. The FD of PatuT cells is significantly (p < 0.001) higher than that of PatuS cells (NPatuT = 86, NPatuS = 93 cells).
To assess and compare the performance of the three different FD analyses for the classification of PatuT and PatuS cells we performed receiver operating characteristics (ROC) analysis. ROC analysis provides a comprehensive description of diagnostic accuracy, because it estimates and reports all of the combinations of sensitivity and specificity that a diagnostic test is able to provide.39 It is created by plotting the true positive rate (tp rate), characterized by the fraction of true positives out of the positives, versus the false positive rate (fp rate) at various threshold settings for the FD (Figure 5B). In our case a positive hit identifies a malignant PatuT cell and a negative hit a PatuS cell. Therefore, the tp rate represents the case that a PatuT cell is correctly classified as PatuT, which is also the measure for the sensitivity of the analysis. Because in clinical diagnosis it is important to recognize tumor cells with high accuracy, the fn rate misclassifying a malignant PatuT as a benign PatuS must be as low as possible. The true negative rate (tn rate), on the other hand, represents the rate that a PatuS cell is correctly classified as PatuS, whereas a PatuS cell misclassified as PatuT accounts for a false positive rate (fp rate).
Figure 5.
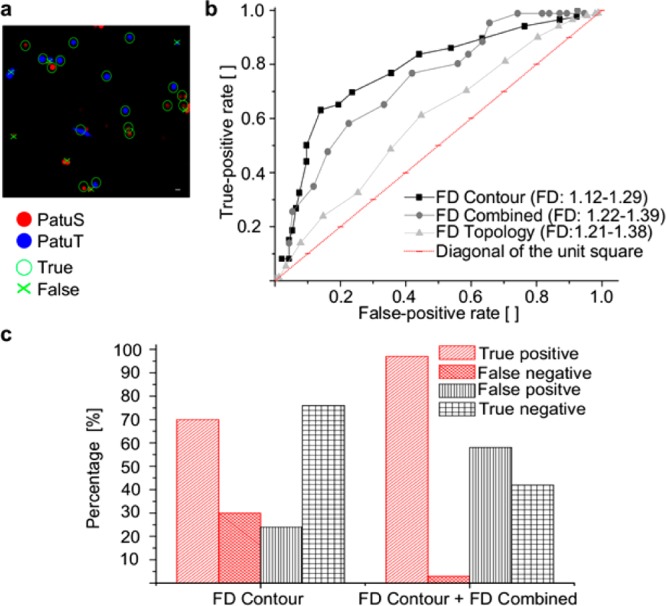
In a, PatuT and PatuS cells were fluorescently labeled and mixed prior to identification. The given example shows the true and false hits of the classification. Scale bar: 20 μm. (b) ROC curves indicate the classification performance of different FDs obtained by analyzing the cell contour, the topology, or the combined aspects. (c) A second analysis followed which compared all of the PatuS cells previously identified based on the FD contour parameter (threshold FD = 1.19) with a second parameter, FD combined (threshold FD = 1.33). This strategy reduced the percentage of false negatives from 30 to 3% (NPatuT = 86, NPatuS = 93 cells).
To test the ability to correctly allocate analyzed cells, PatuS and PatuT cells were labeled with two different dyes and then mixed to equal amounts prior to RICM analysis (Figure 5A). We performed receiver operational characteristics to prove diagnostic accuracies that can be analyzed in terms of total area under curve (AUC) within the unit square of the ROC curves. The resulting AUC values revealed that FD contour (AUC = 0.78) is a better classification parameter than FD combined (AUC = 0.74) or FD topology (AUC = 0.72).
For clinical diagnosis a low fn rate is important because it is critical to avoid accidental misclassification of malignant cells as healthy cells. To achieve this we performed a two-step analysis to determine the best fitting thresholds from ROC curves (Figure 5b). First, we classified cells according to the best FD contour threshold parameter (FDthresh = 1.19). This led to PatuT cell classifications that were wrong (fn rate) in 30% and correct (tp rate) in 70% of cases. In a second step, we analyzed all cells classified as PatuS cells again (because they could be misclassified PatuT cells) using FD combined (FDthresh = 1.33) as the second threshold parameter. We thereby reduced the fn rate such that in the end only 3% of PatuT cells were not classified as PatuT, whereas 97% of PatuT cells were classified correctly (Figure 5c). It is also worth mentioning that with this method of analysis the choice of the threshold parameter dependent on the targeted priority will determine the readout. Another example, assigning the priority on the PatuS cells with the analysis of the rate for identifying a benign cell as malign, is shown in Figure S3 of the Supporting Information.
RICM imaging is a powerful and well-established tool for cell adhesion analyses as it provides noninvasive, label-free, and real-time observation of living cells. Here, we set the advantages of the RICM technique—such as providing information concerning the cell contour and adhesion topology of the cell—in a new application context, namely, cancer cell diagnosis, by analyzing the fractal dimension of single cells in RICM images.
To date, cancer-specific fractal behavior of tumors has been investigated either at the macroscale—by analyzing, for example, tumor perimeters in mammograms and histological samples—or at the subcellular microscale by analyzing nuclear morphometry.34,37,40 In those cases, only the fractal behavior of a single aspect, the contour, can be analyzed. In our study, we also applied fractal analysis on adhesion topology maps from easily and quickly accessible RICM images. At the same time we analyzed two independent aspects (the cell contour on the microscale and the adhesion topology on the nanoscale) and also analyzed them in combination so as to increase the predictive significance of the analysis. To prove the feasibility of our highly sensitive analysis method we compared tumor cell lines derived from the same pancreatic adenocarcinoma differing in their malignant grade, which is much more challenging than simply comparing healthy and cancerous cell lines. In all analytical approaches the more malignant PatuT cells showed a higher fractal dimension (FD) than the benign PatuS cells. The contour aspect provided the highest significance. These findings of increased contour roughness underline the outstanding role of filopodia formation for invasive tumor migration, which has previously been reported for several tumor cell lines.26,27,41 Since the only major difference between the two sister cell lines is the presence of E-Cadherin expression, it seems likely that a direct link between E-Cadherin levels and filopodia-inducing protein levels exists. As expected, a correlation between high levels of fascin, a filopodia-inducing protein, and low E-Cadherin expression has been described.42 Differences in the FD of the adhesion topology were also significant between the two sister cell lines, but to a lesser degree than the contour aspect. So far we can only speculate about how reduced E-Cadherin expression can lead to the spatial reorganization of adhesion patches by affecting the clustering of collagen-binding integrins and cell adhesion. Dokukin et al. also reported a difference in the FD of cell adhesion maps between two cell types.32 They used atomic force microscopy (AFM) to show that the FD of the distribution of adhesive properties measured over the 2D-surface greatly differs between healthy and cancerous epithelial cells.32 Compared to the RICM method described here, AFM is cell-invasive as well as time-consuming and requires highly trained personnel to handle the complicated experiment setup.
Finally, we want to emphasize the great potential of fractal geometry analysis for clinical diagnostics, especially in combination with easy-to-access RICM image analysis. So far all other approaches for investigating different fractal behavior of tumor systems required fixation protocols, which are tedious and reduce the sensitivity, because the inherent structure of the systems will be changed according to the fixation characteristics. Additionally, our fractal analysis method enables the potential to evaluate cell adhesion dynamics which will further refine the outcome results.
In consideration of possible applications in the clinical setting, we applied receiver operational characteristics (ROC) to display our system’s accuracy in identifying malignant tumor cells. Using our classification parameter FD contour the ROC curve describes a diagnostic accuracy of 78%. Most importantly, regarding the sensitivity of our classification system we were able to achieve a better diagnosis result than commonly used tumor markers. In a first step, a fractal analysis of the cell contour with a FDcontour threshold of 1.19 was performed. In this step 70% of PatuT cells were correctly identified as PatuT. In the following second fractal analysis—based on the combined approach, including all PatuS assigned cells from the first analysis, and using an FD combined threshold of FDcombined = 1.33—the percentage of PatuT cells that were identified as PatuT cells was increased up to 97%. Thus, only 3% of malignant cells (PatuT) were not identified. Compared to the best tumor marker for pancreatic adenocarcinoma CA19-9, which used by itself has a sensitivity of 50–70% and applied in combination with two other tumor markers can reach a sensitivity of 85%, fractal analysis provides superior results.43,44
We showed that RICM imaging is a very easy and low-cost microscopy technique that can deliver marker-free multiple adhesion related parameters. After processing by advanced image analysis, these data can be used to categorize tumor cells with pathology grading systems. Furthermore, the sum of the different applied pattern recognition algorithms on single cell images results in an unique fingerprint of the cell. In the long run, an adhesion based FD library of multiple tumor cells could be generated for comparing individual cell parameters. Our goal is to establish a computer-aided-diagnostics (CAD) system for biopsy samples, comparable to the ones used to retrieve structures identified as conspicuous in MRI or X-ray scans, to help expedite the accuracy and efficiency of cancer screening programs.
Acknowledgments
We thank Prof. Dr. Jürgen Schnekenburger (Gastroenterological Molecular Cell Biology, Department of Medicine B, University of Muenster) for providing the two cell lines. We thank Timo Maier and Dr. Tamás Haraszti for the hardware & software installation of the RICM-Setup. Dr. Frank Narz (Qiagen) contributed with many fruitful discussions. We additionally thank Nina Grunze and Elisabeth Pfeilmeier for proofreading the manuscript. The work was part of the BMBF initiative under grant agreement Cell@Nano, funding number 0312030B. Part of the research leading to these results received funding from the European Union Seventh Framework Programme (FP7/2007-2013) under grant agreement no. NMP4-LA-2009-229289 NanoII and no. NMP3-SL-2009-229294 NanoCARD. J.P.S. is the Weston Visiting Professor at the Weizmann Institute of Science. The group is part of the excellence cluster CellNetworks at the University of Heidelberg. The support of the Max Planck Society is highly acknowledged.
Supporting Information Available
Additional figures and information on materials and methods, including cell culture, substrate coating, reflection interference contrast microscopy (RICM), data analysis of RICM images, modeling, and mathematical test. This material is available free of charge via the Internet at http://pubs.acs.org.
The authors declare no competing financial interest.
Supplementary Material
References
- Lostumbo A.; Mehta D.; Setty S.; Nunez R. Exp. Mol. Pathol. 2006, 80146–53. [DOI] [PubMed] [Google Scholar]
- Herr J. K.; Smith J. E.; Medley C. D.; Shangguan D. H.; Tan W. H. Anal. Chem. 2006, 7892918–2924. [DOI] [PubMed] [Google Scholar]
- Kim J.-H.; Kim J.-S.; Choi H.; Lee S.-M.; Jun B.-H.; Yu K.-N.; Kuk E.; Kim Y.-K.; Jeong D. H.; Cho M.-H.; Lee Y.-S. Anal. Chem. 2006, 78196967–6973. [DOI] [PubMed] [Google Scholar]
- Scholler N.; Fu N.; Yang Y.; Ye Z.; Goodman G. E.; Hellstrom K. E.; Hellstrom I. Proc. Natl. Acad. Sci. U.S.A. 1999, 962011531–6. [DOI] [PMC free article] [PubMed] [Google Scholar]
- Spatz J. P.; Roescher A.; Sheiko S.; Krausch G.; Moller M. Adv. Mater. 1995, 78731–735. [Google Scholar]
- Guck J.; Ananthakrishnan R.; Cunningham C. C.; Kas J. J. Phys.: Condens. Matter 2002, 14194843–4856. [Google Scholar]
- Jonas O.; Mierke C.; Käs J. Soft Matter 2011, 72411488–11495. [Google Scholar]
- Rolli C.; Seufferlein T.; Kemkemer R.; Spatz J. P. PloS One 2010, 51e8726. [DOI] [PMC free article] [PubMed] [Google Scholar]
- Walter N.; Micoulet A.; Seufferlein T.; Spatz J. P. Biointerphases 2011, 63117–125. [DOI] [PubMed] [Google Scholar]
- Fuhrmann A.; Staunton J. R.; Nandakumar V.; Banyai N.; Davies P. C. W.; Ros R. Phys. Biol. 2011, 81015007. [DOI] [PMC free article] [PubMed] [Google Scholar]
- Ito Y.; Shinomiya K. J. Clin. Apheresis 2001, 164186–191. [DOI] [PubMed] [Google Scholar]
- Huang Y.; Joo S.; Duhon M.; Heller M.; Wallace B.; Xu X. Anal. Chem. 2002, 74143362–3371. [DOI] [PubMed] [Google Scholar]
- Das C. M.; Becker F.; Vernon S.; Noshari J.; Joyce C.; Gascoyne P. R. C. Anal. Chem. 2005, 7792708–2719. [DOI] [PMC free article] [PubMed] [Google Scholar]
- Akiyama S. K.; Olden K.; Yamada K. M. Cancer Metast. Rev. 1995, 143173–189. [DOI] [PubMed] [Google Scholar]
- Du Z.; Colls N.; Cheng K. H.; Vaughn M. W.; Gollahon L. Biosens. Bioelectron. 2006, 21101991–1995. [DOI] [PubMed] [Google Scholar]
- Woodhouse E. C.; Chuaqui R. F.; Liotta L. A. Cancer 1997, 8081529–1537. [DOI] [PubMed] [Google Scholar]
- Ke X. S.; Qu Y.; Goldfinger N.; Rostad K.; Hovland R.; Akslen L. A.; Rotter V.; Oyan A. M.; Kalland K. H. PloS One 2008, 310e3368. [DOI] [PMC free article] [PubMed] [Google Scholar]
- Mani S. A.; Guo W.; Liao M. J.; Eaton E. N.; Ayyanan A.; Zhou A. Y.; Brooks M.; Reinhard F.; Zhang C. C.; Shipitsin M.; Campbell L. L.; Polyak K.; Brisken C.; Yang J.; Weinberg R. A. Cell 2008, 1334704–715. [DOI] [PMC free article] [PubMed] [Google Scholar]
- Behrens J. Cancer Metast. Rev. 1999, 18115–30. [DOI] [PubMed] [Google Scholar]
- Janes S. M.; Watt F. M. Nat. Rev. Cancer 2006, 63175–83. [DOI] [PubMed] [Google Scholar]
- Marques I. J.; Weiss F. U.; Vlecken D. H.; Nitsche C.; Bakkers J.; Lagendijk A. K.; Partecke L. I.; Heidecke C. D.; Lerch M. M.; Bagowski C. P. BMC Cancer 2009, 9, 128. [DOI] [PMC free article] [PubMed] [Google Scholar]
- Arjonen A.; Kaukonen R.; Ivaska J. Cell Adhes. Migr. 2011, 55421–430. [DOI] [PMC free article] [PubMed] [Google Scholar]
- Yamashiro S.; Yamakita Y.; Ono S.; Matsumura F. Mol. Biol. Cell 1998, 95993–1006. [DOI] [PMC free article] [PubMed] [Google Scholar]
- Hashimoto Y.; Skacel M.; Adams J. C. Int. J. Biochem. Cell B 2005, 3791787–1804. [DOI] [PubMed] [Google Scholar]
- Xing P.; Li J. G.; Jin F.; Zhao T. T.; Liu Q.; Dong H. T.; Wei X. L. Cell Biochem. Funct. 2011, 294303–310. [DOI] [PubMed] [Google Scholar]
- Kress A. K.; Kalmer M.; Rowan A. G.; Grassmann R.; Fleckenstein B. Blood 2011, 117133609–3612. [DOI] [PubMed] [Google Scholar]
- Al-Alwan M.; Olabi S.; Ghebeh H.; Barhoush E.; Tulbah A.; Al-Tweigeri T.; Ajarim D.; Adra C. PloS One 2011, 611e27339. [DOI] [PMC free article] [PubMed] [Google Scholar]
- Verschueren H. J. Cell Sci. 1985, 75, 279–301. [DOI] [PubMed] [Google Scholar]
- Hategan A.; Sengupta K.; Kahn S.; Sackmann E.; Discher D. E. Biophys. J. 2004, 8753547–3560. [DOI] [PMC free article] [PubMed] [Google Scholar]
- Curtis A. S. G. J. Cell Biol. 1964, 202199. [DOI] [PMC free article] [PubMed] [Google Scholar]
- Sengupta K.; Aranda-Espinoza H.; Smith L.; Janmey P.; Hammer D. Biophys. J. 2006, 91124638–4648. [DOI] [PMC free article] [PubMed] [Google Scholar]
- Dokukin M. E.; Guz N. V.; Gaikwad R. M.; Woodworth C. D.; Sokolov I. Phys. Rev. Lett. 2011, 1072028101. [DOI] [PMC free article] [PubMed] [Google Scholar]
- Lebedev D. V.; Filatov M. V.; Kuklin A. I.; Islamov A. K.; Kentzinger E.; Pantina R.; Toperverg B. P.; Isaev-Ivanov V. V. FEBS Lett. 2005, 57961465–1468. [DOI] [PubMed] [Google Scholar]
- Mashiah A.; Wolach O.; Sandbank J.; Uziel O.; Raanani P.; Lahav M. Acta Haematol.-Basel 2008, 1193142–150. [DOI] [PubMed] [Google Scholar]
- Dinicola S.; D’Anselmi F.; Pasqualato A.; Proietti S.; Lisi E.; Cucina A.; Bizzarri M. Omics 2011, 15393–104. [DOI] [PubMed] [Google Scholar]
- de Arruda P. F.; Gatti M.; Facio F. N. Jr.; de Arruda J. G.; Moreira R. D.; Murta L. O. Jr.; de Arruda L. F.; de Godoy M. F. BMC Clin. Pathol. 2013, 13, 6. [DOI] [PMC free article] [PubMed] [Google Scholar]
- Vasilescu C.; Giza D. E.; Petrisor P.; Dobrescu R.; Popescu I.; Herlea V. Hepato-Gastroenterol. 2012, 59113284–288. [DOI] [PubMed] [Google Scholar]
- Elsässer H.-P.; Lehr U.; Agricola B.; Kern H. Virchows Arch. B: Cell Pathol. 1992, 611295–306. [DOI] [PubMed] [Google Scholar]
- Metz C. E. J. Am. Coll. Radiol. 2006, 36413–422. [DOI] [PubMed] [Google Scholar]
- Cross S. S. J. Pathol. 1997, 18211–8. [DOI] [PubMed] [Google Scholar]
- Hashimoto Y.; Kim D. J.; Adams J. C. J. Pathol. 2011, 2243289–300. [DOI] [PubMed] [Google Scholar]
- Hayashi Y.; Osanai M.; Lee G. H. Cancer Sci. 2011, 10261228–1235. [DOI] [PMC free article] [PubMed] [Google Scholar]
- Matorras R.; Rodriguezescudero F. J.; Diez J.; Genolla J.; Fombellida J. C.; Ruibal A. Acta Obstet. Gyn. Scand. 1992, 716458–464. [DOI] [PubMed] [Google Scholar]
- Goggins M. Semin. Oncol. 2007, 344303–310. [DOI] [PMC free article] [PubMed] [Google Scholar]
Associated Data
This section collects any data citations, data availability statements, or supplementary materials included in this article.