
Figure 2.
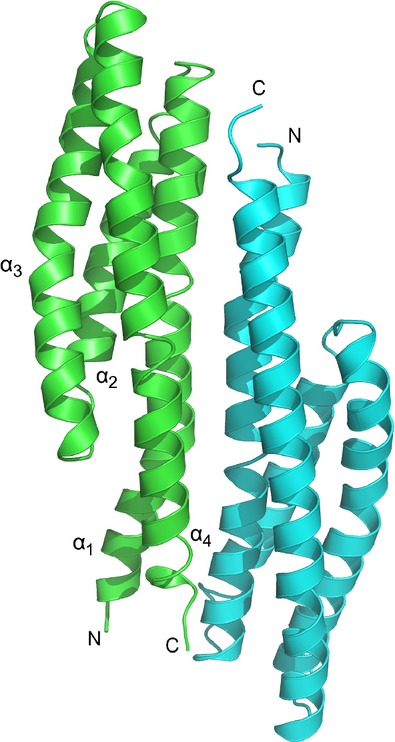
A cartoon representation of the structure of Adeh_2942 sensor domain. A head-to-tail dimer structure is observed in the crystals. The Cα tracing of monomer A is shown in green and that of monomer B is shown in cyan. The helices of monomer A are labeled.