

Abstract
The zinc-finger associated domain (ZAD) family is the largest transcription factor family in dipteran insects. Still, their functional significance is barely recognized in the literature due in part to their resistance to mutagenesis screens in genetic studies. Therefore, we employed in vitro techniques to identify the DNA-binding characteristics of several members of the Drosophila melanogaster ZAD family in an effort to study their target genes. In this comprehensive investigation, we constructed a panel of GST-Zinc finger (ZnF) array chimera from 21 selected ZAD proteins and used them to select binding sites from an oligonucleotide library by employing electrophoretic mobility shift assays (EMSA). Samples of the binding population were sequenced and used to derive DNA-binding consensus sequence for each member. These consensus sequences were tested for complex formation with their respective protein chimera and the specificity of binding ascertained by competition EMSA. Bioinformatics tools were used to identify potential genetic targets. The identified consensus sequences were distinct for each member and the putative genomic targets were clustered in the regulatory regions of specific genes. This appears to be consistent with a conservation of function between members and also suggests that the overlapping functions of ZAD proteins are the result of positive selection to maintain redundancy and not simply artifacts of recent expansion. Putative target genes suggest a major role of the ZAD family members in the regulation of several early developmental genes including homeobox transcription factors.
Keywords: Zinc finger proteins, ZAD family, DNA binding site consensus, Gene ontology clusters, Positive selection, Lineage-specific expansion
1. Introduction
Of all the transcription factors found in higher eukaryotes, zinc finger proteins (ZFP) are the most abundant and best represented in the literature (Fu et al., 2009). ZFPs often utilize tandem arrays of zinc finger (ZnF) domains for DNA binding activity and are separated into families based on their conserved effector domains. The ZFP architecture has proven to be very versatile that it has undergone strong positive selection in most of the higher eukaryotes. The only significant difference seems to be the specific family of zinc finger proteins that has been selected for expansion, which varies from one lineage to another.
Different zinc finger protein families are expanded within different eukaryotic lineages. Prominent examples include the Krüpple Associated Box (KRAB) superfamily in mammals and the ZAD family in dipteran insects. Both of these families display a high degree of lineage specific enrichment and clustering at distinct chromosomal locations (Chung et al., 2007; Hamilton et al., 2003). The positive selection of one or more of these families of versatile transcription factors has occurred independently across the spectrum of eukaryotic lineages. Even at a species-specific level, the number of unique ZnF proteins can be quite high; 55.6%, 43.9%, 76.8%, and 21.5% respectively in Bombyx mori, Drosophila melanogaster, Caenorhabditis elegans, and Homo sapiens (Duan et al., 2008). Each expansion has shown a similarity of formation, with an uneven clustering on the chromosomes as described in L(3)Neo38, Tiptop, BR-C, Fru, Hkb, Ab, Ken, and Sens in nematodes (Duan et al., 2008; Haerty et al., 2008), KRAB, SNAG, and BTB in mammals (Ayyanathan et al., 2003; Collins et al., 2001; Huntley et al., 2006), and ZAD in dipteran insects (Chung et al., 2002, 2007), coinciding evolutionarily with the potential development of novel adaptive structures and phenotypes.
D. melanogaster dedicates nearly 1% of its genome to creating ZAD transcription factor family with 97 members. This represents about 10% of its transcription factors (Benson et al., 2009). ZAD transcription factors are heavily expressed during the critical, early embryonic development period when compared to other families of transcription factors (Adryan and Teichmann, 2006, 2010; Pfreundt et al., 2010). However, very little information is available regarding their transcriptional regulatory activity, genetic targets or mutant phenotypes. This lack of knowledge about ZAD family members is in part due to their resistance to the commonly utilized mutagenesis screens.
Only a single ZAD appears to be present at the time of divergence between crustaceans and holometabolous insects. Since then the ZAD family has grown to contain many members in each species; 29 within Apis mellifera, 75 within Tribolium castaneum, 86 within B. mori, 97 within D. melanogaster, and 147 within Anopheles gambiae. The lineage-specific enrichment seen in ZAD-ZFPs supports a model of very recent expansion occurring within the family. This relatively recent expansion of ZAD proteins may have resulted in the conservation of function across the family. These overlapping functions would also explain the difficulty in elucidating their phenotypes. This expansion in ZAD proteins may be associated with the development of adaptive structures, specifically the meroistic ovary, which shares a close phylogenetic correlation to ZAD expression (Chung et al., 2002, 2007).
If this theory were correct, one would anticipate that those few ZAD proteins with a severe and notable phenotype are the exceptions that have acquired a necessary but not merely an adaptive function. This is in part supported by the fact that only three of the nine ZAD proteins with necessary functions in Drosophila are conserved between closely related dipterans (Chung et al., 2007). Identifying a cohort of ZADs with similar functions and knocking out their expressions in tandem should reveal their unknown functions. Given their early developmental and neural expression patterns, those previously masked phenotypes may offer excellent model systems for neuronal development research areas.
In this comprehensive study, we set out to use a systematic in vitro approach to examine the ZAD transcription factor system and investigate the current theory as to why this system is so resistant to mutagenesis screens and what genes are under its control. Generally, the DNA binding domains are modular in nature, separable, and can position the protein at the DNA binding site even in the absence of their normally associated effector domains (Brent and Ptashne, 1985; Liu et al., 2001). Therefore, we created affinity tagged constructs of the DNA binding domains from a selection of 21 ZAD family members for use in DNA binding site selection assays. The members studied were selected from a database of information compiled on all of the D. melanogaster ZAD proteins (unpublished data—Anderson, Krystel and Ayyanathan). The criteria for selection included similarity of architecture, predicted protein solubility, and the availability of knockout or knockdown lines. The first two criteria were intended to provide the best opportunity to characterize members with overlapping function, the third criteria was to maximize protein expression efficiency, and the fourth criteria was to improve options for future in vivo studies. In this paper, we are reporting data on binding site consensus sequences, target gene profiles and their analysis for the following ZAD proteins, CG17958 (Serendipity δ), CG7938 (Serendipity β), CG34406, CG30020, CG10366, CG1792, CG7928, CG10267 (Zif), CG14711, CG4820, CG12391, CG8145, CG4730, CG30431, CG10321, CG15436, CG10309 (poils au dos), CG12219, CG2711 (deformed wings), CG7357, and CG14710.
2. Materials and methods
2.1. Reagents
All biochemical reagents were purchased from Sigma (St. Louis, MO). Full-length transcription factor encoding cDNA clones for CG12219, CG30020, CG7938, and CG17958 were purchased from Open BioSystems, Inc. (Huntsville, AL). Dr. Theodore Haerry kindly provided the following Drosophila embryonic cDNA libraries (0–4 h, 4–8 h, 0–8 h, and 0–12 h). Glutathione-S-transferase (GST) system was procured from GE Healthcare Life Sciences (Pittsburgh, PA). Molecular biology reagents such as restriction enzymes, DNA ligases, and T4 polynucleotide kinase were purchased from New England Biolabs (Ipswich, MA).
2.2. Expression constructs
Recombinant plasmid constructs expressing the ZnF domains of each ZAD family member mentioned above were built using PCR amplified products from either Drosophila embryonic cDNA libraries or cDNA clones. For each ZAD member, ZnF domains selected and information about GST-ZnF recombinant constructs are discussed in Section 3.2. ZnF domains for the first five ZAD members were amplified from clones purchased from Open BioSystems Inc. ZnF domains for the remaining ZAD members were PCR amplified from any of the Drosophila cDNA library mentioned above. Each product was purified on agarose gels, sequentially digested with indicated restriction endonucleases, and then directionally ligated into a similarly digested pGEX 4T-2 or pGEX 4T-1 plasmid vector. The vector used for each ligation ensured fusion of the DNA binding domain in frame with the GST affinity tag contributed by the pGEX family of plasmids. Ligated GST-ZnF fusion vectors were transitioned through the E. coli DH5α into E. coli BL21 cells for protein expression. Multiple independent clones of each construct were tested for protein expression. The integrity of the insert sequences in the recombinant clones was also confirmed by DNA sequencing.
2.3. Recombinant protein expression and purification
E. coli BL21 cells transformed with GST-ZnF recombinant plasmids were cultured in Luria Broth containing ampicillin (100 μg/ml) and kanamycin (25 μg/ml) and tested for protein production via IPTG (1 mM) induction at 37 °C for 2 h. A pGEX-4T2 plasmid transformed E. coli BL21 culture was induced with IPTG and used as a GST-only control. Subsequent to confirmation of correct size protein expression, two expression clones were selected from each GST-ZnF construct for maxi-protein production by inducing a 500 ml culture with 0.1 mM IPTG at 30 °C overnight. Expressed proteins were released from the cells by lysozyme treatment in the presence of proteinase inhibitors followed by sonic disruption at 4 °C (30 s pulse using energized probe and 60 s of resting in an ice bath). The viscosity of the samples determined the total number of cycles (4 to 6) used for sonication. The lysates were spun in an ultracentrifuge at 50,000 g for 30 min. The soluble fractions of each cell lysate, predicted to represent the functional form of protein, were then bound on a GSH-Sepharose column. The columns were washed in 1× PBS and the proteins eluted in a 100 mM Tris–Cl buffer containing 15 mM reduced glutathione. Finally the elution fractions were pooled, dialyzed in 1× PBS buffer containing 10% glycerol to concentrate the protein and to remove the reduced glutathione. Samples of each purified protein were run on 12% SDS page gels and visualized by coomassie staining to check integrity, purity and solubility (Chiang and Ayyanathan, 2012; Krystel and Ayyanathan, 2012).
2.4. Initial DNA binding site selection
Initial binding site selection experiments were conducted for four ZAD members. GST-ZnF fusion proteins, for CG7938, CG12219, CG17958 and CG30020, were combined with a 49-mer library 5′-agacGGATCCattgcaNNNNNNNNNNNNNNNNNNctgtccGAATTCgga-3′ as described (Peng et al., 2002). GST was included as a control. Each member in the oligonucleotide library contained a random 18-N central region that was flanked by known primer targets with embedded BamHI and EcoRI restriction sites (underlined). The oligonucleotide library was annealed into a double stranded form and end labeled with γ-32P ATP before binding. The protein–DNA binding was conducted in Nuclear Extract Binding Buffer (20 mM HEPES, 75 mM NaCl, 0.5 mM DTT, 10% glycerol, 0.5 mM MgCl2, and 50 μM ZnSO4) (NEBB) and ran on a non-denaturing 5% poly-acrylamide gel for electrophoretic mobility shift assay (EMSA) (Ayyanathan et al., 2000).
2.5. DNA sequencing
The protein–DNA complexes were electroeluted from the gel and amplified by PCR. The products were run on a 10% native PAGE, bands excised, DNA eluted and treated with proteinase-K. After digestion, the DNA was purified by phenol–chloroform–isoamyl alcohol extractions followed by ethanol precipitation. These enriched populations were then PCR amplified and used in the second round of mobility shift assays with fresh GST-ZnF proteins. This binding site selection process was repeated four more times. Finally, the highly enriched population was amplified by PCR, digested with EcoRI and BamHI restriction enzymes, ligated into pUC18 plasmid vector and transformed into E. coli DH5α cells. Mini-plasmid preparations and restriction enzyme digestions were used to analyze multiple independent clones for each GST-ZnF construct. Finally, for each construct, approximately 15 to 18 insert-positive clones were sent to ICBR Genomics Core at the University of Florida (Gainesville, Florida) for high throughput cycle sequencing in a 96-well format.
2.6. Alternative protocol to perform additional binding site selections
During the second series, binding site selections were conducted on an additional 17 ZAD family members. This included the two halves of a fused pair of ZAD proteins reported as CG34406. For CG34406, two GST-ZnF constructs namely CG34406-1 and CG34406-2 were created. During this second attempt, ZnF domains for each of the 17 ZAD members was amplified from Drosophila cDNA libraries and used in the construction of 18 GST-ZnF recombinant plasmids. Binding site selections were again conducted with purified GST-ZnF proteins and 49-mer oligonucleotide library as described above.
Several changes were made to the previous protocol, which involved radioactivity throughout the entire procedure, to develop a robust binding site selection (BSS) protocol that considerably minimized the use of radioactivity. In brief, a pre-enrichment cycle that combined the GST-ZnF proteins with unlabeled oligonucleotide library was included. The selected oligonucleotides were cycled three more times through this new enrichment process to obtain a highly enriched oligonucleotide population, which was then subjected to radioactive EMSA to obtain the finally selected population ready for cloning. This modified binding site selection (BSS) protocol has been recently published (Krystel and Ayyanathan, 2012).
2.7. Bioinformatics analysis
DNA sequence information derived from inserts of each independent clone was then analyzed with the Multiple Em for Motif Elicitation (MEME) tool (Bailey and Elkan, 1994; Bailey et al., 2009) to identify similarities and build DNA binding consensus for each ZAD member. This tool ranks sequences depending on an E-value that is based on the log likelihood ratio, width, sites and the background letter frequencies. Conserved sequences thus obtained for each ZAD member were then used to search the D. melanogaster genome for probable genetic targets in the Regulatory Sequence Analysis Tools (RSAT) database (Thomas-Chollier et al., 2008, 2011; van Helden, 2003) using the genome scale DNA-pattern tool. For each ZAD member, database searches were conducted on the consensus derived by MEME as well as on each of the individual binding site sequences that were used to build the consensus. The RSAT data was formatted through the g:Convert tool contained within the g:Profiler suite (Reimand et al., 2007, 2011) and then submitted to the Database for Annotation, Visualization and Integrated Discovery (DAVID) suite for analysis of enriched gene populations over the genomic baseline (Huang da et al., 2009a,b).
3. Results and discussion
3.1. ZAD transcription factors
D. melanogaster genome encodes 285 C2H2 zinc finger transcription factors containing 1785 C2H2 zinc finger motifs, which essentially serve to bind DNA in a sequence-specific manner (Duan et al., 2008). The ZAD containing C2H2 zinc finger transcription factor family is the largest and is comprised of 97 members. They all contain a conserved amino-terminal ZAD domain, which is thought to have a regulatory role in transcription while the carboxy-terminal C2H2 zinc fingers function in sequence-specific DNA recognition. In the present study, we have conducted a comprehensive analysis of several ZAD zinc finger transcription factors. The general architecture of the naturally occurring ZAD transcription factors used in this study is presented in Fig. 1A. Except for CG12219 and CG30020, in all other ZAD transcription factors, the zinc fingers were contiguous and present as tandem arrays.
Fig. 1.


ZAD-ZFPs and GST-ZnF recombinant proteins: (A) schematics of the natural architecture of 21 ZAD family members (Section 1). (B) Diagrammatic representation of 22 GST-ZnF recombinant plasmids constructed from 21 ZAD members. Purified GST-ZnF recombinant proteins are shown for the first four (C), an additional ten (D), and another eleven (E) ZAD family members along with broad range protein marker (M), and purified GST affinity tag as control (indicated by black arrows) (panels D and E also contain GST-ZnF proteins of CG8319, CG9797 and CG31365 that were not considered further as mentioned in Section 3.2). (F) Binding site selection and EMSA. Purified GST-ZnF recombinant proteins were bound to an end labeled 49-mer oligonucleotide library. Representative binding for four ZAD members are shown. Red arrows indicate the shifted DNA–protein complexes.
3.2. Selection and amplification of ZnF domains
For each ZAD member, indicated zinc finger regions were fused in frame with the GST domain to create chimeric GST-ZnF recombinant proteins that are diagrammatically represented in Fig. 1B. Detailed information such as the ZAD gene ID, number of amino acids in native protein, location of zinc fingers, number of zinc fingers, overall length of the GST-ZnF construct, and molecular weight of GST-ZnF fusion protein is provided for each of the 21 ZAD transcription factors chosen for this study (Table 1). In all GST-ZnF recombinant fusion proteins, amino acids 1–228 represent the GST moiety (denoted by $). In order to facilitate proper protein folding a 5–10 amino acid linker was added between the GST domain and the zinc fingers. Except for CG12219 (635 amino acids) and CG30020 (775 amino acids), all other GST-ZnF fusion proteins were in the range of 350–500 amino acids, which included 228 amino acids from the GST protein. One member, CG34406 was originally reported as two distinct ZAD proteins. Updated sequence information now indicates that it contains two ZAD proteins fused in a head-to-tail orientation (McQuilton et al., 2012). The zinc finger arrays were PCR amplified using the primers presented in Table A.1 and ligated into a pGEX-4T2 plasmid vector for expression of GST-tagged-ZnF recombinant proteins.
Table 1.
Detailed information on 21 natural ZAD proteins and 22 GST-ZnF recombinant proteins.
| Protein ID | Native length (aa) | ZnF region | Number of ZnFs | Construct length (aa) | Construct size (kDa) | Length of ZnF region$ |
|---|---|---|---|---|---|---|
| CG1792 | 372 | 196–333 | 5 | 386 | 45 | 229–386 |
| CG2711 | 592 | 305–527 | 8 | 472 | 55 | 229–472 |
| CG4730 | 392 | 181–346 | 6 | 414 | 49 | 229–414 |
| CG4820 | 383 | 243–365 | 4 | 371 | 44 | 229–371 |
| CG7357 | 430 | 207–346 | 5 | 388 | 46 | 229–388 |
| CG7928 | 457 | 257–454 | 7 | 439 | 52 | 229–439 |
| CG7938 | 356 | 171–342 | 6 | 415 | 49 | 229–415 |
| CG8145 | 370 | 182–319 | 5 | 386 | 45 | 229–386 |
| CG10267 | 388 | 223–359 | 5 | 385 | 46 | 229–385 |
| CG10309 | 924 | 709–820 | 4 | 360 | 42 | 229–360 |
| CG10321 | 835 | 625–772 | 5 | 396 | 46 | 229–396 |
| CG10366 | 578 | 240–469 | 8 | 478 | 56 | 229–478 |
| CG12219 | 562 | 138–527 | 4 | 635 | 71 | 229–635 |
| CG12391 | 587 | 416–525 | 4 | 358 | 43 | 229–358 |
| CG14710 | 415 | 294–430 | 5 | 385 | 46 | 229–385 |
| CG14711 | 379 | 226–362 | 5 | 387 | 45 | 229–387 |
| CG15436 | 346 | 126–345 | 8 | 459 | 54 | 229–459 |
| CG17958 | 433 | 194–428 | 7 | 478 | 57 | 229–478 |
| CG30020 | 1309 | 140–995 | 10* | 775 | 89 | 229–775 |
| CG30431 | 418 | 232–403 | 6 | 421 | 50 | 229–421 |
| CG33406-1 | 690 | 222–328 | 4 | 355 | 42 | 229–355 |
| CG33406-2 | 690 | 489–680 | 6 | 440 | 52 | 229–440 |
Amino acids 1–228 in each construct contain the GST moiety.
CG30020 contain five additional zinc fingers outside of the array that were not included in the recombinant construct.
In this comprehensive study, we originally generated GST-ZnF recombinant constructs for 32 out of 97 ZAD family members. However, we are providing information for only 21 ZAD members in this research paper. The characterization of CG4413 is recently published (Krystel and Ayyanathan, 2012). Similarly, molecular studies with CG11695 will be published elsewhere (Krystel and Ayyanathan—unpublished data). The remaining 9 ZAD members were not considered for further studies for the following two reasons. GST-ZnF recombinant proteins of CG2889, CG3941, CG6254, CG10654 and CG33133, were expressed in insoluble form as inclusion bodies. For the remaining 4 ZAD members namely, CG8319, CG9233, CG 9797 and CG 31365, the GST-ZnF fusion proteins were expressed in soluble form; however, they did not yield any significant DNA–protein complexes in EMSA (data not shown). Therefore, in the present study, we have deciphered consensus DNA recognition sequences and performed a global analysis of their regulated target genes through a variety of bioinformatics approaches for each of the 21 ZAD transcription factors mentioned in Section 1.
3.3. Expression, purification, and DNA binding activity of GST-ZnF fusion proteins
Multiple, independent recombinant clones for each GST-ZnF construct protein were analyzed to check for expression of correct size proteins (data not shown). GST-ZnF recombinant proteins were purified from cell lysates by GSH-Sepharose affinity column chromatography. Homogeneously purified proteins, for the first four ZAD members mentioned above, were analyzed by SDS-PAGE and the results presented in Fig. 1C. SDS-PAGE gel analysis of homogeneously purified GST-ZnF proteins from the second batch of ZAD members are shown in Figs. 1D and E. Next to show that these recombinant GST-ZnF fusion proteins could efficiently bind to DNA, we carried out EMSA with random oligonucleotide library as described in Materials and methods (Section 2.4). Indeed, the shifted DNA–protein complexes in EMSA confirm the DNA binding potentials of a panel of four selected GST-ZnF fusion proteins (Fig. 1F). We have confirmed the DNA binding potentials for the remaining GST-ZnF fusion proteins (data not shown). Also, GST control protein did not yield any binding activity to either the original or enriched libraries (data not shown). Each shifted complex was eluted from the gel and amplified by PCR to create enriched ZnF-specific oligonucleotide libraries for each ZAD member. These ZnF-specific oligonucleotide libraries contain a fraction of the original 68 billion (N18; i.e., 418) possible combinations. These libraries then underwent sequential rounds of enrichment prior to cloning and DNA sequencing.
3.4. MEME derived consensus sequences
Insert DNA sequences obtained through high throughput sequencing were compiled and analyzed for the presence of conserved motifs using Multiple Em for Motif Elicitation (MEME) bioinformatics tools (Bailey and Elkan, 1994; Bailey et al., 2009). MEME analyzes sequences based on the log likelihood ratio, width, sites and the background letter frequencies and assigns a statistical measurement termed the E-value. This analysis was conducted individually for each of the 21 studied ZAD members and the resulting position weight matrix values are presented in Fig. 2. For each ZAD member only high quality sequences were used for the derivation of the binding site consensus. Depending on the available number of insert DNA sequences for each member, we used an average of 17 sequences per consensus (16.9) with a standard deviation of 6.3. A minimum of 7 sequences for CG17958 and a maximum of 30 sequences for CG 15436 were used to build consensus, while all others fell within these two extremes. A degree of plasticity was expected in developing the binding site consensus. This is consistent with previously published work describing that an excess of ZFP protein will incorporate less ideal binding sequences at a modest rate (Choo et al., 1997).
Fig. 2.

Derivation of binding site consensus by MEME analysis: for each member, several binding site selected clone’s inserts were sequenced and used to build consensus binding sites with the MEME alignment tool. Position weight matrices for each of the 22 GST-ZnF constructs are shown along with their associated ‘E’ values.
3.5. ClustalW analysis and competition EMSA
Initial analysis employed the use of ClustalW analysis tool to identify the binding site consensus sequences. Based on the consensus sequences derived from this analysis for CG7938, CG12219, CG17958, and CG30020, binding sites representing the most conserved sequences (wt) and a scrambled form (mutant) were produced and used in a series of competition gel shift assays. The consensus sequences identified in this manner were substantially similar to those derived using the MEME analysis. The exact consensus (wt) and scrambled (mutant) binding sites are presented in Table A.2 for CG7938, CG12219, CG17958, and CG30020. Fig. 3A demonstrates the EMSA results (in full gel version) for the CG12219 competition experiment. The GST-ZnF protein for CG12219 efficiently bound to the wt consensus-binding site and generated a shifted DNA–protein complex. When 10×, 20× or 40× of the unlabeled wt consensus-binding site was included in the assay, the observed complex was efficiently competed out in a dose-dependent manner. However, the presence of even 40-fold excess of the scrambled-binding site was unable to eliminate the complex, strongly suggesting that the authenticity of the observed DNA–protein complex. Similar competition assays were performed for CG7938, CG17958 and CG30020 using their corresponding GST-ZnF proteins and the results are presented in Fig. 3B (only the regions containing the complexes are shown). Again, the wt consensus-binding sites efficiently competed out the shifted DNA–protein complexes while the scrambled-binding sites were unable to do so. These competition assays prove the functionalities of each GST-ZnF recombinant protein and also confirm the uniqueness of the deciphered consensus binding sites for each ZAD member.
Fig. 3.

Competition EMSA: oligonucleotides containing the wild-type consensus (wt) and scrambled (mutant) sequences were used in a series of competition gel-shift assays. Wild-type consensus sequences efficiently competed as identified by the loss of the DNA–protein complex. The mutant sequences were much less effective in dislodging the complex, even at 40×, indicating an essential nature of conserved positions. Competition EMSA results are presented for CG12219 (full gel) (A) and regions containing the DNA–protein complexes for CG7938, CG30020 and CG17958 (B). $For CG7938, the lane with wt-shifted complex is from a replicate gel and for *CG17958, the 20× wild type competition lane had a background radioactive smudge that obscures the complex.
3.6. Identification and analysis of genomic targets using RSAT and DAVID bioinformatics tools
Next, a genome scale DNA pattern matching tool, Regulatory Sequence Analysis Tools (RSAT) was used to identify Drosophila genes that contained the conserved sequences within their regulatory regions (Thomas-Chollier et al., 2008, 2011; van Helden, 2003). For this analysis, derived consensus sequence and individual component sequences were checked against the database. Target genes were converted to FlyBase Gene IDs with the use of publicly available G: profiler toolset (Reimand et al., 2007, 2011). Each list was then analyzed for related clusters of genes based on gene ontology annotations and keywords using the Database for Annotation, Visualization and Integrated Discovery (DAVID) bioinformatics tool (Huang da et al., 2009a,b). A high degree of similarity was present in the most enriched clusters for each of the ZAD proteins studied. A heat map showing the enrichment scores of the most conserved clusters is presented in Fig. 4. This enrichment score, provided through DAVID analysis, is the negative log of the geometric mean of the Fisher exact test p-values of each term included in the cluster. Examples of two such clusters for neural development related gene ontology terms are included in Table 2A for CG34406-2 and in Table 2B for CG7928. This includes the p-values and fold enrichment for each of the included terms. A full listing of clusters identified by DAVID analysis for all 22 GST-ZnF constructs is provided in Table A.3. Shown in Fig. 5 are fold enrichment details for a selection of individually enriched terms for four ZAD proteins CG7928 (A), CG14710 (B), CG10309 (C) and CG8145 (D). The CG7928 may have a role in chromatin dynamics since genes representing the functional terms such as nucleosome assembly and chromatin remodeling complex are enriched. Based on its associated gene ontology terms, CG14710 may function in gastrulation and in the signal transduction processes such as hedgehog receptor and tyrosine kinase signaling pathways. CG10309 (pad), as expected, contained highly enriched terms associated with neurological system processes. This observation supports its involvement in the development of the thoracic macrochaetes (Gibert et al., 2005). Based on their gene ontology cluster, we propose that CG8145 may be involved in the development of the ventral cord and photoreceptors, as well as a role in the regulation of apoptosis and cell survival. Future in vivo studies will confirm our findings.
Fig. 4.
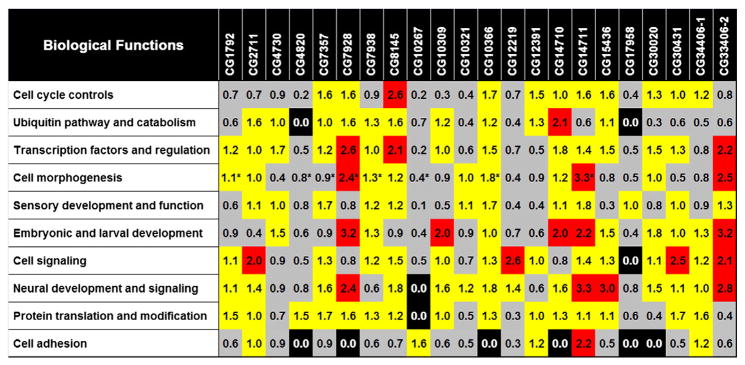
Functional annotation cluster enrichment scores from DAVID analysis of the predicted ZAD target genes: the target genes are grouped into each cluster based on related gene ontology terms. Each cluster was assigned an enrichment value based on the geometric mean of the Fisher exact test ‘p’ values for each of its GO terms. Shown in the heat map are the values for the most enriched clusters within the ten most prevalent gene ontology categories (rows) for each of the GST-ZnF constructs (columns). If no cluster that can fit the category is identified, then a value of 0.0 is assigned. Shaded in gray are values greater than 0.0 and less than 1.0; in yellow are values between 1.0 (inclusive) and 2.0; in red are values 2.0 and above. Clusters indicated in * contained gene ontology terms associated with multiple categories.
Table 2A.
Neural development associated gene ontology clusters: shown are the enriched terms for the target genes of CG34406-2.
| CG34406-2 neural development cluster overall enrichment score: 2.79739
| ||
|---|---|---|
| Gene ontology term | Fold enrichment | p Value |
| Cell morphogenesis | 1.493769271 | 3.80 E-05 |
| Cell motion | 1.612041201 | 3.82E-05 |
| Cell projection organization | 1.44326585 | 7.56E-04 |
| Cellular component morphogenesis | 1.355964055 | 9.1 2E-04 |
| Neuron development | 1.437165591 | 0.0012007 |
| Neuron projection morphogenesis | 1.4735441 55 | 0.0016507 |
| Neuron projection development | 1.468409855 | 0.0017987 |
| Cell morphogenesis involved in neuron differentiation | 1.463311209 | 0.0019583 |
| Neuron differentiation | 1.373866759 | 0.0021849 |
| Cell projection morphogenesis | 1.426728429 | 0.0023853 |
| Dendrite development | 1.740965131 | 0.003267 |
| Dendrite morphogenesis | 1.7409651 31 | 0.003267 |
| Cell part morphogenesis | 1.400534716 | 0.0034954 |
| Cell morphogenesis involved in differentiation | 1.414051228 | 0.004056 |
| Axonogenesis | 1.454442657 | 0.0122699 |
| Axon guidance | 1.497742061 | 0.0257663 |
Table 2B.
Neural development associated gene ontology clusters: shown are the enriched terms for the target genes of CG7928.
| CG7928 neural development cluster overall enrichment score: 2.43744
| ||
|---|---|---|
| Gene ontology term | Fold enrichment | p Value |
| Cellular component morphogenesis | 3.244742221 | 2.31E-05 |
| Cell morphogenesis | 2.957625765 | 6.91E-04 |
| Neuron projection morphogenesis | 3.591402715 | 8.23E-04 |
| Neuron projection development | 3.578889117 | 8.45E-04 |
| Cell morphogenesis involved in neuron differentiation | 3.566462418 | 8.68E-04 |
| Neuron development | 3.229157484 | 0.001006807 |
| Neuron differentiation | 2.967956278 | 0.001154115 |
| Cell morphogenesis involved in differentiation | 3.389904873 | 0.00127813 |
| Cell projection morphogenesis | 3.209816176 | 0.001922016 |
| Cell part morphogenesis | 3.103145548 | 0.00246372 |
| Axonogenesis | 3.77278669 | 0.004838806 |
| Cell projection organization | 2.814085415 | 0.004955451 |
| Dendrite development | 3.192357969 | 0.126722478 |
| Dendrite morphogenesis | 3.192357969 | 0.126722478 |
| Axon guidance | 2.746366782 | 0.174120826 |
| Cell motion | 1.836914176 | 0.220826616 |
Fig. 5.

Graphical representation of highly enriched gene ontology terms: the fold enrichment (Y axis) for a selection of gene ontology terms (X axis) describing the target gene sets from ZAD proteins CG7928 (A), CG14710 (B), CG10309 (C), and CG8145 (D) are shown.
3.7. Correlation to known ZAD properties
In this study, we have identified distinct binding sites for 21 of the 97 reported ZAD family members. In this selection were two proteins with previously reported in vivo binding sites determined by nuclease protection assays. We found the ideal binding sites to be more diverse than expected. The previously reported work showed CG17958 and CG7958 each bound a 13 base pair region with 10 positions conserved between the two Serendipity (Sry) ZAD genes (Payre and Vincent, 1991). This high degree of similarity was consistent with a model where the redundancy of targets resulted from insufficient time to diverge and acquire new binding specificities. Upon comparison of the binding site selected consensus sequences for the Sry genes, we find that while each is similar to their respective reported in vivo sites, they are less similar to each other. The binding site consensus sequence reported in our study for syr β is significantly similar (5 of 8 conserved nucleotides) to those previously reported. Our sequence for sry δ is also highly similar (6 of 10 well conserved nucleotides). The relative similarity seen between sry β and sry δ in each study is drastically different. The previously reported sequences shared similarity in 10 out of the 13 positions; however, we are reporting similarity in only 4 positions. Fig. 6 illustrates these comparisons.
Fig. 6.

Comparisons of serendipity binding site sequences: (A) 1. our EMSA-derived binding site consensus for sry β; 2. reported in vivo binding site for sry β; 3. reported nuclease protection assay derived binding site consensus for sry β; 4. reported nuclease protection assay derived binding site consensus for sry δ; and 5. our EMSA derived binding site consensus for sry δ. Also shown are side-by-side comparisons of the previously reported sequences for sry β and sry δ (B), and of our consensus sequences for sry β and sry δ (C).
We also noticed that the proteins did not group into distinct families in spite of binding highly similar target sites. While there was a degree of similarity in the binding sites of some members (such as CG4820/CG4730, CG7357/CG10309), they differed at some of the most conserved positions and therefore expectedly recognizing different targets. It is possible that closer homologs of ZAD members tested in this cohort may be present in the remaining 75 ZAD members. We expected that our process of selecting 21 ZAD members with the most similar architectures would help in identifying members that share similar targets. To our surprise all 21 ZAD members selected unique, distinct, recognition sites and hence reported different target gene profiles. However, each of these profiles shared a high degree of similarity in their gene functions as evident in the gene ontology cluster analysis (Fig. 4).
Those few ZAD members characterized in the literature often possess an obvious mutant phenotype and are associated with early developmental processes. Most of the remaining ZAD family proteins have little to no reported functional data in the literature. Of those known, Grauzone activates cortex in a necessary step in oocyte meiosis (Harms et al., 2000). CG17958 (sry-δ) activates bicoid and deficiencies result in sex based lethality in the zygote (Crozatier et al., 1992). The gene poils au dos appears to act as a repressor of achaete and scute with allele phenotypes effecting the development of thoracic macrochaetes from the imaginal disc, leg formation, and pupae survival (Gibert et al., 2005). The putative target genes we have identified follow closely with this reported ZAD function. All twenty-one proteins studied mapped to a cluster of genes involved in the development of the imaginal discs. Only the first array from CG34406 did not contain such a cluster. Other highly enriched gene ontology clusters contained genes required for early development of Drosophila. This included genes with functions in embryonic and larval development, sensory organ and eye development, chromatin dynamics and transcriptional regulation, cell morphogenesis, cell cycle controls, and cell-to-cell signaling.
4. Conclusions
The expansion of particular families of zinc finger transcription factors in various higher eukaryotes has been well described in the literature (Chung et al., 2007; Duan et al., 2008; Hamilton et al., 2003; Huntley et al., 2006). Less understood is the reason why one kind of effector domain family is expanded in one lineage (for example, ZAD family in dipteran insects) while a different effector domain family dominates in another (for example, KRAB family in mammals). Understanding the differences leading to this variation is complicated by the cryptic nature of the ZAD family members since very little information is available about this transcription factor family. ZAD proteins represent a significant portion of the Drosophila regulatory apparatus and are expressed in the very important early developmental stages. Based on the available data from high throughput RNA expression studies; out of the 21 independent ZAD proteins discussed directly in this work, 20 show up-regulated expression in the ovary, 9 in embryonic cell lines, 14 in the larval CNS and 7 in other larval regions (Chintapalli et al., 2007). Increased expression in the ovary can be an indicator of a protein being maternally deposited. Previously reported in situ hybridization data for several ZAD members reveal abundant expression in the earliest embryo stages (Tomancak et al., 2002, 2007). This expression profile also indicates a strong maternal effect for ZAD proteins. Despite this, the gene functions of most members are yet to be reported. This facet of ZAD proteins has received a high degree of speculation in the literature in recent years, with in silico studies strongly suggesting a particular evolutionary history for ZAD proteins that has left them with enough overlapping function between members to mask many phenotypes (Chung et al., 2007). Our study for the first time addresses this theory experimentally.
Our results appear consistent with the current cryptic nature of many ZAD proteins. Multiple ZAD proteins are targeting genes with closely related functions. The knockout or knockdown of one of those members would still leave other ZADs intact that can exert the same control. We had expected the recent divergence to having resulted in identical or overlapping binding sites. We instead observed ZAD members possessing relatively divergent DNA binding sites targeting different regions near the promoter of the same or highly similar genes. This indicates to us a positive selection is occurring to maintain the redundancy of function. We therefore postulate that there is a distinction in function between the members associated with that positive selection. This may also indicate that similar selective pressures are at work in other dipterans with similar lineage-specific expansions in the ZAD family such as Culex and Anopheles mosquitoes. Future knockout studies of multiple members with related targets should elucidate their specific functions.
Understanding the origin of the ZAD family of zinc finger proteins should provide insight into the evolutionary history and formation of lineage specific features far beyond Drosophila. It is likely that other zinc finger transcription factor families in higher eukaryotes, such as the KRAB family in mammals, have undergone similar evolutionary processes. This phenomenon may better be understood through the use of Drosophila as a model system. Beyond the evolutionary insights, D. melanogaster is also one of the most utilized model organisms for genetic and molecular studies. The ease of growth, availability of powerful genetic techniques, and relatively high incidence of homology with human disease states contribute to this status. With this prevalence of use, filling in gaps in our current understanding of ZAD family takes on a special significance.
Supplementary Material
Acknowledgments
The authors would like to thank Edna Gamliel for her expert assistance in the generation of GST-ZnF recombinant constructs, purification of GST-ZnF fusion proteins, and in the screening of binding site selected clones. Funding assistance from the Department of Biological Sciences, FAU as grant-in-aid to K.A. and from the National Institutes of Health to K. A. (grant 5K01CA95620) to carry out this work is gratefully acknowledged.
Abbreviation
- cDNA
DNA complementary to RNA
- bp
base pair(s)
- aa
amino acid(s)
- Ap
ampicillin
- A
adenosine
- C
cytidine
- ds
double strand(ed)
- DTT
dithiothreitol
- G
guanosine
- IPTG
isopropyl β-D-thiogalactopyranoside
- kDa
kilodalton(s)
- Km
kanamycin
- LB
Luria–Bertani (medium)
- N
any nucleoside
- nt
nucleotide(s)
- oligo
oligodeoxyribonucleotide
- p
plasmid
- PAGE
PA-gel electrophoresis
- SDS
sodium dodecyl sulfate
- T
thymidine
- wt
wild type
- R
purine
- Y
pyrimidine
- ZAD
zinc-finger associated domain
- ZnF
zinc finger
- EMSA
electrophoretic mobility shift assays
- GST
glutathione-S-transferase
Footnotes
Supplementary data to this article can be found online at http://dx.doi.org/10.1016/j.gene.2012.09.114.
References
- Adryan B, Teichmann SA. FlyTF: a systematic review of site-specific transcription factors in the fruit fly Drosophila melanogaster. Bioinformatics. 2006;22:1532–1533. doi: 10.1093/bioinformatics/btl143. [DOI] [PubMed] [Google Scholar]
- Adryan B, Teichmann SA. The developmental expression dynamics of Drosophila melanogaster transcription factors. Genome Biol. 2010;11:R40. doi: 10.1186/gb-2010-11-4-r40. [DOI] [PMC free article] [PubMed] [Google Scholar]
- Ayyanathan K, et al. Hormone-dependent tumor regression in vivo by an inducible transcriptional repressor directed at the PAX3-FKHR oncogene. Cancer Res. 2000;60:5803–5814. [PubMed] [Google Scholar]
- Ayyanathan K, et al. Regulated recruitment of HP1 to a euchromatic gene induces mitotically heritable, epigenetic gene silencing: a mammalian cell culture model of gene variegation. Genes Dev. 2003;17:1855–1869. doi: 10.1101/gad.1102803. [DOI] [PMC free article] [PubMed] [Google Scholar]
- Bailey TL, Elkan C. Fitting a mixture model by expectation maximization to discover motifs in biopolymers. Proc Int Conf Intell Syst Mol Biol. 1994;2:28–36. [PubMed] [Google Scholar]
- Bailey TL, et al. MEME SUITE: tools for motif discovery and searching. Nucleic Acids Res. 2009;37:W202–W208. doi: 10.1093/nar/gkp335. [DOI] [PMC free article] [PubMed] [Google Scholar]
- Benson DA, Karsch-Mizrachi I, Lipman DJ, Ostell J, Sayers EW. GenBank. Nucleic Acids Res. 2009;37:D26–D31. doi: 10.1093/nar/gkn723. [DOI] [PMC free article] [PubMed] [Google Scholar]
- Brent R, Ptashne M. A eukaryotic transcriptional activator bearing the DNA specificity of a prokaryotic repressor. Cell. 1985;43:729–736. doi: 10.1016/0092-8674(85)90246-6. [DOI] [PubMed] [Google Scholar]
- Chiang C, Ayyanathan K. Characterization of the E-box binding affinity to SNAG-zinc finger proteins. Mol Biol. 2012;46:811–818. [PubMed] [Google Scholar]
- Chintapalli VR, Wang J, Dow JA. Using FlyAtlas to identify better Drosophila melanogaster models of human disease. Nat Genet. 2007;39:715–720. doi: 10.1038/ng2049. [DOI] [PubMed] [Google Scholar]
- Choo Y, Castellanos A, Garcia-Hernandez B, Sanchez-Garcia I, Klug A. Promoter-specific activation of gene expression directed by bacteriophage-selected zinc fingers. J Mol Biol. 1997;273:525–532. doi: 10.1006/jmbi.1997.1339. [DOI] [PubMed] [Google Scholar]
- Chung HR, Schafer U, Jackle H, Bohm S. Genomic expansion and clustering of ZAD-containing C2H2 zinc-finger genes in Drosophila. EMBO Rep. 2002;3:1158–1162. doi: 10.1093/embo-reports/kvf243. [DOI] [PMC free article] [PubMed] [Google Scholar]
- Chung HR, Lohr U, Jackle H. Lineage-specific expansion of the zinc finger associated domain ZAD. Mol Biol Evol. 2007;24:1934–1943. doi: 10.1093/molbev/msm121. [DOI] [PubMed] [Google Scholar]
- Collins T, Stone JR, Williams AJ. All in the family: the BTB/POZ, KRAB, and SCAN domains. Mol Cell Biol. 2001;21:3609–3615. doi: 10.1128/MCB.21.11.3609-3615.2001. [DOI] [PMC free article] [PubMed] [Google Scholar]
- Crozatier M, Kongsuwan K, Ferrer P, Merriam JR, Lengyel JA, Vincent A. Single amino acid exchanges in separate domains of the Drosophila serendipity delta zinc finger protein cause embryonic and sex biased lethality. Genetics. 1992;131:905–916. doi: 10.1093/genetics/131.4.905. [DOI] [PMC free article] [PubMed] [Google Scholar]
- Duan J, Xia Q, Cheng D, Zha X, Zhao P, Xiang Z. Species-specific expansion of C2H2 zinc-finger genes and their expression profiles in silkworm, Bombyx mori. Insect Biochem Mol Biol. 2008;38:1121–1129. doi: 10.1016/j.ibmb.2008.08.005. [DOI] [PubMed] [Google Scholar]
- Fu F, et al. Zinc Finger Database (ZiFDB): a repository for information on C2H2 zinc fingers and engineered zinc-finger arrays. Nucleic Acids Res. 2009;37:D279–D283. doi: 10.1093/nar/gkn606. [DOI] [PMC free article] [PubMed] [Google Scholar]
- Gibert JM, Marcellini S, David JR, Schlotterer C, Simpson P. A major bristle QTL from a selected population of Drosophila uncovers the zinc-finger transcription factor poils-au-dos, a repressor of achaete-scute. Dev Biol. 2005;288:194–205. doi: 10.1016/j.ydbio.2005.09.032. [DOI] [PubMed] [Google Scholar]
- Haerty W, Artieri C, Khezri N, Singh RS, Gupta BP. Comparative analysis of function and interaction of transcription factors in nematodes: extensive conservation of orthology coupled to rapid sequence evolution. BMC Genomics. 2008;9:399. doi: 10.1186/1471-2164-9-399. [DOI] [PMC free article] [PubMed] [Google Scholar]
- Hamilton AT, Huntley S, Kim J, Branscomb E, Stubbs L. Lineage-specific expansion of KRAB zinc-finger transcription factor genes: implications for the evolution of vertebrate regulatory networks. Cold Spring Harb Symp Quant Biol. 2003;68:131–140. doi: 10.1101/sqb.2003.68.131. [DOI] [PubMed] [Google Scholar]
- Harms E, Chu T, Henrion G, Strickland S. The only function of Grauzone required for Drosophila oocyte meiosis is transcriptional activation of the cortex gene. Genetics. 2000;155:1831–1839. doi: 10.1093/genetics/155.4.1831. [DOI] [PMC free article] [PubMed] [Google Scholar]
- Huang da W, Sherman BT, Lempicki RA. Bioinformatics enrichment tools: paths toward the comprehensive functional analysis of large gene lists. Nucleic Acids Res. 2009a;37:1–13. doi: 10.1093/nar/gkn923. [DOI] [PMC free article] [PubMed] [Google Scholar]
- Huang da W, Sherman BT, Lempicki RA. Systematic and integrative analysis of large gene lists using DAVID bioinformatics resources. Nat Protoc. 2009b;4:44–57. doi: 10.1038/nprot.2008.211. [DOI] [PubMed] [Google Scholar]
- Huntley S, et al. A comprehensive catalog of human KRAB-associated zinc finger genes: insights into the evolutionary history of a large family of transcriptional repressors. Genome Res. 2006;16:669–677. doi: 10.1101/gr.4842106. [DOI] [PMC free article] [PubMed] [Google Scholar]
- Krystel J, Ayyanathan K. An efficient and cost-effective protocol for selecting transcription factor binding sites that reduces isotope usage. J Biomol Tech. 2012;23:40–46. doi: 10.7171/jbt.12-2302-004. [DOI] [PMC free article] [PubMed] [Google Scholar]
- Liu PQ, et al. Regulation of an endogenous locus using a panel of designed zinc finger proteins targeted to accessible chromatin regions. Activation of vascular endothelial growth factor A. J Biol Chem. 2001;276:11323–11334. doi: 10.1074/jbc.M011172200. [DOI] [PubMed] [Google Scholar]
- McQuilton P, St Pierre SE, Thurmond J. FlyBase 101—the basics of navigating FlyBase. Nucleic Acids Res. 2012;40:D706–D714. doi: 10.1093/nar/gkr1030. [DOI] [PMC free article] [PubMed] [Google Scholar]
- Payre F, Vincent A. Genomic targets of the serendipity beta and delta zinc finger proteins and their respective DNA recognition sites. EMBO J. 1991;10:2533–2541. doi: 10.1002/j.1460-2075.1991.tb07793.x. [DOI] [PMC free article] [PubMed] [Google Scholar]
- Peng H, Zheng L, Lee WH, Rux JJ, Rauscher FJ., III A common DNA-binding site for SZF1 and the BRCA1-associated zinc finger protein, ZBRK1. Cancer Res. 2002;62:3773–3781. [PubMed] [Google Scholar]
- Pfreundt U, James DP, Tweedie S, Wilson D, Teichmann SA, Adryan B. FlyTF: improved annotation and enhanced functionality of the Drosophila transcription factor database. Nucleic Acids Res. 2010;38:D443–D447. doi: 10.1093/nar/gkp910. [DOI] [PMC free article] [PubMed] [Google Scholar]
- Reimand J, Kull M, Peterson H, Hansen J, Vilo J. g:Profiler—a web-based toolset for functional profiling of gene lists from large-scale experiments. Nucleic Acids Res. 2007;35:W193–W200. doi: 10.1093/nar/gkm226. [DOI] [PMC free article] [PubMed] [Google Scholar]
- Reimand J, Arak T, Vilo J. g:Profiler—a web server for functional interpretation of gene lists (2011 update) Nucleic Acids Res. 2011;39:W307–W315. doi: 10.1093/nar/gkr378. [DOI] [PMC free article] [PubMed] [Google Scholar]
- Thomas-Chollier M, et al. RSAT: regulatory sequence analysis tools. Nucleic Acids Res. 2008;36:W119–W127. doi: 10.1093/nar/gkn304. [DOI] [PMC free article] [PubMed] [Google Scholar]
- Thomas-Chollier M, et al. RSAT 2011: regulatory sequence analysis tools. Nucleic Acids Res. 2011;39:W86–W91. doi: 10.1093/nar/gkr377. [DOI] [PMC free article] [PubMed] [Google Scholar]
- Tomancak P, et al. Systematic determination of patterns of gene expression during Drosophila embryogenesis. Genome Biol. 2002;3:RESEARCH0088. doi: 10.1186/gb-2002-3-12-research0088. [DOI] [PMC free article] [PubMed] [Google Scholar]
- Tomancak P, et al. Global analysis of patterns of gene expression during Drosophila embryogenesis. Genome Biol. 2007;8:R145. doi: 10.1186/gb-2007-8-7-r145. [DOI] [PMC free article] [PubMed] [Google Scholar]
- van Helden J. Regulatory sequence analysis tools. Nucleic Acids Res. 2003;31:3593–3596. doi: 10.1093/nar/gkg567. [DOI] [PMC free article] [PubMed] [Google Scholar]
Associated Data
This section collects any data citations, data availability statements, or supplementary materials included in this article.