

Abstract
Cyclosporine (CsA) is a highly effective immunosuppressant used in patients after transplantation; however its use is limited by nephrotoxicity. Salt depletion is known to enhance CsA-induced nephrotoxicity in the rat, but the underlying molecular mechanisms are not completely understood.
The goal of our study was to identify the molecular effects of salt depletion alone and in combination with CsA on the kidney using a proteo metabolomic strategy. Rats (n=6) were assigned to four study groups: 1) normal controls, 2) low-salt fed controls, 3) 10 mg/kg/d CsA for 28 days on a normal diet, 4) 10 mg/kg/d CsA for 28 days on low-salt diet.
Low-salt diet redirected kidney energy metabolism towards mitochondria as indicated by a higher energy charge than in normal-fed controls. Low-salt diet alone reduced phospho-AKT and phospho-STAT3 levels, and changed the expression of ion transporters PDZK1 and CLIC1.
CsA induced macro- and microvesicular tubular epithelial vacuolization and reduced energy charge; changes that were more significant in low-salt fed animal, probably because of their more pronounced dependence on mitochondria. Here, CsA increased phospho-JAK2 and phospho-STAT3 levels and reduced the phospho-IKKγ and p65 proteins, thus activating NF-κB signaling. Decreased expression of lactate transport regulator CD147 and phospho-AKT was also observed after CsA exposure in low-salt rats, indicating a decrease in glycolysis.
In summary, our study suggests a key role for PDZK1, CD147, JAK/STAT and AKT signaling in CsA-induced nephrotoxicity and proposes mechanistic explanations on why rats fed a low-salt diet have higher sensitivity to CsA.
Keywords: CsA-induced nephrotoxicity, proteomics, metabolomics, salt depletion
INTRODUCTION
Calcineurin inhibitors (CNIs) cyclosporine (CsA) and tacrolimus (TAC) are potent immunosuppressants currently used in patients as rejection prophylaxis after transplantation. The predisposition of these agents to ultimately damage the very organs they were intended to protect was always recognized but tolerated due to their impressive improvement of short-term outcomes1. Although recent analyses indicates a moderate increase of renal allograft half-lives, long-term results are still not acceptable2. While cardiovascular complications are the major cause of death in kidney transplant patients3, chronic renal allograft injury is the principal cause of late renal allograft loss after the first year3, 4. After approximately 8 years, 50% of renal allograft transplant patients lose their transplant. Surprisingly, while the mechanisms of the immunosuppressive action of CNIs are well understood, knowledge of the basic biochemical mechanisms resulting in CNI nephrotoxicity is incomplete5, 6. One of the major reasons for this is that there are no good animal models: rats and mice are far less sensitive to CNI nephrotoxicity than humans7.
At present, the following key mechanisms of CsA toxicity have been identified: oxidative stress, apoptosis, metabolic changes8, 9 and an increase of vascular resistance resulting in decreased renal blood flow10. Our previous proteomic studies evaluating the effects of CNIs alone and in combination with sirolimus in rats on a normal diet showed that several signaling pathways including calcium homeostasis, structural proteins, mitochondrial function and cell metabolism were affected11.
Salt-depletion is known to sensitize the rat kidneys to CNI toxicity. Histological changes develop faster than in normal-fed rats and thus the salt-depleted rat model has extensively been used to study immunosuppressant toxicity12-14. However not much is known about the molecular mechanisms responsible for the enhancement of CNI toxicity in this non-physiological model. We believe that a better understanding of the molecular mechanisms enhancing CsA nephrotoxicity in salt-depleted rats will also reveal more in-depth molecular insights into CsA nephrotoxicity itself.
We employed a proteo-metabolomic strategy11 to study the effects of salt depletion on the rat kidney in absence and presence of CsA and correlated the changes in protein expression and metabolite concentrations with tissue histology and established clinical kidney function parameters.
METHODS
Animal protocol
Twenty four male Wistar rats were acclimatized for two weeks and then randomly assigned to four treatment groups (n=6/group) for 28 days:
vehicle controls fed a normal-salt diet,
CsA 10mg/kg/day fed a normal-salt diet,
vehicle controls fed a low-salt diet,
CsA 10mg/kg/day fed a low-salt diet.
For urine 1H-NMR analysis urine from all 24 study animals was collected and analyzed. After 27 days of treatment, rats were placed in metabolic cages and their 24h urine was collected. Hereafter the rats were sacrificed and tissue and blood samples were collected A subset of four animals per study group was randomly selected for proteomics analysis. Salt-depleted animals had been started on a “low salt diet” (obtained from Harlan Laboratories, Madison, WI) one month prior to study initiation. The low salt diet contained 0.07% chloride and 0.01-0.02% background sodium. All animal protocols were approved by the University of Colorado Institutional Animal Care and Use Committee, and animal care was in accordance with the National Institutes of Health guidelines for ethical animal research (NIH publication No. 80-123). All animals were housed in cages in a temperature and light-controlled environment with free access to tap water and food ad libitum.
Drugs
Commercially available oral drinking solution of CsA (Neoral, Novartis, East Hanover, NJ) was administered by oral gavage in a constant volume according to group assignments. Neoral formulation was diluted in skim milk to a final concentration of 10 mg/mL and the volume of gavage was adjusted based on the animal weight. The drug doses were based on previous systematic dose-finding studies, which aimed to achieve CsA blood drug concentrations similar to those observed in transplant patients11, 15-18. Vehicle control animals received skim milk only.
Clinical chemistry
Serum analysis for creatinine and plasma blood urea nitrogen (BUN), and urine analysis for creatinine was performed by the University of Colorado Hospital Laboratory.
Histology
Evaluation of kidney histology was carried out in a blinded manner using a semi-quantitative scoring system. Histologies were graded based on their tubular epithelial, glomerular and vascular alterations according to modified Banff classification criteria19. For a detailed description of the histology scoring procedure, please see the Supplemental Materials. Injury and aggregate injury scores were expressed as median and ranges.
Quantification of high-energy phosphate metabolites in kidney tissues
An average of 600 mg kidney tissue was homogenized in a mortar grinder over liquid nitrogen and extracted with 6 mL ice-cold PCA (12%) as described previously20. Lyophilisates were re-dissolved in 0.5 ml water and adjusted to pH 6.5. An Agilent series 1100 HPLC (Agilent Technologies, Santa Clara, CA) coupled to an ABI Sciex API4000 triple stage quadrupole mass spectrometer (ABI Sciex, Foster City, CA) equipped with an electrospray ionization (ESI) source was employed for quantitation of nucleotide mono-, di-, triphosphates21.
Quantification of cyclosporine in blood and kidney tissues
CsA was quantified using a validated online extraction HPLC-MS/MS assay22. Briefly, whole blood samples (500 μL) were collected in heparinized tubes. Flash-frozen renal tissue (100 to 200 mg) was mortared in liquid nitrogen and was homogenized with 2 mL KH2PO4 buffer (pH 7.4). For protein precipitation, 800 μL methanol and 0.2 mmol/L ZnSO4 (80/20, v/v) were added to 200 μL of tissue homogenate or blood. Cyclosporin D (250 μg/L, Novartis Pharma AG, Basel, Switzerland) was added as an internal standard for CsA22. After centrifugation (13,000g, 5 min, 4°C), 100 μL of the supernatant was injected onto the extraction column of the LC-MS/MS system and analyzed as described in22.
Sample preparation for 2D-gel electrophoresis and proteomics analysis
Freeze clamped kidneys (approximately 100 mg) were manually homogenized using a mortar and pestle over liquid nitrogen and lysed in 1 mL of chaotropic lysis buffer (7M urea, 2M thiourea, 4% CHAPS, 50 mM DTT, 0.2% carrier ampholytes, 1% protease inhibitor mix). Cells in extracts were lysed on ice for 20 minutes then centrifuged at 100,000 × g for 1 h at 4°C. To determine protein concentrations in the supernatants, a modified Bradford Assay Quick Start (BioRad Laboratories, Hercules, CA) was carried out according to the manufacturer’s protocol23.
Proteomics analysis
A detailed description of the proteomics and mass spectrometry methods is available in the Supplementary Material.
Western blot analysis
Western blot analysis was carried out to verify the proteomics results including the protein identification and quantitation. Aliquots of frozen extracts were thawed and loaded onto a 10% polyacrylamide gel. Proteins were separated using a Thermo EC 135-90 chamber (Thermo Scientific, San Jose, CA) operating for 2h at 60mA and were then transferred (300 mA, 2h) from the gel to an Immobilon-P membrane.
Antibodies used in this study included: oxoglutarate dehydrogenase, NADH-ubiquinone dehydrogenase, fructose-1,6-bisphosphatase (Santa Cruz Biotechnology, Santa Cruz, CA); isocitrate dehydrogenase, succinate dehydrogenase complex subunit A, ATP synthase beta, CD147, aquaporin 1 (Abcam, Cambridge, MA); JAK2, phospho-JAK2, STAT3, phospho-STAT3, Akt/ phospho-Akt, phospho-IKKγ, phospho-NF-κB p65 (Cell Signaling, Boston, MA); and superoxide dismutase (Lab Frontier, Seoul, Korea). After incubation with secondary antibody, membranes were subsequently treated with Pierce SuperSignal West Pico Solution (Pierce, Rockford, IL) following the manufacturer’s protocol. An UVP BioImaging System (BioImaging Systems, Upland, CA) was used to detect the horseradish peroxidase reaction on the membrane. Densitometry data were normalized to β-actin in each sample.
1H-NMR-based metabolic profiling in urine
1H NMR urine analysis was performed using a Varian INOVA NMR 600MHz spectrometer equipped with 5-mm HCN PFG probe. Rat urine (550 μL) was buffered with 73 μL 0.2M potassium phosphate buffer in D2O prior to analysis by NMR spectroscopy. The pH was adjusted to 5.65-5.75 with NaOD and DCl. The external standard compound TMSP (trimethylsilyl propionic-2,2,3,3-d4 acid dissolved in D2O to 50 mM in a thin sealed glass capillary) was inserted into the NMR tube. A standard Varian pre-saturation sequence was used to suppress water in urine. 1H-NMR spectra were obtained at 600 MHz using a spectral width of 7200 Hz and 32K data arrays, and 64 scans with 90° flip angle applied every 14.8 s to allow for full relaxation. Data analysis was performed using MesTrec software version 4.4.1.0 (MesTreLab Research, Spain). To compensate for differences in urine dilution, all spectra were normalized to the total signal intensity. The integral of each individual metabolite was divided by the total integral of the corresponding urine spectrum. Data is presented as % change in comparison to the control group. Prior to quantitative 1H-NMR analysis 1H/13C-HSQC experiments had been carried out to verify the integrated signals and metabolite changes.
Statistical analysis
All numerical data are presented as mean±standard deviation. One-way analysis of variance (ANOVA) followed by Tukey post hoc analysis was used to determine differences among groups. Significance level was set at p<0.05 for all tests. Software used included: SigmaPlot (version 11.0)/ SigmaStat (version 4, both from Systat Software, Point Richmond, CA); and SPSS (version 20.0, IBM/SPSS, Chicago, IL).
RESULTS
Histologies
Blinded histological analysis based on the modified Banff criteria revealed the following mean toxicity grades (Supplemental Figure 1A).
Normal-fed control group
median aggregate score: 0/ range 0. No histological alterations were observed (Figure 1B).
Figure 1.
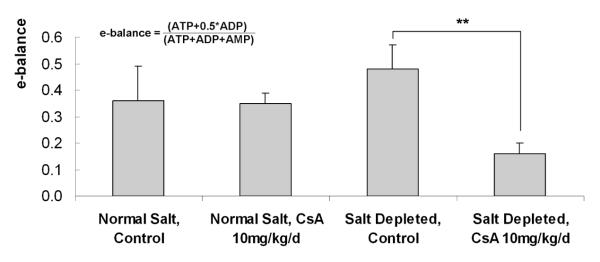
Changes in the energy balance as determined by HPLC/MS in the different treatment groups (all values are means ± standard deviations), n=4/group. * significant compared to untreated controls using ANOVA in combination with post-hoc pairwise multiple comparison (Holm-Sidak method).
Normal-fed CsA 10 mg/kg/day group
median 2.5/ range (2-4). Histological injury included tubular cell vacuolization (median 1.5 of a maximum score of 3) and tubular atrophy (1.0 of 3.0) (Supplemental Figure 1C).
Salt-depleted control group
median 0/ range 0. No histological damage could be detected (Supplemental Figure 1D).
Salt-depleted CsA 10 mg/kg-day group
median 9/ range (6-12). As expected based on the literature, combination of a salt-restricted diet and CsA resulted in the most extensive histological injuries among the study groups, mainly tubular atrophy (median of 3/maximum score of 3) and interstitial fibrosis (2/3) (Supplemental Figures 1E and 1F). Also, a slight arteriolar hyalinisation (0/3) and morphologic alterations of glomerular damage like glomerular sclerosis (1/3) and mesangial matrix expansion (1/3) were found (Supplemental Figures 1E and 1F).
CsA tissue concentrations and serum chemistry
CsA kidney tissue concentrations were higher in the salt-depleted rats as compared to the CsA-treated rats on a normal-salt diet (Table 1). A statistically significant increase of serum creatinine and blood urea nitrogen (BUN) concentrations was observed after CsA treatment in both rat groups (Table 1).
Table 1.
Cyclosporine (CsA) tissue concentrations, serum creatinine and blood urea nitrogen levels (BUN). All values are means ± standard deviations, n=4/group. Significance levels as estimated based on the post-hoc pairwise multiple comparison Holm-Sidak method).
| CsA tissue concentration [ng/mgtissue] |
serum creatinine [mg/dL] |
BUN [mg/dL] |
|
|---|---|---|---|
| Normal-salt, Controls | - | 0.47 ± 0.06 | 19.7 ± 2.3 |
| Normal-salt, CsA 10mg/kg/d | 17.7 ± 3.3 | 0.70 ± 0.12* | 34.4 ± 6.3* |
| Low-salt, Controls | - | 0.54 ± 0.11 | 23.8 ± 5.2 |
| Low-salt, CsA 10mg/kg/d | 31.7± 3.3* | 1.16 ± 0.23* | 40.6 ± 8.4* |
p<0.05
Kidney high-energy phosphate concentrations17, 20
The differences in the energy balance amongst the study groups are presented in Figure 1. A significant decrease in the kidneys’ energy balance was observed after treatment of rats with 10 mg/kg/day CsA while on the low-salt diet (Figure 1). Although there was also a slight decrease in the normal-fed group exposed to CsA (as compared to the normal-fed control), these changes did not reach statistical significance. Interestingly, a higher energy charge was found in the kidneys of control rats on low-salt as compared to those on normal-salt diet.
Protein analysis (Supplemental Table 2)
Metabolic enzymes. Mitochondrial function: TCA cycle activity and oxidative phosphorylation
Kidneys of rats fed a low-salt diet exhibited significantly higher levels of mitochondrial TCA cycle enzymes: isocitrate-, oxoglutarate- and succinate dehydrogenase as compared to those on normal-salt diet (Supplemental Figure 2). Also, while on low-salt diet, rats overexpressed the respiratory chain enzymes ATP synthase-beta (Supplemental Figure 2). This may be responsible for their increased energy charge (Figure 1).
In contrast, treatment of rats on low-salt diet with CsA reduced expression of isocitrate-, oxoglutarate- and succinate dehydrogenase, as well as the expression of ATP synthase-beta and NADH ubiquinone oxidoreductase (NDUFS1) (Supplemental Figure 2).
Gluconeogenesis and glycolysis
In the cytosol, low-salt diet decreased fructose-1,6-bisphosphatase (gluconeogenesis enzyme, Supplemental Table 1, Figure 2). CsA treatment further reduced its expression in rats in both diet groups. In addition to inhibiting gluconeogenesis, CsA also strongly inhibited glycolysis, repressing several of its enzymes such as alpha-enolase, phosphoglycerate mutase and lactate dehydrogenase (Supplemental Table 2).
Figure 2.

Western blot analysis of glucose metabolism (gluconeogenesis and glycolysis) regulating enzymes (A) fructose-1,6-bisphosphatase (FBP), (B) CD147, (C) phospho-AKT and NF-κB signaling intermediates (D) phospho-IKKγ and (E) phospho-NF-κB p65 proteins.
All values are means ± standard deviations, n=3/group. Significance levels estimated based on ANOVA in combination with post-hoc pairwise multiple comparison Holm-Sidak test: *: p<0.05; **: p<0.005; ***: p<0.001.
Interestingly, CsA also inhibited the expression of cluster of differentiation 147 (CD147) protein (Figure 2), a known regulator of monocarboxylate and lactate transporters24. Since glycolysis and CD147 are closely related with AKT signaling24, we investigated if CsA had any effects on Akt signaling. While CsA did not change expression of pAKT in the kidneys of normal-fed rats, salt depletion alone reduced expression of pAKT more than 5-fold as compared to the normal-salt controls. CsA decreased pAKT expression even further (Figure 2).
In addition to its interaction with AKT25, CD147 is also involved in the regulation of NF-κB signaling26. Thus we performed Western blot analysis of IKKγ and NF-κB p65 proteins. The phosphorylated forms of IKKγ and NF-κB p65 were significantly reduced only in the low-salt fed rats treated with CsA, indicating greater NF-κB activation under these conditions (Figure 2). No changes were detected in normal-salt fed CsA treated rats (Figure 2).
Ion transport
As anticipated, reduced dietary salt intake impacted the expression of several ion transporters in the kidney, including the chloride intracellular channel protein 1 (CLIC1). CLIC1 expression was slightly lower in the rats on low-salt diet than in kidneys of normal-fed rats. Interestingly, CsA induced CLIC1 expression in both, the low-salt and normal-fed rats (Figure 3). In contrast, the expressions of PDZ domain-containing protein in the kidney 1 (PDZK1) and aquaporin 1 slightly increased in the kidneys of rats fed the low-salt diet, but significantly decreased when these were treated with CsA (Figure 3).
Figure 3.

Western blot analysis of ion transporters (A) chloride intracellular channel protein 1 (CLIC1), (B) PDZ domain-containing protein in the kidney 1 (PDZK1) and (C) aquaporin 1.
All values are means ± standard deviations, n=3/group. Significance levels estimated based on ANOVA in combination with post-hoc pairwise multiple comparison Holm-Sidak test: *: p<0.05; **: p<0.005; ***: p<0.001.
Oxidative stress
CsA treatment in combination with low-salt diet affected expression of antioxidant proteins of the peroxiredoxin family. Interestingly, there seemed to be a differential regulation of these proteins, since expression of peroxiredoxin 6 decreased and peroxiredoxin 2 increased (Supplemental Table 2). In addition, the expression of mitochondrial superoxide dismutase 2 (SOD2), a superoxide detoxifying enzyme, was reduced as well (Figure 4).
Figure 4.

Western blot analysis of proteins involved in the defense against oxidative stress: (A) superoxide dismutase 2 (SOD2), (B) phospho-JAK2 and (C) phospho-STAT3 proteins. All values are means ± standard deviations, n=3/group. Significance levels estimated based on ANOVA in combination with post-hoc pairwise multiple comparison Holm-Sidak test: *: p<0.05; **: p<0.005; ***: p<0.001.
JAK2/STAT3 proteins
Our results showed that the kidneys of normal-fed rats treated with CsA did not show significant changes in the expression of phospho-JAK2 and phospho-STAT3 proteins (Figure 4). However, when rats were fed a low-salt diet, the expression of these two proteins that are implicated in protection of renal cells from reactive oxygen species (ROS)27 significantly increased (Figure 4). This is of interest since we recently showed that oxidative stress plays a key role in CsA nephrotoxicity in normal-fed rats11.
Metabolic profiling
A principal component (PC) analysis of urinary metabolite patterns revealed separation of all study groups (Supplemental Figure 3A). The separation of the CsA groups from their respective controls was based on PC1 and explained 52% of cumulative variance. The clustering in PC1 was mainly influenced by the spectral regions containing the signals for acetate, taurine, creatinine, lactate and 2-oxoglutarate as evident from the loadings plot in Supplemental Figure 3. Despite the increased expression of isocitrate-, succinate- and oxoglutarate dehydrogenase enzymes in the kidneys of low-salt fed control animals, the concentrations of corresponding Krebs cycle intermediates excreted in urine were significantly lower than those in urine of normal-fed controls. A similar observation was also made for the glycolysis product lactate, which despite the reduced expression of glycolytical enzymes in the kidney, was excreted in a higher amount in urine of low-salt fed control. In CsA-treated animals, concentrations of glycolysis product lactate as well as Krebs cycle metabolites succinate, citrate and 2-oxoglutarate were decreased (Supplemental Figure 3B).
DISCUSSION
CNIs are major immunosuppressive agents used in transplantation. Their use however is complicated by renal and vascular toxicity. In our previous studies11, 16, we showed that after 27 days, rats treated with CsA while on normal diet exhibited detectable impairment of renal function (as demonstrated by a significant reduction of glomerular filtration rates) and histomorphologic alterations (tubular vacuolization, tubular epithelial damage) that are considered typical for CsA toxicity. These results confirmed that we were able to create an animal model for CNI nephrotoxicity based on normal fed rats with drug blood concentrations within the therapeutic target range in transplant patients. However, the majority of the published studies assessing immunosuppressant nephrotoxicity are based on the salt-depleted rat model13, 14, 28, in which the rats undergo renal injury faster than rats on normal-salt diet and show morphological and pathological changes similar to those occurring in renal transplant patients. But, as aforementioned, surprisingly little is known about the molecular mechanisms underlying the enhancement of immunosuppressant nephrotoxicity caused by a low-salt diet. The investigation of molecular mechanisms underlying the effects of salt depletion on the rat kidney in absence and presence of CsA, were the main aims of the present study.
In our study, rats in normal-fed and salt-depleted control groups showed no changes in kidney histology, whereas treatment with CsA led to histological changes mainly focused on the tubules. The highest toxicity scores, as expected, were found in CsA-treated rats on low-salt diet. Here, the tubular cell morphology and architectural structure of the kidney cortex were markedly affected. Besides tubular epithelial atrophy and vacuolization, glomerulopathy including glomerulosclerosis and mesangial matrix expansion were found. This was in accordance with previously published observations12, 28-30.
Interestingly, CsA kidney tissue concentrations were significantly increased in salt-depleted rats as compared to those on normal diet. This is in analogy with previously published results31, and could possibly be responsible for the enhanced negative effects of CsA on the kidney of low-salt fed rats.
CsA treatment decreased the kidney’s energy charge, especially in animals on low-salt diet. This supports our previous work, which showed that CsA decreases the energy production in brain cells and slices32, 33, as well as in the kidney34, 35. The more pronounced break-down of energy production observed in animals on low-salt as compared to those on normal-salt diet may at least partly be explained by their increased CsA tissue concentrations.
Energy production: Krebs cycle and glycolysis
The majority of proteins differently expressed in normal-fed and low-salt control rats were of mitochondrial origin, namely oxidative phosphorylation and fatty acid β-oxidation. Interestingly, most of these were upregulated as a consequence of the low-salt diet. This clearly suggested that the rats on low-salt diet have an increased energy demand, possibly while trying to retain normal osmolarity within the cells. With our previous studies showing that CsA mainly targets mitochondrial energy metabolism36, this shift in energy production may be the reason why the kidneys of salt-depleted rats are more vulnerable to CsA than those of normal-fed animals.
Based on the expression levels of glycolytical enzymes, it seems that normal-salt-fed rats exposed to CsA upregulate their glycolysis to compensate for the disruption of mitochondrial energy production, something we have previously observed in rat brain slices and neuronal cells8, 37-40. Interestingly, the activity of Akt41, 42 appeared to be connected to this metabolic change, with its phosphorylated form slightly increased in kidneys of rats fed a normal-salt diet. In low-salt fed rats, however, glycolysis and the phospho-Akt expression were already downregulated and underwent a further downregulation by CsA.
Changes in metabolic profiles
The approach for the analysis of proton NMR data used in this study was similar to various previously published NMR studies based on urine and focusing on changes in the metabolic profile as a result of nephrotoxicity43-47. In various animal studies, proximal tubular injury was associated with increased urine concentrations of acetate, lactate, glucose, amino acids and decreased concentrations of hippurate, creatinine, 2-oxoglutarate (2-OG), succinate and citrate. Changes in urine metabolite patterns observed after 28 days of treatment with CsA in the normal salt diet matched those described for nephrotoxins causing tubular injury43, 48. This corresponds to the histology results that also showed specific tubular damage.
Surprisingly, although no histological damage was detected the metabolic pattern of the low salt diet control group differed significantly from the normal salt treated control group. For several metabolites, the trend for the change in the metabolic pattern from normal salt to the low salt treated animals was analogue to the changes observed after CsA treatment. This was the case for acetate, citrate, succinate and 2-OG. Combination with CsA exposure elevated the concentration of acetate even higher and reduced the concentrations of citrate, succinate and 2-OG lower. The amplification of the effects of CsA by low salt diet was best reflected by this set of metabolites. Serum creatinine concentrations were similar in rats fed normal and low salt diets. The creatinine urine concentrations were higher in rats fed low salt than those fed normal salt diet. In both cases CsA treatment resulted in low urine creatinine and relatively high serum creatinine concentrations indicating reduced glomerular filtration rates after CsA treatment but not due to low salt diet alone.
CD147/NF-κB signaling
CD147 is another glycolysis regulator57, functioning through its binding to cyclophilins and FKBPs58. Downstream of the cyclophilin/CD147 complex, CD147 regulates the expression of monocarboxylate/ lactate transporters (MCT)59. CsA’s ability to decrease the CD147 expression, especially in the low-salt fed animals, may be responsible for the down-regulation of MCT transporter proteins and the observed decrease in lactate transport.
Mechanistically, CD147 is also involved in the activation of NF-κB signaling60, which itself is regulating inflammatory and proliferative responses. Therefore it was not surprising that CsA-induced downregulation of CD147 was accompanied by a decrease of activated phospho forms of IKKγ and p65 proteins. IKKγ interacts with and regulates IKKβ, an inhibitor unit of NF-κB. It is possible that the downregulation of CD147 leading to a decrease of active phospho-IKKγ is responsible for the observed activation of NF-κB signaling after CsA treatment61. Low-salt diet again aggravated the effects of CsA on this pathway. Interestingly, a recent publication investigating the role of IKKγ in human heart showed that IKKγ-depleted cardiomyocytes are more susceptible to stress conditions and are more likely to succumb to cell death62. The ability of CsA to regulate the IKKγ/NF-κB pathway is possibly one of the pathways through which CsA mediates its negative effects on the kidney and the vascular system.
Ion transport: PDZK1 and CLIC1
In our previous work, we have examined the effects of osmotic stress on renal cells, and have shown that the inner medullary collecting duct cells adapt to the impact of high tonicity by increasing the number of mitochondria and their metabolic activity63. This is necessary to maintain the chloride-dependent expression of Na/K-ATPase gamma subunit and sustain the cellular cation balance over the plasma membrane in a hypertonic environment64. A similar mechanism could also be relevant in the kidney of rats fed a low-salt diet, where the increased high-energy demand could be a consequence of the changes in membrane transporter activities necessary to maintain normal osmolarity within the cells.
In the animals on low-salt diet, expression of CLIC1 was downregulated. Since CLIC1 transports chloride across the apical membrane of renal proximal tubulus cells65, its downregulation may reflect adaptation in response to a low chloride environment. Interestingly, CsA treatment increased the expression of CLIC1, however its levels in the CsA-treated rats on low-salt diet were not significantly different from the normal-salt controls. Given its role as a sensor and an effector of oxidative stress66, its upregulation by CsA might be related to CsA’s ability to induce oxidative stress in the kidney11, 37, 63. In contrast, two other ion transporters were identified as markedly upregulated in the low-salt versus normal-salt controls: the PDZK1 protein and aquaporin 1. PDKZ1 is a major scaffolder in brush borders of proximal tubular cells, where it functions as a regulatory cofactor of sodium–hydrogen exchanger 1-3 (NHE-3)67 and Npt2a68. Aquaporin 1 transports solute-free water across cell membranes and plays a major role in concentrating the urine in the kidney69. Interestingly, PDZK1 knock-out mice are known to significantly decrease the expression of aquaporin 1 as compared to their wild-type counterparts70. Thus, there seems to be a connection between these transporters, both of which are again upregulated in kidneys of animals on low-salt diet. However, when treated with CsA, as previously described71, the reduced expression of both indicated an impaired ability of the rats to concentrate urine. This represents another potential mechanistic explanation why CsA effects are more pronounced in rats on low-salt diet and why the injury is focused mostly on the proximal tubule.
JAK/STAT pathway
The primary molecular targets of CsA, the cyclophilins were recently shown to affect JAK2 and STAT3 activation and function72. It has been suggested that the JAK2/STAT3 pathway is involved in CsA-induced endothelial and renal toxicity27. Also, it was suggested that JAK/STAT signaling may be linked to the mitochondrial permeability transition pore73, which in turn is known to be inhibited by CsA and its interaction with intra-mitochondrial cyclophilin D74. Interestingly, the kidneys of rats fed a low-salt diet had significantly lower levels of phospho-STAT3. However, exposure to CsA led to an increase of phosphorylated JAK2 and STAT3, suggesting a key role for JAK2 inhibition in acute kidney injury and CsA-induced nephrotoxicity.
In summary (Figure 5), kidney metabolism of rats fed a low-salt diet relied more on the mitochondrial than on glycolytical energy production. This decrease of glycolytic activity, as a consequence of salt depletion, was associated with upstream downregulation of CD147 protein and pAKT. Due to their higher dependence on the mitochondria, CsA more strongly affected the kidneys of rats fed a low-salt diet. In addition, their kidneys were also less capable of compensating for the reduction of mitochondrial high-energy phosphates via glycolysis. The increased oxidative stress and dysregulation of ion transporter activity may contribute to CsA-induced mitochondrial dysfunction. Overall, our study has provided several novel mechanistic explanations on why rats fed a low-salt diet are more susceptible to renal injury mediated by CsA.
Figure 5.

Summary of low-salt diet induced changes in the rat kidney and the effects of cyclosporine.
(A) While on low-salt diet, animals “redirected” their energy production to the mitochondria away from glycolysis probably at least partially due to a negative effect on AKT. The higher energy demand is associated with a change in the expression of ion transporter proteins CLIC1 and PDZK1 (no cause-effect relationship was established), which are necessary for the maintenance of a normal intracellular kidney salt concentration.
(B) Cyclosporine targeted the mitochondria and induced oxidative stress. The major pathways involved were the regulation of CD147 and IKKγ proteins (involved in NF-κB signaling), Akt and JAK2/STAT3 proteins.
Supplementary Material
Acknowledgements
The study was supported by the United States National Institutes of Health grants R01 DK065094 and P30 DK048520. The NMR experiments were performed at the University of Colorado NMR core facility, funded by the University of Colorado Cancer Center.
Footnotes
Disclosure The authors have no financial interests to disclose.
Supporting Information Available: This material is available free of charge via the Internet at http://pubs.acs.org.”
REFERENCES
- 1.Campistol JM, Grinyo JM. Exploring treatment options in renal transplantation: the problems of chronic allograft dysfunction and drug-related nephrotoxicity. Transplantation. 2001;71(11 Suppl):SS42–51. [PubMed] [Google Scholar]
- 2.Womer KL, Kaplan B. Recent developments in kidney transplantation--a critical assessment. Am J Transplant. 2009;9(6):1265–71. doi: 10.1111/j.1600-6143.2009.02639.x. [DOI] [PMC free article] [PubMed] [Google Scholar]
- 3.Kahan BD. Potential therapeutic interventions to avoid or treat chronic allograft dysfunction. Transplantation. 2001;71(11 Suppl):SS52–7. [PubMed] [Google Scholar]
- 4.Nankivell BJ, Chapman JR. Chronic allograft nephropathy: current concepts and future directions. Transplantation. 2006;81(5):643–54. doi: 10.1097/01.tp.0000190423.82154.01. [DOI] [PubMed] [Google Scholar]
- 5.Gummert JF, Ikonen T, Morris RE. Newer immunosuppressive drugs: a review. J Am Soc Nephrol. 1999;10(6):1366–80. doi: 10.1681/ASN.V1061366. [DOI] [PubMed] [Google Scholar]
- 6.Halloran PF. Immunosuppressive drugs for kidney transplantation. N Engl J Med. 2004;351(26):2715–29. doi: 10.1056/NEJMra033540. [DOI] [PubMed] [Google Scholar]
- 7.Racusen LC, Solez K. Cyclosporine nephrotoxicity. Int Rev Exp Pathol. 1988;30:107–57. doi: 10.1016/b978-0-12-364930-0.50007-5. [DOI] [PubMed] [Google Scholar]
- 8.Christians U, Gottschalk S, Miljus J, Hainz C, Benet LZ, Leibfritz D, Serkova N. Alterations in glucose metabolism by cyclosporine in rat brain slices link to oxidative stress: interactions with mTOR inhibitors. Br J Pharmacol. 2004;143(3):388–96. doi: 10.1038/sj.bjp.0705939. [DOI] [PMC free article] [PubMed] [Google Scholar]
- 9.Trapp A, Weis M. The impact of immunosuppression on endothelial function. J Cardiovasc Pharmacol. 2005;45(1):81. doi: 10.1097/00005344-200501000-00014. [DOI] [PubMed] [Google Scholar]
- 10.Gardiner SM, March JE, Kemp PA, Fallgren B, Bennett T. Regional haemodynamic effects of cyclosporine A, tacrolimus and sirolimus in conscious rats. Br J Pharmacol. 2004;141(4):634–43. doi: 10.1038/sj.bjp.0705659. [DOI] [PMC free article] [PubMed] [Google Scholar]
- 11.Klawitter J, Klawitter J, Kushner E, Jonscher K, Bendrick-Peart J, Leibfritz D, Christians U, Schmitz V. Association of immunosuppressant-induced protein changes in the rat kidney with changes in urine metabolite patterns: a proteo-metabonomic study. J Proteome Res. 2010;9(2):865–75. doi: 10.1021/pr900761m. [DOI] [PMC free article] [PubMed] [Google Scholar]
- 12.Andoh TF, Burdmann EA, Fransechini N, Houghton DC, Bennett WM. Comparison of acute rapamycin nephrotoxicity with cyclosporine and FK506. Kidney Int. 1996;50(4):1110–7. doi: 10.1038/ki.1996.417. [DOI] [PubMed] [Google Scholar]
- 13.Shihab FS, Bennett WM, Yi H, Choi SO, Andoh TF. Sirolimus increases transforming growth factor-beta1 expression and potentiates chronic cyclosporine nephrotoxicity. Kidney Int. 2004;65(4):1262–71. doi: 10.1111/j.1523-1755.2004.00498.x. [DOI] [PubMed] [Google Scholar]
- 14.Shihab FS, Bennett WM, Yi H, Andoh TF. Effect of cyclosporine and sirolimus on the expression of connective tissue growth factor in rat experimental chronic nephrotoxicity. Am J Nephrol. 2006;26(4):400–7. doi: 10.1159/000095300. [DOI] [PubMed] [Google Scholar]
- 15.Klawitter J, Bendrick-Peart J, Rudolph B, Beckey V, Klawitter J, Haschke M, Rivard C, Chan L, Leibfritz D, Christians U, Schmitz V. Urine Metabolites Reflect Time-Dependent Effects of Cyclosporine and Sirolimus on Rat Kidney Function. Chem Res Toxicol. 2008 doi: 10.1021/tx800253x. [DOI] [PMC free article] [PubMed] [Google Scholar]
- 16.Klawitter J, Bendrick-Peart J, Rudolph B, Beckey V, Klawitter J, Haschke M, Rivard C, Chan L, Leibfritz D, Christians U, Schmitz V. Urine metabolites reflect time-dependent effects of cyclosporine and sirolimus on rat kidney function. Chem Res Toxicol. 2009;22(1):118–28. doi: 10.1021/tx800253x. [DOI] [PMC free article] [PubMed] [Google Scholar]
- 17.Schmitz V, Klawitter J, Bendrick-Peart J, Haschke M, Beckey VE, Laudi S, Neumann U, Schoening W, Neuhaus P, Christians U, Puhl G. Impact of organ preservation using HTK for graft flush and subsequent storage in UW in rat kidney transplantation. Eur Surg Res. 2006;38(4):388–98. doi: 10.1159/000094600. [DOI] [PubMed] [Google Scholar]
- 18.Schmitz V, Klawitter J, Bendrick-Peart J, Schoening W, Puhl G, Haschke M, Consoer J, Rivard CJ, Chan L, Tran ZV, Leibfritz D, Christians U. Metabolic profiles in urine reflect nephrotoxicity of sirolimus and cyclosporine following rat kidney transplantation. Nephron Exp Nephrol. 2009;111(4):e80–91. doi: 10.1159/000209208. [DOI] [PubMed] [Google Scholar]
- 19.Racusen LC, Solez K, Colvin RB, Bonsib SM, Castro MC, Cavallo T, Croker BP, Demetris AJ, Drachenberg CB, Fogo AB, Furness P, Gaber LW, Gibson IW, Glotz D, Goldberg JC, Grande J, Halloran PF, Hansen HE, Hartley B, Hayry PJ, Hill CM, Hoffman EO, Hunsicker LG, Lindblad AS, Yamaguchi Y, et al. The Banff 97 working classification of renal allograft pathology. Kidney Int. 1999;55(2):713–23. doi: 10.1046/j.1523-1755.1999.00299.x. [DOI] [PubMed] [Google Scholar]
- 20.Klawitter J, Schmitz V, Klawitter J, Leibfritz D, Christians U. Development and validation of an assay for the quantification of 11 nucleotides using LC/LC-electrospray ionization-MS. Anal Biochem. 2007;365(2):230–9. doi: 10.1016/j.ab.2007.03.018. [DOI] [PubMed] [Google Scholar]
- 21.Klawitter J, Zhang YL, Klawitter J, Anderson N, Serkova NJ, Christians U. Development and validation of a sensitive assay for the quantification of imatinib using LC/LC-MS/MS in human whole blood and cell culture. Biomed Chromatogr. 2009;23(12):1251–8. doi: 10.1002/bmc.1247. [DOI] [PMC free article] [PubMed] [Google Scholar]
- 22.Christians U, Jacobsen W, Serkova N, Benet LZ, Vidal C, Sewing KF, Manns MP, Kirchner GI. Automated, fast and sensitive quantification of drugs in blood by liquid chromatography mass spectrometry with on-line extraction: immunosuppressants. J Chromatogr B Biomed Sci Appl. 2000;748(1):41–53. doi: 10.1016/s0378-4347(00)00380-7. [DOI] [PubMed] [Google Scholar]
- 23.Thermo Scientific P. Pierce BCA Protein Assay Kit. Instructions Manual [Google Scholar]
- 24.Kirk P, Wilson MC, Heddle C, Brown MH, Barclay AN, Halestrap AP. CD147 is tightly associated with lactate transporters MCT1 and MCT4 and facilitates their cell surface expression. Embo J. 2000;19(15):3896–904. doi: 10.1093/emboj/19.15.3896. [DOI] [PMC free article] [PubMed] [Google Scholar]
- 25.Tang Y, Nakada MT, Rafferty P, Laraio J, McCabe FL, Millar H, Cunningham M, Snyder LA, Bugelski P, Yan L. Regulation of vascular endothelial growth factor expression by EMMPRIN via the PI3K-Akt signaling pathway. Mol Cancer Res. 2006;4(6):371–7. doi: 10.1158/1541-7786.MCR-06-0042. [DOI] [PubMed] [Google Scholar]
- 26.Yang Y, Lu N, Zhou J, Chen ZN, Zhu P. Cyclophilin A up-regulates MMP-9 expression and adhesion of monocytes/macrophages via CD147 signalling pathway in rheumatoid arthritis. Rheumatology (Oxford) 2008;47(9):1299–310. doi: 10.1093/rheumatology/ken225. [DOI] [PMC free article] [PubMed] [Google Scholar]
- 27.Neria F, Castilla MA, Sanchez RF, Gonzalez Pacheco FR, Deudero JJ, Calabia O, Tejedor A, Manzarbeitia F, Ortiz A, Caramelo C. Inhibition of JAK2 protects renal endothelial and epithelial cells from oxidative stress and cyclosporin A toxicity. Kidney Int. 2009;75(2):227–34. doi: 10.1038/ki.2008.487. [DOI] [PubMed] [Google Scholar]
- 28.Andoh TF, Lindsley J, Franceschini N, Bennett WM. Synergistic effects of cyclosporine and rapamycin in a chronic nephrotoxicity model. Transplantation. 1996;62(3):311–6. doi: 10.1097/00007890-199608150-00002. [DOI] [PubMed] [Google Scholar]
- 29.Lloberas N, Torras J, Alperovich G, Cruzado JM, Gimenez-Bonafe P, Herrero-Fresneda I, Franquesa M, Rama I, Grinyo JM. Different renal toxicity profiles in the association of cyclosporine and tacrolimus with sirolimus in rats. Nephrol Dial Transplant. 2008;23(10):3111–9. doi: 10.1093/ndt/gfn223. [DOI] [PubMed] [Google Scholar]
- 30.Andoh TF, Burdmann EA, Lindsley J, Houghton DC, Bennett WM. Enhancement of FK506 nephrotoxicity by sodium depletion in an experimental rat model. Transplantation. 1994;57(4):483–9. [PubMed] [Google Scholar]
- 31.Gardner MP, Houghton DC, Andoh TF, Lindsley J, Bennett WM. Clinically relevant doses and blood levels produce experimental cyclosporine nephrotoxicity when combined with nitric oxide inhibition. Transplantation. 1996;61(10):1506–12. doi: 10.1097/00007890-199605270-00017. [DOI] [PubMed] [Google Scholar]
- 32.Serkova N, Brand A, Christians U, Leibfritz D. Evaluation of the effects of immunosuppressants on neuronal and glial cells in vitro by multinuclear magnetic resonance spectroscopy. Biochim Biophys Acta. 1996;1314(1-2):93–104. doi: 10.1016/s0167-4889(96)00081-x. [DOI] [PubMed] [Google Scholar]
- 33.Serkova N, Litt L, Leibfritz D, Hausen B, Morris RE, James TL, Benet LZ, Christians U. The novel immunosuppressant SDZ-RAD protects rat brain slices from cyclosporine-induced reduction of high-energy phosphates. Br J Pharmacol. 2000;129(3):485–92. doi: 10.1038/sj.bjp.0703079. [DOI] [PMC free article] [PubMed] [Google Scholar]
- 34.Massicot F, Martin C, Dutertre-Catella H, Ellouk-Achard S, Pham-Huy C, Thevenin M, Rucay P, Warnet JM, Claude JR. Modulation of energy status and cytotoxicity induced by FK506 and cyclosporin A in a renal epithelial cell line. Arch Toxicol. 1997;71(8):529–31. doi: 10.1007/s002040050423. [DOI] [PubMed] [Google Scholar]
- 35.Serkova N, Klawitter J, Niemann CU. Organ-specific response to inhibition of mitochondrial metabolism by cyclosporine in the rat. Transpl Int. 2003;16(10):748–55. doi: 10.1007/s00147-003-0631-1. [DOI] [PubMed] [Google Scholar]
- 36.Christians U, Klawitter J, Klawitter J, Brunner N, Schmitz V. Biomarkers of immunosuppressant organ toxicity after transplantation- status, concepts and misconceptions. Expert Opin Drug Metabol Toxicol. 2011 doi: 10.1517/17425255.2011.544249. [DOI] [PMC free article] [PubMed] [Google Scholar]
- 37.Klawitter J, Gottschalk S, Hainz C, Leibfritz D, Christians U, Serkova NJ. Immunosuppressant neurotoxicity in rat brain models: oxidative stress and cellular metabolism. Chem Res Toxicol. 23(3):608–19. doi: 10.1021/tx900351q. [DOI] [PMC free article] [PubMed] [Google Scholar]
- 38.Schmitz V, Klawitter J, Bendrick-Peart J, Schoening W, Puhl G, Haschke M, Klawitter J, Consoer J, Rivard CJ, Chan L, Tran ZV, Leibfritz D, Christians U. Metabolic profiles in urine reflect nephrotoxicity of sirolimus and cyclosporine following rat kidney transplantation. Nephron Exp Nephrol. 2009;111(4):e80–91. doi: 10.1159/000209208. [DOI] [PubMed] [Google Scholar]
- 39.Serkova N, Donohoe P, Gottschalk S, Hainz C, Niemann CU, Bickler PE, Litt L, Benet LZ, Leibfritz D, Christians U. Comparison of the effects of cyclosporin a on the metabolism of perfused rat brain slices during normoxia and hypoxia. J Cereb Blood Flow Metab. 2002;22(3):342–52. doi: 10.1097/00004647-200203000-00012. [DOI] [PubMed] [Google Scholar]
- 40.Serkova N, Jacobsen W, Niemann CU, Litt L, Benet LZ, Leibfritz D, Christians U. Sirolimus, but not the structurally related RAD (everolimus), enhances the negative effects of cyclosporine on mitochondrial metabolism in the rat brain. Br J Pharmacol. 2001;133(6):875–85. doi: 10.1038/sj.bjp.0704142. [DOI] [PMC free article] [PubMed] [Google Scholar]
- 41.Robey RB, Hay N. Is Akt the “Warburg kinase”?-Akt-energy metabolism interactions and oncogenesis. Semin Cancer Biol. 2009;19(1):25–31. doi: 10.1016/j.semcancer.2008.11.010. [DOI] [PMC free article] [PubMed] [Google Scholar]
- 42.Robey RB, Hay N. Mitochondrial hexokinases: guardians of the mitochondria. Cell Cycle. 2005;4(5):654–8. doi: 10.4161/cc.4.5.1678. [DOI] [PubMed] [Google Scholar]
- 43.Anthony ML, Beddell CR, Lindon JC, Nicholson JK. Studies on the comparative toxicity of S-(1,2-dichlorovinyl)-L-cysteine, S-(1,2-dichlorovinyl)-L-homocysteine and 1,1,2-trichloro-3,3,3-trifluoro-1-propene in the Fischer 344 rat. Arch Toxicol. 1994;69(2):99–110. doi: 10.1007/s002040050144. [DOI] [PubMed] [Google Scholar]
- 44.Bairaktari E, Katopodis K, Siamopoulos KC, Tsolas O. Paraquat-induced renal injury studied by 1H nuclear magnetic resonance spectroscopy of urine. Clin Chem. 1998;44(6 Pt 1):1256–61. [PubMed] [Google Scholar]
- 45.Gartland KP, Bonner FW, Timbrell JA, Nicholson JK. Biochemical characterisation of para-aminophenol-induced nephrotoxic lesions in the F344 rat. Arch Toxicol. 1989;63(2):97–106. doi: 10.1007/BF00316430. [DOI] [PubMed] [Google Scholar]
- 46.Neild GH, Foxall PJ, Lindon JC, Holmes EC, Nicholson JK. Uroscopy in the 21st century: high-field NMR spectroscopy. Nephrol Dial Transplant. 1997;12(3):404–17. doi: 10.1093/ndt/12.3.404. [DOI] [PubMed] [Google Scholar]
- 47.Shockcor JP, Holmes E. Metabonomic applications in toxicity screening and disease diagnosis. Curr Top Med Chem. 2002;2(1):35–51. doi: 10.2174/1568026023394498. [DOI] [PubMed] [Google Scholar]
- 48.Gartland KP, Bonner FW, Nicholson JK. Investigations into the biochemical effects of region-specific nephrotoxins. Mol Pharmacol. 1989;35(2):242–50. [PubMed] [Google Scholar]
- 49.Holmes E, Bonner FW, Nicholson JK. 1H NMR spectroscopic and histopathological studies on propyleneimine-induced renal papillary necrosis in the rat and the multimammate desert mouse (Mastomys natalensis) Comp Biochem Physiol C Pharmacol Toxicol Endocrinol. 1997;116(2):125–34. doi: 10.1016/s0742-8413(96)00146-6. [DOI] [PubMed] [Google Scholar]
- 50.Podadera P, Sipahi AM, Areas JA, Lanfer-Marquez UM. Diagnosis of suspected trimethylaminuria by NMR spectroscopy. Clin Chim Acta. 2005;351(1-2):149–54. doi: 10.1016/j.cccn.2004.09.006. [DOI] [PubMed] [Google Scholar]
- 51.Lang DH, Yeung CK, Peter RM, Ibarra C, Gasser R, Itagaki K, Philpot RM, Rettie AE. Isoform specificity of trimethylamine N-oxygenation by human flavin-containing monooxygenase (FMO) and P450 enzymes: selective catalysis by FMO3. Biochem Pharmacol. 1998;56(8):1005–12. doi: 10.1016/s0006-2952(98)00218-4. [DOI] [PubMed] [Google Scholar]
- 52.Foxall PJ, Mellotte GJ, Bending MR, Lindon JC, Nicholson JK. NMR spectroscopy as a novel approach to the monitoring of renal transplant function. Kidney Int. 1993;43(1):234–45. doi: 10.1038/ki.1993.37. [DOI] [PubMed] [Google Scholar]
- 53.Lenz EM, Bright J, Knight R, Wilson ID, Major H. Cyclosporin A-induced changes in endogenous metabolites in rat urine: a metabonomic investigation using high field 1H NMR spectroscopy, HPLC-TOF/MS and chemometrics. J Pharm Biomed Anal. 2004;35(3):599–608. doi: 10.1016/j.jpba.2004.02.013. [DOI] [PubMed] [Google Scholar]
- 54.Wright E. Transport of metabolic intermediates across renal membrane brush border membrane vesicles brane. Ann Rev Physiol. 1985;47:127–41. doi: 10.1146/annurev.ph.47.030185.001015. [DOI] [PubMed] [Google Scholar]
- 55.Mandel LJ. Metabolic substrates, cellular energy production, and the regulation of proximal tubular transport. Annu Rev Physiol. 1985;47:85–101. doi: 10.1146/annurev.ph.47.030185.000505. [DOI] [PubMed] [Google Scholar]
- 56.Burckhardt BC, Burckhardt G. Transport of organic anions across the basolateral membrane of proximal tubule cells. Rev Physiol Biochem Pharmacol. 2003;146:95–158. doi: 10.1007/s10254-002-0003-8. [DOI] [PubMed] [Google Scholar]
- 57.Tang Y, Kesavan P, Nakada MT, Yan L. Tumor-stroma interaction: positive feedback regulation of extracellular matrix metalloproteinase inducer (EMMPRIN) expression and matrix metalloproteinase-dependent generation of soluble EMMPRIN. Mol Cancer Res. 2004;2(2):73–80. [PubMed] [Google Scholar]
- 58.Yurchenko V, Constant S, Bukrinsky M. Dealing with the family: CD147 interactions with cyclophilins. Immunology. 2006;117(3):301–9. doi: 10.1111/j.1365-2567.2005.02316.x. [DOI] [PMC free article] [PubMed] [Google Scholar]
- 59.Pinheiro C, Reis RM, Ricardo S, Longatto-Filho A, Schmitt F, Baltazar F. Expression of monocarboxylate transporters 1, 2, and 4 in human tumours and their association with CD147 and CD44. J Biomed Biotechnol. 2010:427694. doi: 10.1155/2010/427694. [DOI] [PMC free article] [PubMed] [Google Scholar]
- 60.Schmidt R, Bultmann A, Fischel S, Gillitzer A, Cullen P, Walch A, Jost P, Ungerer M, Tolley ND, Lindemann S, Gawaz M, Schomig A, May AE. Extracellular matrix metalloproteinase inducer (CD147) is a novel receptor on platelets, activates platelets, and augments nuclear factor kappaB-dependent inflammation in monocytes. Circ Res. 2008;102(3):302–9. doi: 10.1161/CIRCRESAHA.107.157990. [DOI] [PubMed] [Google Scholar]
- 61.Buffoli B, Pechanova O, Kojsova S, Andriantsitohaina R, Giugno L, Bianchi R, Rezzani R. Provinol prevents CsA-induced nephrotoxicity by reducing reactive oxygen species, iNOS, and NF-kB expression. J Histochem Cytochem. 2005;53(12):1459–68. doi: 10.1369/jhc.5A6623.2005. [DOI] [PMC free article] [PubMed] [Google Scholar]
- 62.Kratsios P, Huth M, Temmerman L, Salimova E, Al Banchaabouchi M, Sgoifo A, Manghi M, Suzuki K, Rosenthal N, Mourkioti F. Antioxidant amelioration of dilated cardiomyopathy caused by conditional deletion of NEMO/IKKgamma in cardiomyocytes. Circ Res. 106(1):133–44. doi: 10.1161/CIRCRESAHA.109.202200. [DOI] [PubMed] [Google Scholar]
- 63.Klawitter J, Rivard CJ, Brown LM, Capasso JM, Almeida NE, Maunsbach AB, Pihakaski-Maunsbach K, Berl T, Leibfritz D, Christians U, Chan L. A metabonomic and proteomic analysis of changes in IMCD3 cells chronically adapted to hypertonicity. Nephron Physiol. 2008;109(1):p1–10. doi: 10.1159/000129074. [DOI] [PubMed] [Google Scholar]
- 64.Capasso JM, Rivard CJ, Enomoto LM, Berl T. Chloride, not sodium, stimulates expression of the gamma subunit of Na/K-ATPase and activates JNK in response to hypertonicity in mouse IMCD3 cells. Proc Natl Acad Sci U S A. 2003;100(11):6428–33. doi: 10.1073/pnas.1130871100. [DOI] [PMC free article] [PubMed] [Google Scholar]
- 65.Tulk BM, Edwards JC. NCC27, a homolog of intracellular Cl- channel p64, is expressed in brush border of renal proximal tubule. Am J Physiol. 1998;274(6 Pt 2):F1140–9. doi: 10.1152/ajprenal.1998.274.6.F1140. [DOI] [PubMed] [Google Scholar]
- 66.Averaimo S, Milton RH, Duchen MR, Mazzanti M. Chloride intracellular channel 1 (CLIC1): Sensor and effector during oxidative stress. FEBS Lett. 584(10):2076–84. doi: 10.1016/j.febslet.2010.02.073. [DOI] [PubMed] [Google Scholar]
- 67.Gisler SM, Pribanic S, Bacic D, Forrer P, Gantenbein A, Sabourin LA, Tsuji A, Zhao ZS, Manser E, Biber J, Murer H. PDZK1: I. a major scaffolder in brush borders of proximal tubular cells. Kidney Int. 2003;64(5):1733–45. doi: 10.1046/j.1523-1755.2003.00266.x. [DOI] [PubMed] [Google Scholar]
- 68.Gisler SM, Stagljar I, Traebert M, Bacic D, Biber J, Murer H. Interaction of the type IIa Na/Pi cotransporter with PDZ proteins. J Biol Chem. 2001;276(12):9206–13. doi: 10.1074/jbc.M008745200. [DOI] [PubMed] [Google Scholar]
- 69.Layton AT, Pannabecker TL, Dantzler WH, Layton HE. Two modes for concentrating urine in rat inner medulla. Am J Physiol Renal Physiol. 2004;287(4):F816–39. doi: 10.1152/ajprenal.00398.2003. [DOI] [PubMed] [Google Scholar]
- 70.Kocher O, Pal R, Roberts M, Cirovic C, Gilchrist A. Targeted disruption of the PDZK1 gene by homologous recombination. Mol Cell Biol. 2003;23(4):1175–80. doi: 10.1128/MCB.23.4.1175-1180.2003. [DOI] [PMC free article] [PubMed] [Google Scholar]
- 71.Lim SW, Li C, Sun BK, Han KH, Kim WY, Oh YW, Lee JU, Kador PF, Knepper MA, Sands JM, Kim J, Yang CW. Long-term treatment with cyclosporine decreases aquaporins and urea transporters in the rat kidney. Am J Physiol Renal Physiol. 2004;287(1):F139–51. doi: 10.1152/ajprenal.00240.2003. [DOI] [PubMed] [Google Scholar]
- 72.Bauer K, Kretzschmar AK, Cvijic H, Blumert C, Loffler D, Brocke-Heidrich K, Schiene-Fischer C, Fischer G, Sinz A, Clevenger CV, Horn F. Cyclophilins contribute to Stat3 signaling and survival of multiple myeloma cells. Oncogene. 2009;28(31):2784–95. doi: 10.1038/onc.2009.142. [DOI] [PubMed] [Google Scholar]
- 73.Smith CC, Dixon RA, Wynne AM, Theodorou L, Ong SG, Subrayan S, Davidson SM, Hausenloy DJ, Yellon DM. Leptin-induced cardioprotection involves JAK/STAT signaling that may be linked to the mitochondrial permeability transition pore. Am J Physiol Heart Circ Physiol. 299(4):H1265–70. doi: 10.1152/ajpheart.00092.2010. [DOI] [PMC free article] [PubMed] [Google Scholar]
- 74.Jobe SM, Wilson KM, Leo L, Raimondi A, Molkentin JD, Lentz SR, Di Paola J. Critical role for the mitochondrial permeability transition pore and cyclophilin D in platelet activation and thrombosis. Blood. 2008;111(3):1257–65. doi: 10.1182/blood-2007-05-092684. [DOI] [PMC free article] [PubMed] [Google Scholar]
Associated Data
This section collects any data citations, data availability statements, or supplementary materials included in this article.