Abstract
The lipopolysaccharide (LPS)-rich outer membrane (OM) is a unique feature of Gram-negative bacteria, and LPS transport across the inner membrane (IM) and through the periplasm is essential to the biogenesis and maintenance of the OM. LPS is transported across the periplasm to the outer leaflet of the OM by the LPS transport (Lpt) system, which in Escherichia coli is comprised of seven recently identified proteins, including LptA, LptC, LptDE, and LptFGB2. Structures of the periplasmic protein LptA and the soluble portion of the membrane-associated protein LptC have been solved and show these two proteins to be highly structurally homologous with unique folds. LptA has been shown to form concentration dependent oligomers that stack end-to-end. LptA and LptC have been shown to associate in vivo and are expected to form a similar protein–protein interface to that found in the LptA dimer. In these studies, we disrupted LptA oligomerization by introducing two point mutations that removed a lysine and glutamine side chain from the C-terminal β-strand of LptA. This loss of oligomerization was characterized using EPR spectroscopy techniques and the affinity of the interaction between the mutant LptA protein and WT LptC was determined using EPR spectroscopy (Kd = 15 µM) and isothermal titration calorimetry (Kd = 14 µM). Kd values were also measured by EPR spectroscopy for the interaction between LptC and WT LptA (4 µM) and for WT LptA oligomerization (29 µM). These data suggest that the affinity between LptA and LptC is stronger than the affinity for LptA oligomerization.
Keywords: LptA, LptC, LPS binding protein, protein oligomerization, EPR spectroscopy, ITC, dissociation constants
Introduction
The lipopolysaccharide (LPS)-rich outer membrane (OM) is a unique feature of Gram-negative bacteria that plays a key role in their resistance to antibiotics and other environmental stresses. LPS transport across the inner membrane (IM) and through the periplasm is essential to the biogenesis and maintenance of the OM. LPS is transported across the periplasm to the outer leaflet of the OM by the LPS transport (Lpt) system, which in Escherichia coli is comprised of seven recently identified proteins.1–11 In the current model, LPS molecules are shuttled out of the IM via the inner membrane-associated protein LptC, which is associated with the ATPase cassette LptFGB2. LptC then transfers LPS to the soluble periplasmic protein LptA, one or more of which delivers LPS to the OM protein complex LptDE for insertion into the outer leaflet of the OM.
Crystal structures of both LptA and the soluble portion of LptC have been solved.12,13 The two proteins are highly structurally homologous despite a lack of sequence homology, and the monomers represent a unique β-sheet fold where their eight-stranded sheets fold in half and twist 90° from end to end. LptC crystallized as a monomer and is predicted to function as a monomer in the bacterial cell.13 LptA crystallized as tetramers in the presence of LPS and as dimers in the apo state.12 Our previous studies using EPR spectroscopy and light scattering techniques confirmed that LptA oligomerization occurs end-to-end (where the resolved C-terminal β-strand of one protomer interacts with the N-terminal β-strand of the adjacent protomer),14 as shown in the crystal structures [Fig. 1(A)]. Our data also showed that LptA oligomerization is concentration dependent and that self-association occurs even at low micromolar concentrations, with dimers present at 1 µM protein concentration and oligomers containing at least 20 protomers present at concentrations above 70 µM.14 It is still unknown how many LptA proteins are involved in the transport of LPS across the periplasm of Gram-negative bacteria.
Figure 1.
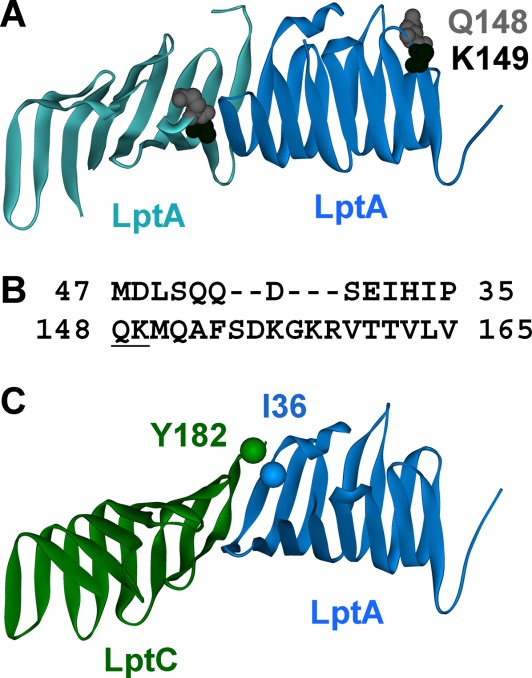
Structures of LptA and LptC. (A) The LptA dimer observed in the 2R19 crystal structure12 with sites Q148 and K149 highlighted. The K149 side chain was not resolved and is missing from the structure. (B) The N-terminal amino acids 35–47 and the C-terminal amino acids 148–165 of LptA are aligned based on the crystallographic oligomer. The gap occurs because the C-terminal loop in the fold of the β-strand is longer than in the N-terminus edge strand. Amino acids K149 and Q148 are underlined. (C) Docked model of the LptC (green;3MY2)-LptA (blue; 2R19) interaction based on the LptA dimer structure. Reporter sites Y182 LptC and I36 LptA used for the affinity studies are labeled.
Protein–protein interaction between LptA and LptC has been shown to occur in vitro15 and in vivo16 and the interface is predicted to be the same as that utilized for LptA oligomerization, where the resolved C-terminal edge strand of LptC forms an interface with the N-terminal edge strand of LptA.16 A docked model of this interaction based on the crystallographic dimer of LptA is shown in Figure 1(C).
These studies describe the disruption of LptA oligomerization by removal of two side chains on the C-terminal edge strand of LptA and the characterization of the interaction between the mutant LptA and WT LptC. The affinity of WT LptA oligomerization is also reported.
Results
The LptA–LptA oligomerization interface observed by X-ray crystallography12 is comprised of two β-strands, a C-terminal edge strand (residues 148–165) from one protomer and an N-terminal edge strand (residues 35–47) from the adjacent protomer, each folded nearly in half and aligned edge-to-edge [Fig. 1(A)]. The interaction between these β-strands is stabilized by a strong backbone hydrogen bonding network, with the amino acid side chains for the most part parallel to each other. Several of the residues on these edge strands of LptA have extended side chains and are charged [Fig. 1(B)], presumably allowing for a stable interaction and a specific interaction interface. In an attempt to disrupt the oligomeric structure of LptA, we selectively removed the first two side chains on the C-terminal edge strand by creating the double alanine substitution Q148A/K149A.
Analysis of monomeric LptA
To assess the effects of the Q148A/K149A mutation on LptA oligomerization using EPR spectroscopy, we introduced an I36C mutation and selectively labeled the cysteine with MTSL to create the I36R1/Q148A/K149A LptA protein. The I36 site is located on the N-terminal edge strand of LptA [Fig. 1(C)]. In the WT LptA background, the motion of the I36R1 reporter group is concentration dependent [Fig. 2(A)], which verifies that this site is sensitive to protein–protein interactions involving the N-terminal edge strand of LptA. This is consistent with our previously published results showing that LptA forms a continuous array of higher order end-to-end oligomers as a function of increasing protein concentration.14 In contrast, in the Q148A/K149A LptA background, the motion of I36R1 does not change with concentration [Fig. 2(B)], which indicates there is no longer any protein–protein interaction at this interface at the concentrations tested (i.e., 5– 90 µM).
Figure 2.
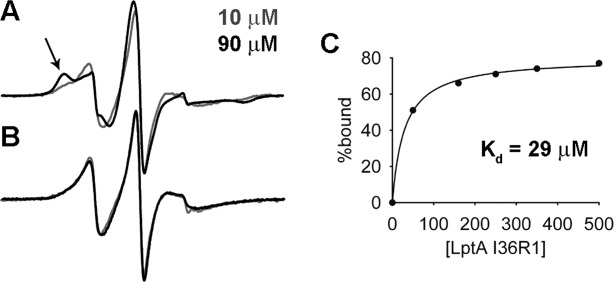
Overlays of EPR spectra of 10 µM (gray) and 90 µM (black) I36R1 LptA in the (A) WT and (B) Q148A/K149A backgrounds. Arrow indicates the immobile component that arises due to oligomerization of WT LptA at the interface containing I36R1. The lack of motional change in the Q148A/K149A LptA mutant indicates the protein does not oligomerize at the N-terminal interface. (C) Plot of the datapoints generated from the deconvolution of the EPR spectra analyzed and fit to a one-site binding model.
To further assess the oligomeric state of the I36R1/Q148A/K149A LptA protein, we utilized DEER spectroscopy, which detects only R1 groups involved in dipolar interactions and yields quantitative distance information. Previously, we reported that the distance between I36R1 groups in the WT LptA oligomer is 39 Å using X-band DEER spectroscopy.14 In Figure 3, we repeat the I36R1 data in the WT background using Q-band DEER spectroscopy at a protein concentration of 100 µM. At this concentration WT LptA is highly self-associated with 25-mers as the predominant species,14 and therefore we expect every R1 group to be involved in a dipolar interaction. Consistent with this expectation, we again observed a pronounced dipolar modulation in the DEER spectrum of I36R1 LptA in the WT background with an interspin distance of 39 Å (Fig. 3). In marked contrast, the DEER data for I36R1 in the Q148A/K149A background show only a very weak dipolar oscillation and no discrete interspin distance, indicating that this construct does not form a well-defined, repeating oligomeric structure.
Figure 3.
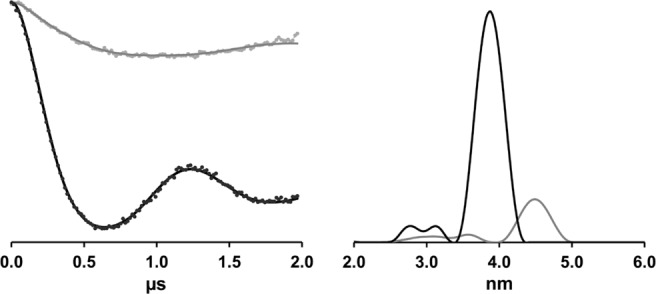
DEER spectroscopy data for I36R1 LptA in the WT (black) and Q148A/K149A (gray) backgrounds. Background-corrected dipolar evolution data (left) and resulting distance distribution plots (right).
To test the effects of the Q148A/K149A mutation on the overall structure of the protein, circular dichroism (CD) spectra were recorded for the mutant and WT proteins (Fig. 4). The spectra were nearly superimposable, indicating that these mutations cause only relatively minor changes in the overall protein secondary structure.
Figure 4.
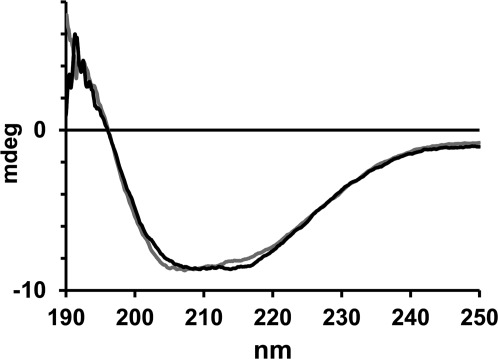
Far UV circular dichroism spectra of I36C LptA in the WT (black) and Q148A/K149A (gray) backgrounds. The spectra were recorded at a protein concentration of 3 μM in 6 mM sodium phosphate, pH 7.0, 40 mM NaCl buffer.
Affinity of the LptA–LptC interaction
By producing an LptA variant with a modified C-terminal edge strand that no longer binds the N-terminal edge of other LptA proteins, we created a construct free to report on binding to other protein partners such as LptC. Therefore, we utilized the newly created I36R1/Q148A/K149A LptA protein to investigate the ability of WT LptC to bind to the N-terminal interface of LptA. We tested for this interaction using 10 µM I36R1/Q148A/K149A LptA and increasing concentrations of WT LptC. As noted above, in the absence of LptC the spectrum of I36R1 LptA indicates relatively fast rotational motion of the spin label, consistent with its location on a terminal edge strand. In the presence of WT LptC, there is a considerable decrease in the mobility of I36R1, giving rise to a broad spectral feature that is characteristic of an immobilized nitroxide [Fig. 5(A)], indicating that LptA and LptC have a stable interaction and that LptC likely binds to this N-terminal interface on LptA. Spectra obtained from samples containing various amounts of LptC were deconvoluted to determine the population of bound and unbound protein at each concentration and fit to a single site binding model, yielding a Kd of 14.3 ± 4.4 µM for the interaction of LptC with I36R1/Q148A/K149A LptA [Fig. 5(B)].
Figure 5.
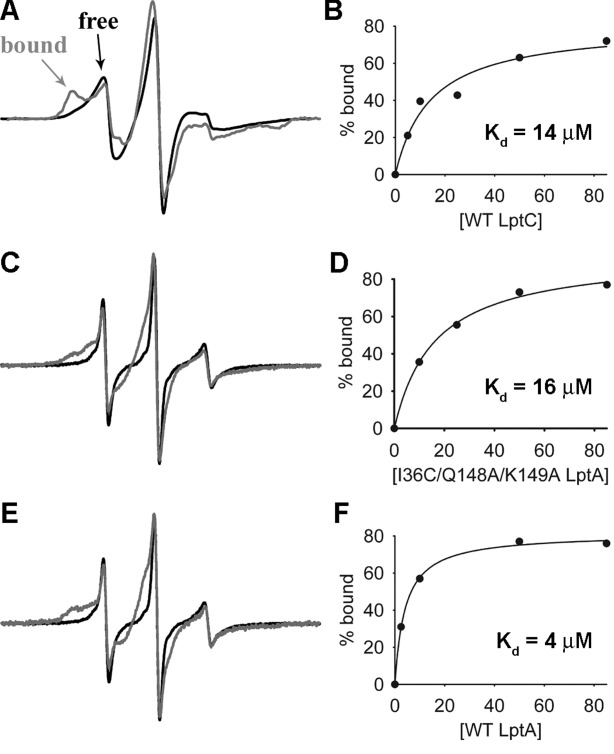
EPR binding assays. (A) 10 µM I36R1/Q148A/K149A LptA apo (black) and in the presence of 85 µM WT LptC (gray). The bound and unbound (free) fractions are labeled to highlight the spectral changes that occur upon protein binding. (C) 10 µM Y182R1 LptC apo (black) and in the presence of 85 µM I36C/Q148A/K149A LptA (gray). (E) 10 µM Y182R1 LptC apo (black) and in the presence of 85 µM WT LptA (gray). (B, D, F) Plots of the data points generated from the deconvolution of the EPR spectra fit to single site binding curves in SigmaPlot are shown next to each corresponding example overlay.
For comparison, we also tested the interaction between unlabeled I36C/Q148A/K149A LptA and LptC by introducing a Y182R1 reporter group onto the C-terminal edge strand of LptC [Fig. 1(C)]. The spectrum of apo Y182R1 LptC shows fast motion, giving rise to a narrow lineshape, consistent with its position at the end of an edge strand just as the C-terminal tail of LptC becomes unstructured. The EPR spectrum of Y182R1 does not change with increasing LptC concentration (data not shown), verifying that LptC does not interact with itself at this edge. However, the addition of increasing concentrations of I36C/Q148A/K149A LptA to 10 µM Y182R1 LptC results in a considerable decrease in spin label motion [Fig. 5(C)], again clearly indicating that LptA and LptC interact with each other in vitro and consistent with LptA binding to this C-terminal interface of LptC. Analysis of this dataset using LptC as the reporter protein yielded a Kd of 16.2 ± 1.7 µM [Fig. 5(D)], in excellent agreement with the dissociation constant determined for this interaction using I36R1/Q148A/K149A LptA as the reporter protein.
To evaluate the effects, if any, that the Q148A/K149A mutations may have on the ability of LptA to bind to LptC, we compared the binding of mutant LptA to LptC [Kd = 16 µM; Fig. 5(C,D)] with the binding of WT LptA to LptC. We accomplished this by measuring the interaction between WT LptA and Y182R1 LptC [Kd of 4.1 ± 0.3 µM; Fig. 5(E,F)] using the same SDSL approach as described above. Upon comparison of the two values, WT LptA has a slightly stronger affinity for LptC than mutant LptA.
Additional analysis of the interaction between mutant LptA and WT LptC using isothermal titration calorimetry (ITC) yielded a Kd of 14.4 ± 0.8 µM [Fig. 6]. This value is in excellent agreement with the dissociation constants determined for this interaction by EPR spectroscopy and corresponds to an association constant (Ka) of 6.94 × 10⁴ M–1. The ITC data also confirm that the interaction between LptA and LptC is equimolar with a calculated stoichiometry of 0.89. The additional thermodynamic parameters calculated from the ITC data are ΔH = –5.2 kcal/mol, ΔS = 4.6 cal/mol K and a ΔG at 25°C of –6.6 kcal/mol.
Figure 6.
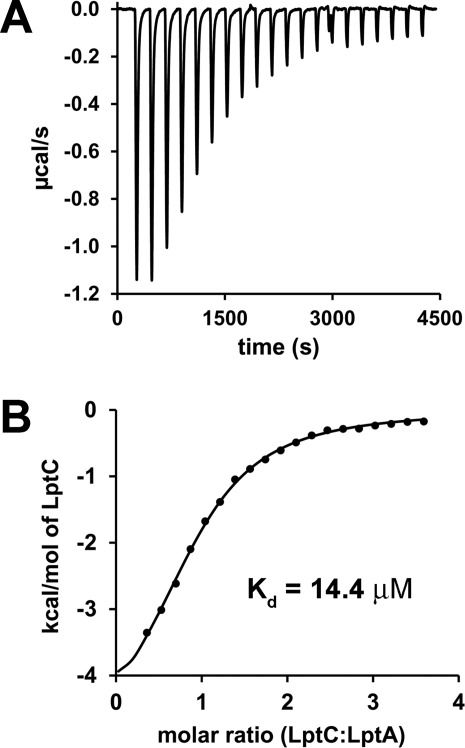
Isothermal titration calorimetry. (A) Background and baseline corrected raw ITC data and (B) binding isotherm for WT LptC injected into 50 µM I36C/Q148A/K149A LptA.
Affinity of LptA self-association
We determined a Kd for LptA self-association of 29.0 ± 1.7 µM [Fig. 2(C)] using the spectrum of I36R1/Q148A/K149A LptA, which represents unrestricted motion at the N-terminal edge strand, to deconvolute the motionally restricted I36R1 WT LptA EPR spectra at increasing concentrations of LptA. This value is weaker than the dissociation constants obtained for the Q148A/K149A LptA-LptC interaction as well as the calculated binding affinity between WT LptA and LptC.
Discussion
In this study we describe for the first time a construct of the essential E. coli LPS transport protein LptA that does not self-associate to form large extended oligomers. This was achieved with relatively minimal perturbation, requiring only the modification of two side chains (Q148A, K149A) on the C-terminal edge strand of LptA. This result strengthens the current model based on its crystal structure,12 that LptA self-associates in an end-to-end manner and is thus capable of forming large oligomers.14 In addition, disrupting the C-terminal binding interface of LptA while keeping the N-terminal binding interface intact allowed us to study the interaction between LptA and LptC.
Using an SDSL EPR spectroscopy approach, we calculated dissociation constants based on the assumption that the decreased mobility of R1 located on the edge strands of LptA and LptC directly reports on protein binding/oligomerization. Mobility changes may result from altered dynamics of the spin label side chain, changes in backbone motion, or variations in the overall tumbling of the protein. It is assumed based on the location of the R1 groups on or near the expected protein-protein binding interfaces that the slower motion component is due to the dynamics of the R1 group being limited by direct protein interaction. In principle, these changes could also arise from new restrictions in backbone motion at these positions or a decrease in the overall tumbling rate of the protein complex. However, all of these effects are attributed to protein–protein interaction and therefore would not affect the reported Kd values.
Here we report a dissociation constant for the in vitro interaction between I36R1/Q148A/K149A LptA and WT LptC of 14–16 µM. Observed Kd values were in excellent agreement regardless of whether the spin label reporter group was attached to LptA or LptC. Using an independent method, we also measured a Kd value of 14 μM for the I36C/Q148A/K149A LptA-LptC interaction by ITC. Data for the LptA–LptC interaction could not be obtained by ITC using WT LptA due to the concentration-dependent formation and dissociation of LptA oligomers.14 These affinity values are slightly weaker than the Kd of 4 µM observed in this study for the interaction of WT LptA with Y182R1 LptC or the 0.48–2 μM values obtained by surface plasmon resonance (SPR) for the interaction between WT LptA covalently bound to the sensor chip and untagged, soluble WT LptC.17 It is possible that the difference is due to subtle changes in the LptA binding interface due to the I36C mutation, however all of these measurements indicate a higher affinity for the LptA–LptC interaction than for LptA–LptA self-association.
The data presented here also show for the first time the affinity of LptA self-association. The 29 µM Kd for LptA self-association indicates a weaker interaction than the 14–16 µM Kd values obtained for the mutant LptA–LptC interaction or the 2–4 µM Kd estimated for the interaction of WT LptA with LptC. In our WT LptA binding experiment [Fig. 5(E,F)], the fraction of LptC bound to LptA was greater than the expected concentration of N-terminal edges available for binding, suggesting that LptA oligomers dissociate in the presence of LptC. The higher affinity of the LptA-LptC interaction may help ensure binding of LptA–LptC in the periplasm. Our data also show that these two proteins interact even in the absence of LPS.
The number of LptA proteins required to span the periplasmic space between the IM-associated LptC and the OM protein complex LptDE is as yet unknown, but if two or more LptA proteins form a periplasmic bridge1,8,12,14 then monomeric LptA would likely not be functional in vivo. Furthermore, since it is expected that the C-terminal edge strand of LptA forms an interface with the N-terminus of LptD,16 the modified C-terminal edge of Q148A/K149A LptA may also interfere with LPS delivery to the OM LptDE complex.
Interaction between the periplasmic protein LptA and the IM-associated protein LptC is thought to occur through association between the N-terminal β-strand of LptA and the C-terminal β-strand of LptC,16 and is an essential step in the transport of LPS to the OM. It is therefore important to elucidate the details of the interaction between these two proteins. LptA and LptC are both highly conserved within a number of species of Gram-negative bacteria. Consequently, the results reported here are broadly relevant to the understanding of LPS transport.
Materials and Methods
Plasmid and protein preparation
The plasmid encoding recombinant LptA containing a C-terminal 6xHis tag was created as described previously.14 The DNA encoding the soluble fraction of the LptC protein (amino acids 24-191) was PCR amplified from the chromosome of E. coli BL21(DE3) cells using primers that inserted NdeI and XhoI restriction sites flanking residue 28 and the C-terminal stop codon, respectively. The lptC24-191 gene was ligated into pET28b (Novagen, Merck Chemicals, Germany), which encodes for an N-terminal 6xHis tag. Single cysteine and double alanine mutations were generated using High Fidelity PCR EcoDry Premix (Clontech, Mountain View, CA). Sequencing verification was carried out by Retrogen (San Diego, CA).
Plasmids were transformed into BL21(DE3)pLysS or BL21(DE3) cells for expression and purification of LptA and LptC protein, respectively. Cells were grown at 37°C for 6–8 hours in 5 mL of Luria broth (LB) and ampicillin (100 μg/mL) or kanamycin (30 µg/mL) and then subcultured into 100 mL of LB/antibiotic and grown overnight. About 50 mL of the overnight culture were subcultured into 2 L of LB/antibiotic and grown to an OD600 of 0.6. The cells were induced for 3 h with 0.5 mM IPTG (isopropyl-1-thio-β-d-galactopyranoside), pelleted by centrifugation and resuspended in buffer A (50 mM sodium phosphate, pH 7.0, 300 mM NaCl). Washed cells were disrupted using a French pressure cell and the soluble fraction loaded onto Talon resin (Clontech, Mountain View, CA) as described previously for LptA.14
LptA protein was washed and eluted from the cobalt affinity column in buffer A and imidazole as described.14,18 LptC protein was also washed and eluted using the same procedure except that it was spin labeled while bound to the affinity resin prior to washing and elution (see below for spin labeling protocols). Pooled pure protein fractions were concentrated as needed using Amicon Ultra 10K concentrators; protein concentrations were determined with the Pierce BCA Protein Assay kit (Thermo Scientific, Rockford, IL) using lysozyme (14 kDa) as a protein standard.
SDSL EPR spectroscopy
Purified LptA protein containing the single cysteine I36C was spin labeled with the sulfhydryl-specific spin label 2,2,5,5-tetramethylpyrroline-3-yl-methanethiosulfonate spin label (MTSL, Toronto Research Chemicals) to form the R1 side chain, as described previously.14 Purified LptC protein containing the single cysteine Y182C was spin labeled with 0.6 mM MTSL in buffer A overnight at 4°C while bound to the affinity column. Excess label was removed during the subsequent wash steps.
Continuous wave (CW) EPR spectroscopy was carried out on an X-band Bruker ELEXSYS 500 spectrometer equipped with a Bruker super high Q cavity. Samples were typically 25 µL in volume and contained in a glass capillary. Spectra were recorded at room temperature over 100 G under nonsaturating conditions using 1 G 100 kHz field modulation.
DEER spectroscopy was carried out on a Q-band Bruker ELEXSYS E580 spectrometer with a 10W amplifier and an EN5107D2 probehead using a four-pulse sequence.19 Samples in fire-sealed quartz capillaries (1.1 mm × 1.6 mm; VitroCom) contained 20% deuterated glycerol as a cryoprotectant, were 12 µL in volume and flash frozen in an acetone/dry ice slurry immediately prior to data acquisition at 80K. Dipolar evolution data were analyzed using DeerAnalysis201120 and Tikhonov regularization for the best fit to the background-corrected data.
Circular dichroism
CD spectra were recorded on a Jasco J-710 spectropolarimeter. Proteins were recorded at a concentration of 3 μM in 6 mM sodium phosphate, pH 7.0, 40 mM NaCl. Spectra were signal averaged 20× at room temperature in a standard 0.1 cm pathlength cuvette at 1 nm resolution with a time constant of 0.5 s.
Isothermal titration calorimetry
Isothermal titration calorimetry (ITC) experiments were carried out on a Microcal VP-ITC calorimeter at 25°C. Purified protein was dialyzed extensively against buffer A and concentrations were verified immediately prior to injection. The sample cell was loaded with 1.7 mL of 50 µM I36C/Q148A/K149A LptA and the 250 µL syringe was loaded with 1 mM WT LptC. A series of twenty 12 µL injections were made at 3.5 min intervals after an initial 2 µL injection. Heat of dilution controls were carried out with buffer A in the sample well and WT LptC loaded into the syringe. The background-subtracted data were analyzed using a one-site binding model and Origin ITC software provided by MicroCal.
Acknowledgments
The DEER instrumentation was supported by the NIH (S10RR022422). The EPR data were collected at the National Biomedical EPR Center (P41EB001980).
Glossary
- CD
circular dichroism
- CW
continuous wave
- IM
inner membrane
- ITC
isothermal titration calorimetry
- LPS
lipopolysaccharide
- Lpt
LPS transport
- OM
outer membrane
- EPR
electron paramagnetic resonance
References
- 1.Sperandeo P, Deho G, Polissi A. The lipopolysaccharide transport system of Gram-negative bacteria. Biochim Biophys Acta. 2009;1791:594–602. doi: 10.1016/j.bbalip.2009.01.011. [DOI] [PubMed] [Google Scholar]
- 2.Bos MP, Tefsen B, Geurtsen J, Tommassen J. Identification of an outer membrane protein required for the transport of lipopolysaccharide to the bacterial cell surface. Proc Natl Acad Sci U S A. 2004;101:9417–9422. doi: 10.1073/pnas.0402340101. [DOI] [PMC free article] [PubMed] [Google Scholar]
- 3.Wu T, McCandlish AC, Gronenberg LS, Chng SS, Silhavy TJ, Kahne D. Identification of a protein complex that assembles lipopolysaccharide in the outer membrane of Escherichia coli. Proc Natl Acad Sci USA. 2006;103:11754–11759. doi: 10.1073/pnas.0604744103. [DOI] [PMC free article] [PubMed] [Google Scholar]
- 4.Sperandeo P, Cescutti R, Villa R, Di Benedetto C, Candia D, Deho G, Polissi A. Characterization of lptA and lptB, two essential genes implicated in lipopolysaccharide transport to the outer membrane of Escherichia coli. J Bacteriol. 2007;189:244–253. doi: 10.1128/JB.01126-06. [DOI] [PMC free article] [PubMed] [Google Scholar]
- 5.Sperandeo P, Lau FK, Carpentieri A, De CC, Molinaro A, Deho G, Silhavy TJ, Polissi A. Functional analysis of the protein machinery required for transport of lipopolysaccharide to the outer membrane of Escherichia coli. J Bacteriol. 2008;190:4460–4469. doi: 10.1128/JB.00270-08. [DOI] [PMC free article] [PubMed] [Google Scholar]
- 6.Ruiz N, Gronenberg LS, Kahne D, Silhavy TJ. Identification of two inner-membrane proteins required for the transport of lipopolysaccharide to the outer membrane of Escherichia coli. Proc Natl Acad Sci U S A. 2008;105:5537–5542. doi: 10.1073/pnas.0801196105. [DOI] [PMC free article] [PubMed] [Google Scholar]
- 7.Narita S, Tokuda H. Biochemical characterization of an ABC transporter LptBFGC complex required for the outer membrane sorting of lipopolysaccharides. FEBS Lett. 2009;583:2160–2164. doi: 10.1016/j.febslet.2009.05.051. [DOI] [PubMed] [Google Scholar]
- 8.Ruiz N, Kahne D, Silhavy TJ. Transport of lipopolysaccharide across the cell envelope: the long road of discovery. Nat Rev Microbiol. 2009;7:677–683. doi: 10.1038/nrmicro2184. [DOI] [PMC free article] [PubMed] [Google Scholar]
- 9.Chng SS, Ruiz N, Chimalakonda G, Silhavy TJ, Kahne D. Characterization of the two-protein complex in Escherichia coli responsible for lipopolysaccharide assembly at the outer membrane. Proc Natl Acad Sci U S A. 2010;107:5363–5368. doi: 10.1073/pnas.0912872107. [DOI] [PMC free article] [PubMed] [Google Scholar]
- 10.Freinkman E, Chng SS, Kahne D. The complex that inserts lipopolysaccharide into the bacterial outer membrane forms a two-protein plug-and-barrel. Proc Natl Acad Sci U S A. 2011;108:2486–2491. doi: 10.1073/pnas.1015617108. [DOI] [PMC free article] [PubMed] [Google Scholar]
- 11.Chng SS, Gronenberg LS, Kahne D. Proteins required for lipopolysaccharide assembly in Escherichia coli form a transenvelope complex. Biochemistry. 2010;49:4565–4567. doi: 10.1021/bi100493e. [DOI] [PMC free article] [PubMed] [Google Scholar]
- 12.Suits MD, Sperandeo P, Deho G, Polissi A, Jia Z. Novel structure of the conserved gram-negative lipopolysaccharide transport protein A and mutagenesis analysis. J Mol Biol. 2008;380:476–488. doi: 10.1016/j.jmb.2008.04.045. [DOI] [PubMed] [Google Scholar]
- 13.Tran AX, Dong C, Whitfield C. Structure and functional analysis of LptC, a conserved membrane protein involved in the lipopolysaccharide export pathway in Escherichia coli. J Biol Chem. 2010;285:33529–33539. doi: 10.1074/jbc.M110.144709. [DOI] [PMC free article] [PubMed] [Google Scholar]
- 14.Merten JA, Schultz KM, Klug CS. Concentration-dependent oligomerization and oligomeric arrangement of LptA. Protein Sci. 2012;21:211–218. doi: 10.1002/pro.2004. [DOI] [PMC free article] [PubMed] [Google Scholar]
- 15.Sperandeo P, Villa R, Martorana AM, Samalikova M, Grandori R, Deho G, Polissi A. New insights into the Lpt machinery for lipopolysaccharide transport to the cell surface: LptA-LptC interaction and LptA stability as sensors of a properly assembled transenvelope complex. J Bacteriol. 2011;193:1042–1053. doi: 10.1128/JB.01037-10. [DOI] [PMC free article] [PubMed] [Google Scholar]
- 16.Freinkman E, Okuda S, Ruiz N, Kahne D. Regulated assembly of the transenvelope protein complex required for lipopolysaccharide export. Biochemistry. 2012;51:4800–4806. doi: 10.1021/bi300592c. [DOI] [PMC free article] [PubMed] [Google Scholar]
- 17.Bowyer A, Baardsnes J, Ajamian E, Zhang L, Cygler M. Characterization of interactions between LPS transport proteins of the Lpt system. Biochem Biophys Res Commun. 2011;404:1093–1098. doi: 10.1016/j.bbrc.2010.12.121. [DOI] [PubMed] [Google Scholar]
- 18.Tran AX, Trent MS, Whitfield C. The LptA protein of Escherichia coli is a periplasmic lipid A-binding protein involved in the lipopolysaccharide export pathway. J Biol Chem. 2008;283:20342–20349. doi: 10.1074/jbc.M802503200. [DOI] [PMC free article] [PubMed] [Google Scholar]
- 19.Pannier M, Veit S, Godt A, Jeschke G, Spiess HW. Dead-time free measurement of dipole-dipole interactions between electron spins. J Magn Reson. 2000;142:331–340. doi: 10.1006/jmre.1999.1944. [DOI] [PubMed] [Google Scholar]
- 20.Jeschke G, Chechik V, Ionita P, Godt A, Zimmermann H, Banham J, Timmel C, Hilger D, Jung H. DeerAnalysis2006: a comprehensive software package for analyzing pulsed ELDOR data. Appl Magn Reson. 2006;30:473–498. [Google Scholar]


