

Abstract
Background and Purpose
Thioredoxin-interacting protein (TXNIP), a regulator of cellular oxidative stress, has been associated with activation of NOD-like receptor 3 (NLRP3) inflammasome, inflammation and lipid metabolism, suggesting it has a role in the pathogenesis of non-alcoholic fatty liver disease (NAFLD) in diabetes. In this study we investigated whether TXNIP is involved in type 1 diabetes-associated NAFLD and whether antioxidants, quercetin and allopurinol, alleviate NAFLD by targeting TXNIP.
Experimental Approach
Diabetes was induced in male Sprague-Dawley rats by a single i.p. injection of 55 mg·kg−1 streptozotocin. Quercetin and allopurinol were given p.o. to diabetic rats for 7 weeks. Hepatic function, oxidative stress, inflammation and lipid levels were determined. Rat BRL-3A and human HepG2 cells were exposed to high glucose (30 mM) in the presence and absence of antioxidants, TXNIP siRNA transfection or caspase-1 inhibitor, Ac-YVAD-CMK.
Key Results
Quercetin and allopurinol significantly inhibited the TXNIP overexpression, activation of NLRP3 inflammasome, down-regulation of PPARα and up-regulation of sterol regulatory element binding protein-1c (SREBP-1c), SREBP-2, fatty acid synthase and liver X receptor α, as well as elevation of ROS and IL-1β in diabetic rat liver. These effects were confirmed in hepatocytes in vitro and it was further shown that TXNIP down-regulation contributed to the suppression of NLRP3 inflammasome activation, inflammation and changes in PPARα and SREBPs.
Conclusions and Implications
Inhibition of hepatic TXNIP by quercetin and allopurinol contributes to the reduction in liver inflammation and lipid accumulation under hyperglycaemic conditions. The targeting of hepatic TXNIP by quercetin and allopurinol may have therapeutic implications for prevention of type 1 diabetes-associated NAFLD.
Keywords: quercetin, allopurinol, hyperglycaemia, hepatic lipid accumulation, thioredoxin-interacting protein, NLRP3 inflammasome, PPARα, SREBPs
Introduction
Non-alcoholic fatty liver disease (NAFLD), a histological spectrum of chronic liver disease ranging from fatty liver alone to non-alcoholic steatohepatitis (NASH; Targher et al., 2008; Arrese, 2010), is very common in type 1 diabetic subjects and there is accumulating evidence to suggest that type 2 diabetes is strongly correlated with the development of liver complications such as NAFLD. However, the pathophysiological and molecular mechanisms underlying type 1 diabetes-associated NAFLD are not yet understood. Oxidative stress is involved in the pathogenesis of NAFLD, as the production of reactive oxygen species (ROS) is increased in both diabetic humans and in animal models of this disease (Kakkar et al., 1998; Videla et al., 2006). One of the major mammalian antioxidant systems, thioredoxin (TRX)-dependent peroxidase peroxiredoxin, protects against the effects of ROS including those of superoxide anion (O2•−) and hydrogen peroxide (H2O2; Muoio, 2007). Thioredoxin-interacting protein (TXNIP, also known as TBP-2, TRX-binding protein-2) is an endogenous inhibitor of cellular TRX and blocks its anti-oxidative function (Muoio, 2007). TXNIP-deficient mice were protected against the diabetes induced by streptozotocin (STZ) (Chen et al., 2008). Recently, TXNIP was found to bind and activate the NOD-like receptor family, pyrin domain-containing 3 (NLRP3) inflammasome (Zhou et al., 2010). Key components of a functional NLRP3 inflammasome are the NLRP3, adaptor protein apoptosis-associated speck-like protein (ASC) and caspase-1. Activation of the NLRP3 inflammasome potently increases the maturation and secretion of pro-inflammatory cytokines IL-1β (pro-IL-1β) and pro-IL-18 (Tschopp and Schroder, 2010), causing an inflammatory response. Inflammation induced by a methionine and choline-deficient diet is less severe in TXNIP-/- mice than in wild-type mice (Ahsan et al., 2009). Of note, ROS also induces activation of the NLRP3 inflammasome (Tschopp and Schroder, 2010). Inhibition of ROS antagonizes the reduction in glucose-dependent IL-1β secretion in the pancreatic islets of both TXNIP- and NLRP3-deficient mouse (Zhou et al., 2010). However, it is not known whether TXNIP-mediated activation of NLRP3 inflammasome is involved in the pathogenesis of type 1 diabetes-associated NAFLD.
PPARα is a major transcriptional regulator of lipid metabolism involved in fatty acid β-oxidation. ROS generation down-regulates PPARα, resulting in lipid accumulation (Cabrero et al., 2002). In PPARα-null mice, the hepatic oxidative stress induced by food deprivation is exacerbated (Abdelmegeed et al., 2009), as is obesity-induced chronic liver inflammation (Stienstra et al., 2007). Furthermore, high glucose-induced insulin secretion and sensitivity impairment are attenuated in TXNIP-/- mice with an up-regulated expression of hepatic PPARα (Oka et al., 2009), indicating that TXNIP-mediated down-regulation of PPARα is involved in the pathogenesis of NASH (Ahsan et al., 2009). However, whether this mechanism contributes to the development of liver complications associated with type 1 diabetes remains to be determined. On the other hand, PPARα controls the central regulator of membrane biogenesis, sterol regulatory element binding protein (SREBP)-1c, involved in fatty acid biosynthesis (Knight et al., 2005). Inhibition of SREBP-1c ameliorates hepatic steatosis in obese mice (Sekiya et al., 2003). It has also been suggested that SREBP-2 plays a crucial role in the regulation of cholesterol synthesis (Brown and Goldstein, 1997) and it has been shown to be involved in the pathogenesis of NAFLD in an animal model of diabetes (Moon et al., 2012). Furthermore, caspase-1 activation induces the overexpression of SREBP-1c and SREBP-2 (Gurcel et al., 2006). Thus, caspase-1-mediated activation of SREBPs may be involved in the hepatic accumulation of lipids in type 1 diabetes.
The dietary flavonoid quercetin is thought to promote health, partly due to its ability to act as an antioxidant against ROS (Hertog and Hollman, 1996; Ramos-Romero et al., 2012) and to inhibit xanthine oxidase (XO; Zhu et al., 2004). This compound decreases oxidative stress, improves the antioxidant status and inhibits liver cell apoptosis in STZ-induced type 1 diabetic rats (Dias et al., 2005; Babujanarthanam et al., 2011; Bakhshaeshi et al., 2012). It also alleviates hepatic fat accumulation in C57/BL6J mice fed a Western-style diet (Kobori et al., 2011). Recently, quercetin was shown to regulate hepatic inflammatory gene expression in mice fed a high-fat diet (Boesch-Saadatmandi et al., 2012). Allopurinol as an XO inhibitor with antioxidant properties significantly reduces systemic oxidative stress in patients with cirrhosis (Spahr et al., 2007) and prevents cypermethrin-induced hepatic oxidative stress in rats (Giray et al., 2001). More recently, allopurinol was found to suppress hemozoin-induced NLRP3 inflammasome activation and IL-1β production (Griffith et al., 2009). In a previous study, we showed that quercetin and allopurinol reduced total cholesterol (TC) and triglycerides (TG) levels in the serum of fructose-fed rats (Hu et al., 2009), and suppress renal NLRP3 inflammasome activation in STZ-treated rats (Wang et al., 2012). However, the molecular mechanisms underlying the protective actions of quercetin and allopurinol against hepatic steatosis in type 1 diabetes are not yet understood.
In the current study, we showed that quercetin and allopurinol markedly inhibit the overexpression of hepatic TXNIP and the activation of NLRP3 inflammasome and reduced the production of ROS in both STZ-induced type 1 diabetic rats and in hepatocytes, BRL-3A and HepG2, exposed to high glucose levels. These effects were paralleled by changes in the expression of hepatic PPARα, SREBP-1c, SREBP-2, fatty acid synthase (FAS) and liver X receptor α (LXRα) and an improvement in the liver. Therefore, these results provide new insights into the mechanisms underlying the pharmacological effects of quercetin and allopurinol on the NAFLD associated with type 1 diabetes in rats.
Methods
Experimental animals, design and sample collection
Male Sprague-Dawley rats ranging from 8 to 10 weeks old (200–220 g weight) were purchased from the Experimental Animal Centre of Nanjing Medical University (Nanjing, China). They were individually maintained in a controlled environment (12:12 h light/dark cycle with a temperature of 22 ± 2°C and a relative humidity of 55%). Water and food were provided ad libitum. Animal welfare and experimental procedures were carried out in accordance with the Guide for the Care and Use of Laboratory Animals (The Ministry of Science and Technology of the People's Republic of China, 2006) and the related ethical regulations of our university. All studies involving animals are reported in accordance with the ARRIVE guidelines for reporting experiments involving animals (Kilkenny et al., 2010; McGrath et al., 2010). All efforts were made to minimize animal suffering and reduce the number of animals used. Rats were deprived of food overnight. STZ, 55 mg kg−1 (Sigma-Aldrich, St Louis, MO, USA) was administered by a single i.p. injection, after it had been dissolved in 0.1 M citrate buffer (pH 4.4) over 30 s in a dark environment, while normal control animals received only citrate buffer. Then 72 h after the STZ injection, blood samples were collected from the tail of a rat deprived of food overnight, left to clot in pre-iced tubes and centrifuged at 3000× g, 4°C for 5 min to obtain serum. Serum glucose levels were estimated using a commercial glucose kit (JianCheng Bioengineering Institute, Nanjing, China). The rats, whose fasting blood glucose levels were above 2.50 mg·mL−1, were considered to be diabetic. After successful induction of diabetes, rats were further randomly divided into five subgroups (n = 8): diabetic control treated with water; diabetic rats treated with 25, 50 and 100 mg·kg−1 quercetin (>98%, Sigma-Aldrich); and 10 mg·kg−1 allopurinol (>95%, Sigma-Aldrich) respectively. Quercetin and allopurinol were suspended in water and disrupted by ultrasound and then immediately administered via intragastric gavage (1 mL·100 g−1 body weight). The treatment was started on day 4 after STZ injection by gavage once daily at 9:00–10:00 h for the subsequent 7 weeks. Body weights as well as blood glucose levels of rats were recorded before and after STZ administration and each week during drug treatment.
At the end of drug treatment, all animals were deprived of food but not water until the following morning. Blood was collected and serum was obtained as stated above. Rats were killed via decapitation. Liver tissues were quickly dissected and weighed (for calculation of the relative weight of the liver, the ratio of wet liver weight:body weight). These serum and liver samples were then stored at −80°C for further analyses.
Cell culture, treatment and transfection
A normal rat hepatocyte line (BRL-3A) and human liver tumour cell line (HepG2) were purchased from Shanghai Cell Biology, Chinese Academy of Sciences (Shanghai, China). Cells were cultured in medium containing low-glucose DMEM (5.5 mM, Wisent Technologies, St-Bruno, QC, Canada) and 10% FBS (Wisent Technologies) in a humidified atmosphere containing 5% CO2 at 37°C.
BRL-3A and HepG2 cells were grown to confluence and made quiescent by incubation in serum-free DMEM for 12 h. Then, the cells were maintained at low glucose (5.5 mM, as control) or high glucose (30 mM) in the presence or absence of 10–20 μM quercetin, 100 μM allopurinol or 20 μM of the caspase-1-specific inhibitor Ac-YVAD-CMK (Ac-Tyr-Val-Ala-Asp-chloromethylketone; Taize, Beijing, China) for 24, 48 or 72 h, as indicated in the text.
For the small interfering RNA (siRNA) assay, BRL-3A and HepG2 cells were transiently transfected with 100 nM of control siRNA or TXNIP siRNA (GenePharma, Shanghai, China) using Lipofectamine RNAiMAX (Invitrogen, Carlsbad, CA, USA), according to the manufacturer's instructions. The sequences of siRNA were listed in the Supporting Information Table S1. After 48 h, the efficiency of RNA interference was evaluated by measuring mRNA and protein levels of TXNIP. Subsequently, the transfected cells were incubated with low glucose (5.5 mM) or high glucose (30 mM) in the presence or absence of quercetin and allopurinol as above. In all experiments, cell lysates and culture supernatants were collected, and total cellular protein or RNA was extracted. Experiments were repeated at least four times.
Quercetin, allopurinol and caspase-1 inhibitor were dissolved in DMSO at the respective stock concentrations. The final concentrations of DMSO in the medium were less than 0.1%. Dosages of these agents were selected based on our preliminary experiments and those of others (Yao et al., 2007; Lanaspa et al., 2012).
Transaminase assay
For rat hepatic function examination, serum levels of alanine transaminase (ALT), aspartate transaminase (AST) and alkaline phosphatase (AKP) were determined using common biochemical kits (JianCheng Bioengineering Institute).
Lipid analyses
Rat liver tissues were weighed and extracted as described previously (Bligh and Dyer, 1959). The chloroform layer and serum samples were used to determine TC, TG and non-esterified fatty acids (NEFA) levels by use of common commercially-available biochemical kits (JianCheng Bioengineering Institute).
Measurement of liver O2•− and H2O2 levels, and intracellular ROS production
Levels of O2•− in liver tissue were measured by the lucigenin chemiluminescence method (Liu et al., 2008). Briefly, liver tissues were weighed and homogenized in 10 w v-1 homogenization buffer (pH 7.4) containing 20 mM of HEPES and 10 mM EDTA. After centrifugation at 1000× g for 10 min, an aliquot of the supernatant was incubated with lucigenin (5 μM; Sigma-Aldrich) in a Krebs–HEPES buffer (pH 7.4) for 2 min at 37°C. Light emission was measured using TECAN Infinite 200 (Tecan Group Ltd, Mannedorf, Switzerland), and values were expressed as mean light unit (MLU) min−1 mg-1 protein. Specificity for superoxide anion was determined by adding superoxide dismutase (350 U·mL−1) to the incubation medium. Protein determination was measured with the Bradford method, with BSA as standard (the same as follows). Liver tissues were weighed and homogenized in 10 w v-1 normal saline and incubated with an equal volume of chilled methanol at 4°C for 1 h. The mixture was centrifuged at 10 000× g for 30 min and the supernatant was used for H2O2 estimation by use of an assay kit (Beyotime Biotechnology, Haimen, China). Data are expressed as μmol mg−1 protein.
Intracellular ROS levels were detected using fluorescence probe 2′,7′-dichlorofluorescin diacetate (DCFH-DA; Sigma-Aldrich), as described previously (Lee et al., 2010). The cells were seeded on a 96-well black, clear-bottom microplate. After the treatment as above, cells were washed twice with PBS and then incubated in PBS containing 10 μM DCFH-DA for 30 min at 37°C. Cells were visualized at ×200 magnification with an epifluorescence microscope (Sunny Company, Yuyao, China). Fluorescence intensity was measured at 530 nm with an excitation wavelength of 485 nm using a fluorescence plate reader (Tecan Group Ltd).
Liver XO and xanthine dehydrogenase (XDH) activity assay
Liver activity of XO and XDH was assayed as described previously (Zhao et al., 2006). Weighed liver tissues were homogenized in 10 w v-1 50 mM cold potassium phosphate buffer (pH 7.4) containing 1 mM EDTA, 10 mM DTT and 1 mM PMSF, and centrifuged at 25 000× g for 30 min at 4°C. The supernatant was used for enzymatic activity determination. XDH activity was calculated by subtracting XO activity from total activity of XO + XDH.
Measurement of serum, liver and culture supernatant IL-1β and IL-18 levels
Weighed rat liver samples were immediately placed in 10 w v-1 of a protease inhibitor cocktail containing 10 nM EDTA, 2 mM PMSF, 0.1 mg·mL−1 soybean trypsin inhibitor, 1.0 mg·mL−1 BSA and 0.002% sodium azide in isotonic PBS (pH 7.0). Tissues were disrupted with a tissue homogenizer, and lysates were incubated at 4°C for 2 h. Samples were clarified by two rounds of centrifugation at 12 500× g for 10 min at 4°C. The supernatants were collected for assays. IL-1β and IL-18 levels in serum, liver and cell culture supernatant were determined by elisa kits (R&D Systems Inc., Minneapolis, MN, USA) following the manufacturer's instructions.
Liver histological analysis
Rat liver tissues were fixed in 10% neutral buffered formalin and then embedded in paraffin. Specimens were cut in 7 μm thick sections on a rotary microtome and mounted on APES-coated glass slides. Each section was deparaffinized in xylene, rehydrated in decreasing concentrations of alcohol in water and stained with haematoxylin-eosin reagent (Sigma-Aldrich) and scored by a blinded histopathologist according to the NAFLD activity score (NAS) system (Kleiner et al., 2005). To visualize neutral lipids, liver tissues were frozen in Tissue-Tek O.C.T. compound (Sakura Finetek USA Inc., Torrance, CA, USA) and sections were stained with oil-red O reagent (Sigma-Aldrich) for 5–10 min. After being washed with 60% isopropyl alcohol, the sections were re-stained with haematoxylin.
RNA preparation and analysis
Total RNA was isolated from rat liver tissues using Trizol reagent (Invitrogen), and, following the manufacturer's protocol, was used to evaluate mRNA expression of TXNIP, NLRP3, ASC, caspase-1, PPARα, SREBP-1c, SREBP-2, FAS, LXRα and GAPDH. A 1 μg sample of total RNA was used for cDNA synthesis by moloney murine leukaemia virus reverse transcriptase kit (Promega Co., Madison, WI, USA). Relative quantities of PCR products were calculated by normalization to the amount of GAPDH mRNA levels.
For quantitative real-time PCR (qRT-PCR), total RNA isolation and reverse transcription from TXNIP siRNA-transfected BRL-3A and HepG2 cells was done as above. PCR reactions were performed using 2 μL cDNA and 10 μL iQ SYBR Green Supermix (Bio-Rad Laboratories, Hercules, CA, USA), 5 pmol of forward primer, 5 pmol of reverse primer and DEPC-treated H2O to 20 μL in a CFX96 Real-Time PCR Detection System (Bio-Rad) as follows: 95°C for 3 min, then 40 cycles at 95°C for 5 s and annealing/extension at 60°C for 30 s with a plate read after each cycle. The data were collected and analysed using the comparative threshold cycle method, and GAPDH expression was used as the reference gene.
The sequences of gene-specific PCR primers were listed in the Supporting Information Tables S2 and S3.
Western blot analysis
Rat liver tissues, BRL-3A and HepG2 cell lysates were prepared by incubation on ice with lysis buffer (10 mM Tris-HCl, 1 mM EDTA and 250 mM sucrose, pH 7.4, containing 15 μg·mL−1 aprotinin, 5 μg·mL−1 leupeptin, 0.1 mM PMSF, 1 mM NaF and 1 mM Na3VO4) and centrifuged at 3000× g for 15 min at 4°C. The supernatant was again centrifuged at 12 000× g for 20 min at 4°C. After resolution of sample protein (equal loading for each sample) by 10% SDS-PAGE, the protein was electrophoretically transferred onto PVD membranes (Millipore, Shanghai, China). The primary antibodies used in this study included: anti-TXNIP (sc-67134, dilution 1:500), anti-NLRP3 (sc-34410, dilution 1:500), anti-SREBP-1c (sc-367, dilution 1:300), anti-FAS (sc-1024, dilution 1:500) and anti-GAPDH (sc-25778, dilution 1:200) purchased from Santa Cruz Biotechnology Inc. (Santa Cruz, CA, USA), as well as anti-ASC (ab64808, dilution 1:500), anti-caspase-1 (ab17820, dilution 1:1000), anti-PPARα (ab8934, dilution 1:500), anti-SREBP-2 (ab30682, dilution 1:1000) and anti-LXRα (ab41902, dilution 1:1000) purchased from Abcam (Cambridge, MA, USA). Blots were incubated overnight at 4°C in primary antibody in 5% milk followed by goat anti-rabbit secondary antibody (sc-2004, dilution 1:5000, Santa Cruz Biotechnology Inc.) or donkey anti-goat secondary antibody (sc-2020, dilution 1:5000, Santa Cruz Biotechnology Inc.) Immunoreactive bands were visualized by enhanced chemiluminescence (Cell Signaling, Beverly, MA, USA) and quantified via densitometry using the SensiAnsys software (Peiqing Technology, Shanghai, China).
Statistical analysis
Results are expressed as the mean ± SEM. Statistical analysis was performed by a one-way anova followed by a Student–Newman–Keul's test. Differences were considered significant at P < 0.05.
Results
Effects of quercetin and allopurinol on body weight, blood glucose and hepatic function in STZ-induced diabetic rats
Body weight and blood glucose levels of experimental rats are shown in Table 1. At week 7, after STZ injection, body weights were lower and blood glucose levels were significantly higher in diabetic rats than in the normal control group. Oral administration of quercetin significantly increased body weight and decreased blood glucose levels in a dose-dependent manner in STZ-treated rats compared with the diabetic control group. Furthermore, STZ-treated rats developed liver injury as indicated by increased serum levels of ALT, AST and AKP (Figure 1A–C), which were restored by 50 and 100 mg·kg−1 quercetin. Quercetin at 25 mg·kg−1 also decreased serum levels of AKP in diabetic rats. Allopurinol at 10 mg·kg−1 reversed these abnormalities in this model. Of note, there were no significant differences in body weight, blood glucose levels and serum ALT levels between the normal control group and the 100 mg·kg−1 quercetin- or 10 mg·kg−1 allopurinol-treated diabetic groups (P > 0.05). These data suggest that 7 weeks of treatment with quercetin or allopurinol effectively prevented these changes in STZ-induced diabetic rats.
Table 1.
Effects of quercetin and allopurinol on body weight, relative weight percentage of liver and blood glucose levels in STZ-induced diabetic rats
| Group | Dose (mg·kg−1) | Body weight (g) | Relative weight percentage of liver (%) | Blood glucose (mmol L−1) |
|---|---|---|---|---|
| Normal control | – | 442.2 ± 6.2 | 2.57 ± 0.09 | 4.90 ± 0.12 |
| STZ control | – | 212.2 ± 16.2+++ | 5.26 ± 0.18+++ | 15.48 ± 1.08+++ |
| STZ + quercetin | 25 | 281.3 ± 10.7* | 5.05 ± 0.11 | 9.53 ± 0.79*** |
| STZ + quercetin | 50 | 368.5 ± 28.1*** | 4.61 ± 0.20* | 9.01 ± 1.26*** |
| STZ + quercetin | 100 | 368.4 ± 31.8*** | 4.01 ± 0.21*** | 7.88 ± 1.25*** |
| STZ + allopurinol | 10 | 362.2 ± 24.6*** | 3.82 ± 0.08*** | 7.55 ± 0.92*** |
These results are expressed as mean ± SEM, n = 8. Normal control, control rats; STZ control, STZ-treated rats; STZ + quercetin, STZ-treated rats fed with quercetin; STZ + allopurinol, STZ-treated rats fed with allopurinol.
P < 0.001 compared to normal control group,
P < 0.05, **P < 0.01,
P < 0.001 compared to STZ control group.
Figure 1.

Effects of quercetin and allopurinol on hepatic function and pathology in STZ-induced diabetic rats. Biochemical analyses showing serum ALT (A), AST (B) and AKP (C) levels at week 7 after STZ injection in different groups of rats as indicated. Histology of liver sections in normal control (D), STZ control (E), STZ plus 25 mg·kg−1 quercetin (F), STZ plus 50 mg·kg−1 quercetin (G), STZ plus 100 mg·kg−1 quercetin (H) and STZ plus 10 mg·kg−1 allopurinol (I) was examined by staining with haematoxylin and eosin (magnification, ×200). Histopathological assessment of steatosis (J), lobular inflammation (K), hepatocyte ballooning (L) and NAFLD activity score (NAS) (M) was presented in these groups. The data are expressed as the means ± SEM (n = 8). +++P < 0.001 versus normal control; **P < 0.01, ***P < 0.001 versus diabetic control.
Quercetin and allopurinol alleviate the hepatic steatosis in STZ-induced diabetic rats
As summarized in Table 1 and illustrated in Figure 1, the relative weight of the liver, steatosis, inflammation and hepatocyte ballooning scores were significantly elevated in the STZ-treated rats and, consequently, the NAS increased compared to the normal control group. Moreover, increased serum and hepatic levels of TC, TG and NEFA were observed in the STZ-induced diabetic rats (Figure 2A–F). Quercetin at 50 and 100 mg·kg−1 and allopurinol at 10 mg·kg−1 effectively decreased the relative weight of the liver (Table 1), alleviated the histological changes (Figure 1) and reduced the levels of the three types of lipids in the liver of diabetic rats (Figure 2D–F). These results were further supported by an improvement in the amount of lipid deposited in hepatocytes in diabetic rats receiving quercetin and allopurinol, as revealed by oil red O-stain analysis (Figure 2G–L). There were no significant differences in TG and TC levels in serum and liver, and NEFA levels in serum between the normal control group and the 100 mg·kg−1 quercetin- or 10 mg·kg−1 allopurinol-treated diabetic groups (P > 0.05).
Figure 2.

Quercetin and allopurinol reduce hepatic steatosis in STZ-induced diabetic rats. Biochemical analyses showing serum levels of TC (A), TG (B) and NEFA (C), and liver levels of TC (D), TG (E) and NEFA (F) at week 7 after STZ injection in different groups of rats as indicated. The data are expressed as the means ± SEM (n = 8). +++P < 0.001 versus normal control; *P < 0.05, **P < 0.01, ***P < 0.001 versus diabetic control. Representative micrographs demonstrated liver histology in different groups of rats. Liver sections were stained with oil-red O reagent (magnification, ×400). Normal control (G), STZ control (H), STZ plus 25 mg·kg−1 quercetin (I), STZ plus 50 mg·kg−1 quercetin (J), STZ plus 100 mg·kg−1 quercetin (K) and STZ plus 10 mg·kg−1 allopurinol (L).
Quercetin and allopurinol suppress hepatic oxidative stress and TXNIP in STZ-induced diabetic rats and high glucose-exposed BRL-3A and HepG2 cells
Oxidative stress is involved in inflammation and lipid metabolism disorders (Dias et al., 2005); therefore, we measured hepatic oxidative stress in STZ-induced diabetic rats. XO and XDH levels as well as the ratio of XO:XDH were significantly increased in the liver of diabetic rats (Figure 3A–C). XO is thought to be a major source of ROS production. Hepatic accumulation of O2•− and H2O2 production were observed simultaneously in this animal model (Figure 3D,E). As expected, quercetin at 50 and 100 mg·kg−1 and allopurinol at 10 mg·kg−1 significantly inhibited XO and XDH activity, decreased the XO:XDH ratio and reduced O2•− levels in the liver of diabetic rats (Figure 3A–D). In addition, 100 mg·kg−1 quercetin and 10 mg·kg−1 allopurinol effectively decreased hepatic H2O2 levels in this animal model (Figure 3E).
Figure 3.

Quercetin and allopurinol suppress hepatic oxidative stress and TXNIP in STZ-induced diabetic rats. Biochemical analyses showing hepatic levels of XO (A) and XDH (B), the ratio of XO:XDH (C), hepatic levels of O2•− (D) and H2O2 (E) at week 7 after STZ injection in different groups of rats as indicated. The data are expressed as the means ± SEM (n = 8). ++P < 0.01, +++P < 0.001 versus normal control; *P < 0.05, **P < 0.01, ***P < 0.001 versus diabetic control. Representative RT-PCR (F) or Western blot (G) results and graphic presentation showed hepatic TXNIP mRNA and protein levels at week 7 after STZ injection in different groups of rats respectively. The relative mRNA and protein levels were determined after normalization with GAPDH. The data are expressed as the means ± SEM (n = 4). +++P < 0.001 versus normal control; **P < 0.01, ***P < 0.001 versus diabetic control.
TRX and its endogenous inhibitor TXNIP can change the cellular reduction-oxidation balance state (Muoio, 2007). Thus, we measured the hepatic expression of TXNIP in STZ-induced diabetic rats and found that TXNIP mRNA and protein levels were significantly increased (Figure 3F,G), in parallel with the elevation of hepatic ROS. Quercetin at 50 and 100 mg·kg−1 and allopurinol at 10 mg·kg−1 down-regulated hepatic TXNIP expression levels in diabetic rats (Figure 3F,G).
Next, we assessed the ROS production and TXNIP expression in hepatocytes treated with high glucose in vitro. Consistent with the above in vivo data, 24 h stimulation with 30 mM glucose significantly increased intracellular ROS levels in BRL-3A and HepG2 cells compared with control group (5.5 mM glucose), an effect restored by treatment with quercetin at 10 μM (BRL-3A) and 20 μM (HepG2), as well as allopurinol at 100 μM (Figure 4A,B). Furthermore, the high glucose stimulation led to a marked increase in the expression of the lysate TXNIP protein in BRL-3A cells for 48 h and HepG2 cells for 24 h; these effects were completely prevented by the presence of quercetin at 10 μM (BRL-3A) and 20 μM (HepG2), and allopurinol at 100 μM (Figure 4C). These in vivo and in vitro results demonstrate that quercetin and allopurinol suppress hepatic oxidative stress and TXNIP overexpression under high glucose conditions.
Figure 4.

Quercetin and allopurinol reduce ROS production and TXNIP expression in high glucose (HG)-exposed hepatocyte cells. BRL-3A and HepG2 cells were incubated with HG (30 mM) in the presence and absence of quercetin and allopurinol for the indicated time. The intracellular ROS levels were measured using the fluorescent probe DCFH-DA. The fluorescence images were obtained by a fluorescence microscopy (A) (magnification, ×200). The representative results from three independent experiments are shown. Quantification of the fluorescent intensity was detected using a fluorescence plate reader (B) (n = 8). Cellular lysate TXNIP expression levels were analysed by Western blot (C) (n = 4). The relative protein levels were determined after normalization with GAPDH. The data are expressed as the means ± SEM. +++P < 0.001 versus control; **P < 0.01, ***P < 0.001 versus HG control.
Quercetin and allopurinol decrease IL-1β levels and the NLRP3 inflammasome activation in a TXNIP-dependent manner in STZ-induced diabetic rat liver and high glucose-exposed BRL-3A and HepG2 cells
In parallel with the increased ROS generation and oxidative stress, hepatic inflammatory cell infiltration was observed in STZ-induced diabetic rats, which was ameliorated by treatment with quercetin and allopurinol (Figure 1D–I). To investigate the inflammatory response in this model, we measured serum and hepatic IL-1β and IL-18 levels. Serum and hepatic levels of IL-1β and IL-18 were significantly increased in STZ-induced diabetic rats (Figure 5A–D). IL-1β and IL-18 are cleaved from pro-IL-1β and pro-IL-18 by caspase-1, which is activated by the NLRP3 inflammasome complex (Tschopp and Schroder, 2010). Thus, we examined the expression levels of the NLRP3 inflammasome and found that NLRP3, ASC and caspase-1 were up-regulated at both the mRNA and protein level in the liver of diabetic rats compared with the normal control group (Figure 5E–L). Quercetin at 50 and 100 mg·kg−1, as well as 10 mg·kg−1 allopurinol, prevented the overexpression of hepatic NLRP3, ASC and caspase-1 and reduced the hepatic IL-1β and IL-18 levels in these diabetic rats (Figure 5A–L).
Figure 5.

Quercetin and allopurinol reduce IL-1β and IL-18 levels, and inhibit hepatic NLRP3 inflammasome activation in STZ-induced diabetic rats. Biochemical analyses showed serum and liver levels of IL-1β (A, C) and IL-18 (B, D) at week 7 after STZ injection in different groups of rats as indicated (n = 8). Representative RT-PCR results (E) and graphic presentation shows hepatic mRNA levels of NRLP3 (F), ASC (G) and caspase-1 (H) at week 7 after STZ injection in different groups of rats as indicated. Representative Western blot results (I) and graphic presentation shows hepatic protein levels of NLRP3 (J), ASC (K) and caspase-1 (L) in different groups of rats as indicated. Relative mRNA and protein levels of NLRP3, ASC and caspase-1 were determined after normalization with GAPDH (n = 4). The data are expressed as the means ± SEM. +++P < 0.001 versus normal control; *P < 0.05, **P < 0.01, ***P < 0.001 versus diabetic control.
The in vitro results show that, in comparison to the control group (5.5 mM glucose), high glucose (30 mM) stimulation significantly up-regulated lysate NLRP3, ASC and caspase-1 protein levels in BRL-3A cells for 48 h and HepG2 cells for 24 h, and increased culture supernatant IL-1β levels in these two types of hepatocytes for 72 h. The levels of these compounds were significantly restored by the treatment with 10 μM (BRL-3A) and 20 μM (HepG2) quercetin, as well as 100 μM allopurinol (Figure 6A,B). However, high glucose stimulation did not affect the IL-18 levels in the culture supernatant of BRL-3A and HepG2 cells (data not shown).
Figure 6.

Quercetin and allopurinol down-regulate the NLRP3 inflammasome activation to reduce IL-1β in a TXNIP-dependent manner in high glucose (HG)-exposed hepatocyte cells. BRL-3A and HepG2 cells were incubated with HG (30 mM) in the presence or absence of quercetin and allopurinol for the indicated time respectively. Cell culture supernatant was used to measure IL-1β levels by elisa (A) (n = 8), and cellular lysate was used to measure NRLP3, ASC and caspase-1 protein levels by Western blot (B) (n = 4). The data are expressed as the means ± SEM. +++P < 0.001 versus control; *P < 0.05, **P < 0.01, ***P < 0.001 versus HG control. Moreover, BRL-3A and HepG2 cells were transfected with control siRNA or TXNIP siRNA for 48 h and the effect of RNA interference was evaluated by qRT-PCR (C) (n = 4). The data are expressed as the means ± SEM. ***P < 0.001 versus control siRNA. siRNA-treated hepatocyte cells were incubated with HG (30 mM) in the presence or absence of quercetin and allopurinol for the indicated time respectively. Cellular lysate caspase-1 and TXNIP protein levels (D) were measured by Western blot (n = 4) and culture supernatant IL-1β levels (E) were assayed by elisa (n = 8) in siRNA-treated cells. The data are expressed as the means ± SEM. +++P < 0.001 versus control; *P < 0.05, **P < 0.01, ***P < 0.001 versus HG + control siRNA.
Recently, TXNIP was found to bind and activate the NLRP3 inflammasome in high glucose-treated islet cells (Zhou et al., 2010). To verify that the inhibition of hepatic NLRP3 inflammasome activation by quercetin and allopurinol was due to the down-regulation of hepatic TXNIP, BRL-3A and HepG2 cells were transfected with siRNA against TXNIP for 48 h and then co-incubated with high glucose and quercetin or allopurinol as above. The silencing effect of TXNIP siRNA on its corresponding endogenous target was verified by qRT-PCR assay (Figure 6C). TXNIP silencing prevented the high glucose-induced overexpression of lysate caspase-1 and secretion of IL-1β in BRL-3A and HepG2 cells (Figure 6D,E), indicating that hepatic TXNIP may mediate the activation of NLRP3 inflammasome in high glucose-exposed cells. As expected, quercetin and allopurinol had no effects in this cell model. These results confirm that down-regulation of hepatic TXNIP is involved in the inhibition of hepatic NLRP3 inflammasome by quercetin and allopurinol under high glucose conditions.
Quercetin and allopurinol up-regulate PPARα in STZ-induced diabetic rat liver and high glucose-exposed BRL-3A and HepG2 cells
TXNIP is reported to negatively regulate PPARα transcriptional activity (Oka et al., 2009). Next, we investigated the expression levels of hepatic PPARα in STZ-induced diabetic rats. Compared with normal control, mRNA and protein levels of PPARα were decreased in the liver of diabetic rats, which were then effectively restored by 50 and 100 mg·kg−1 quercetin and 10 mg·kg−1 allopurinol (Figure 7A,B). These data are consistent with the reduction in the hepatic accumulation of lipids observed in Figure 2.
Figure 7.
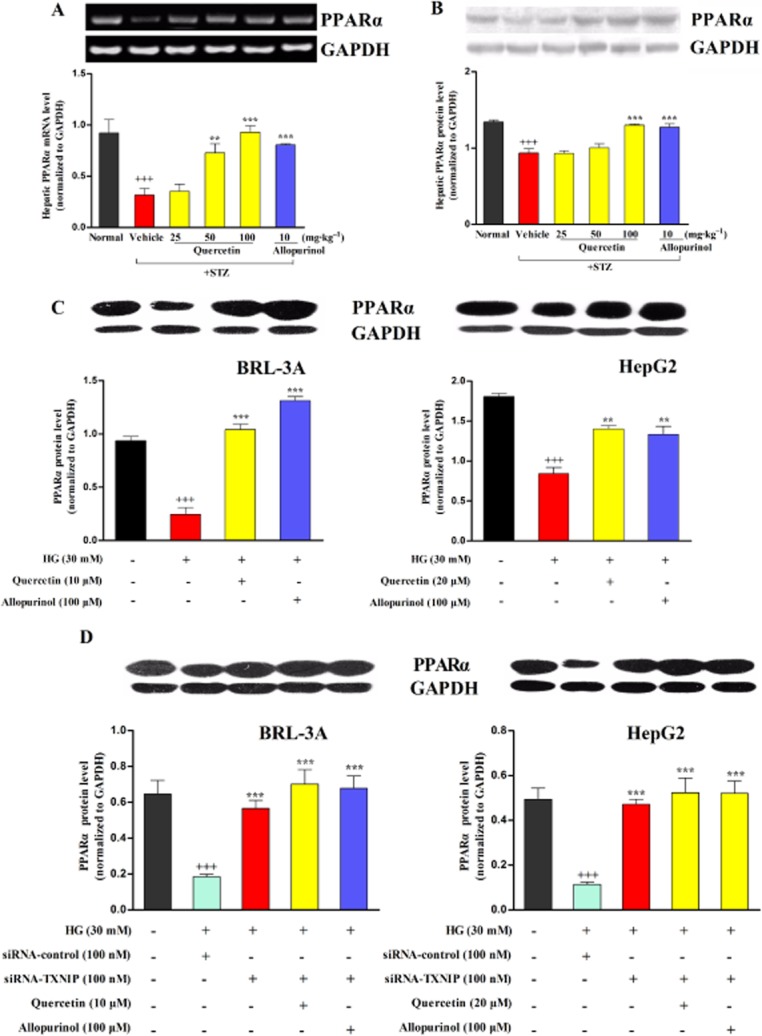
Quercetin and allopurinol up-regulate PPARα in STZ-induced diabetic rat liver and high glucose (HG)-exposed hepatocyte cells. Representative RT-PCR results and graphic presentation showed hepatic mRNA levels of PPARα (A) at week 7 after STZ injection in different groups of rats as indicated. Representative Western blot results and graphic presentation showed hepatic protein levels of PPARα (B) in different groups of rats as indicated. The data are expressed as the means ± SEM (n = 4). +++P < 0.001 versus normal control; **P < 0.01, ***P < 0.001 versus diabetic control. Hepatocyte cells BRL-3A and HepG2 were cultured with or without HG (30 mM) or quercetin and allopurinol in the presence or absence of siRNA TXNIP transfection for the indicated time, and then cellular lysate was used to measure PPARα by Western blot (C and D) (n = 4). The data are expressed as the means ± SEM. +++P < 0.001 versus control; **P < 0.01, ***P < 0.001 versus HG control. In siRNA TXNIP transfection experiments, the data are expressed as the means ± SEM. +++P < 0.001 versus control; ***P < 0.001 versus HG + control siRNA.
Compared with the control group (5.5 mM), high glucose stimulation significantly decreased lysate PPARα protein levels in BRL-3A and HepG2 for 72 h; these reduced levels were significantly up-regulated in the presence of 10 μM (BRL-3A) and 20 μM (HepG2) quercetin, as well as 100 μM allopurinol (Figure 7C). Furthermore, RNAi knockdown of TXNIP expression blocked the high glucose-induced down-regulation of lysate PPARα in BRL-3A and HepG2 cells (Figure 7D). Co-treatment with quercetin or allopurinol was unable to alter lysate PPARα expression in TXNIP-siRNA transfected hepatocytes subjected to high glucose stimulation for 72 h (Figure 7D). These in vivo and in vitro results suggest that quercetin and allopurinol ameliorate diabetic hepatic steatosis by up-regulating the hepatic TXNIP-PPARα pathway.
Quercetin and allopurinol suppress SREBP-1c, SREBP-2, FAS and LXRα in STZ-induced diabetic rat liver and high glucose-exposed BRL-3A and HepG2 cells
Activation of caspase-1 induces an overexpression of SREBPs (Gurcel et al., 2006) and the expression of SREBPs is controlled by PPARα (Oka et al., 2009). Thus, we determined the expression levels of hepatic lipid metabolism-related genes SREBP-1c and SREBP-2, as well as FAS and LXRα in STZ-induced diabetic rats. Compared with normal control, mRNA and protein levels of SREBP-1c, SREBP-2, FAS and LXRα were increased in the liver of diabetic rats, and these increased levels were effectively restored to control levels by 50 and 100 mg·kg−1 quercetin and 10 mg·kg−1 allopurinol (Figure 8A–J). Moreover, in the in vitro hepatocytes, 10 μM (BRL-3A) and 20 μM (HepG2) quercetin, as well as 100 μM allopurinol, restored the high glucose-induced significant elevation of lysate SREBP-1c, SREBP-2, FAS and LXRα protein levels to normal levels in BRL-3A for 48 h and HepG2 for 24 h (Figure 8K).
Figure 8.

Quercetin and allopurinol suppress SREBP-1c, SREBP-2, FAS and LXRα in STZ-induced diabetic rat liver and high glucose (HG)-exposed hepatocyte cells. Representative RT-PCR (A) or Western blot (B) results and graphic presentation showed hepatic mRNA or protein levels of SREBP-1c (C and G), SREBP-2 (D and H), FAS (E and I) and LXRα (F and J) at week 7 after STZ injections in different groups of rats as indicated respectively. The data are expressed as the means ± SEM (n = 4). +++P < 0.001 versus rat normal control; *P < 0.05, **P < 0.01, ***P < 0.001 versus rat diabetic control. Moreover, BRL-3A and HepG2 cells were cultured with or without HG (30 mM) or quercetin and allopurinol in the presence or absence of caspase-1 inhibitor Ac-YVAD-CMK (20 uM) for the indicated time, and then cellular lysate was used to measure caspase-1, SREBP-1c, SREBP-2, FAS and LXRα protein levels (K and L) by Western blot (n = 4). The data are expressed as the means ± SEM. +++P < 0.001 versus cell control; **P < 0.01, ***P < 0.001 versus cell HG control or HG + Ac-YVAD-CMK.
Next, we explored the role of caspase-1 in the responses of hepatocyte cells to high glucose exposure by use of its specific inhibitor Ac-YVAD-CMK. Co-incubation of the caspase-1 inhibitor with high glucose for 48 h (BRL-3A) or 24 h (HepG2), blocked the high glucose-induced activation of caspase-1 in the cell lysate (Figure 8L) along with the inducible up-regulation of lysate SREBP-1c and SREBP-2, but not FAS and LXRα in these hepatocytes (Figure 8L), indicating that caspase-1 activation mediated the overexpression of SREBPs under high glucose conditions. The addition of 10 μM (BRL-3A) and 20 μM (HepG2) quercetin and 100 μM allopurinol blocked the stimulating effects on the SREBPs, but clearly down-regulated the cell lysate FAS and LXRα in hepatocyte cells co-incubated with caspase-1 and high glucose (Figure 8L). These results indicate that the effects of quercetin and allopurinol on hepatic lipid accumulation under diabetic conditions may be partly mediated by modulation of the hepatic TXNIP-NLRP3 inflammasome-SREBPs pathway.
Discussion and conclusions
The results of this study confirm that quercetin and allopurinol have the ability to reduce blood glucose levels and the induction of ROS, and alleviate hepatic oxidative stress, inflammation and steatosis, hallmarks of the spectrum of NAFLD, in STZ-induced type 1 diabetic rats. More importantly, an up-regulation of hepatic TXNIP expression was found in diabetic rats and high glucose-exposed hepatic parenchymal cells, consistent with changes in the expression of genes involved in hepatic NLRP3 inflammasome activation and lipid metabolism. These results were confirmed in hepatic cell models with TXNIP siRNA interference-mediated gene silencing, and caspase-1 inhibitor treatment. Thus, TXNIP overexpression may directly mediate inflammation and lipid accumulation under diabetic conditions. Furthermore, our results indicate that quercetin and allopurinol ameliorated the disorders associated with NAFLD by suppressing the overexpression of hepatic TXNIP.
Oxidative stress is implicated in promoting a low-grade systemic inflammation in diabetes and NASH (Marra et al., 2008). TXNIP, an essential protein, was recently found to directly activate NLRP3 inflammasome upon oxidative stress (Zhou et al., 2010). High glucose-induced TXNIP overexpression together with ROS-dependent dissociation from TRX, switches the function of TXNIP from TRX repressor to NLRP3 inflammasome activator (Schroder et al., 2010). Activation of NLRP3 inflammasome induces caspase-1 hyperactivity, which cleaves its substrates pro-IL-1β and pro-IL-18 into their biologically active forms (Tschopp and Schroder, 2010). In the present study, we showed that hepatic NLRP3 inflammasome was activated in parallel with the induction of hepatic ROS and the overexpression of TXNIP, and this subsequently led to IL-1β and IL-18 release in the liver and inflammation in STZ-induced diabetic rats. This NLRP3 inflammasome activation and IL-1β secretion was confirmed in high glucose-exposed BRL-3A and HepG2 cells. Furthermore, TXNIP siRNA blocked the high glucose-induced NLRP3 inflammasome activation and increased IL-1β secretion in BRL-3A and HepG2 cells. These results are consistent with those from previous studies, which showed that NLRP3 inflammasome activation and IL-1β secretion were reduced in THP-1 cells deficient in TXNIP (Zhou et al., 2010), and IL-1β levels suppressed in diabetic retina after knockdown of TXNIP (Devi et al., 2012). Therefore, an increased expression of TXNIP may account for the activation of NLRP3 inflammasome and inflammation observed in diabetic conditions. IL-18 is mainly produced in the liver by activated Kupffer cells (Tsutsui et al., 2000). Of note, high glucose stimulation did not induce IL-18 secretion in BRL-3A and HepG2 cells, which had been either untreated or transfected with TXNIP siRNA.
Recently, allopurinol was confirmed to suppress hemozoin-induced NLRP3 inflammasome activation and IL-1β production (Griffith et al., 2009). In the present study, quercetin and allopurinol were found to reduce the activation of the NLRP3 inflammasome as well as the over-production of IL-1β in STZ-induced diabetic rats and high glucose-exposed BRL-3A and HepG2 cells, resulting in an amelioration of the hepatic inflammation response. Interestingly, they had no inhibitory effects on high glucose-induced activation of NLRP3 inflammasome and IL-1β secretion in TXNIP siRNA transfected-BRL-3A and HepG2 cells. These results indicate that suppression of the hepatic TXNIP–NLRP3 inflammasome pathway is required for quercetin and allopurinol to alleviate liver injury under diabetic conditions both in vitro and in vivo.
TXNIP has been demonstrated to negatively regulate PPARα transcriptional activity (Oka et al., 2009). In PPARα knockout mice the feeding of a methionine- and choline-deficient diet failed to induce liver fatty acid β-oxidation and severe hepatic steatosis (Ip et al., 2003). In cultured foetal rat hepatocytes, PPARα levels were shown to inversely correlate with those of IL-1β (Parmentier et al., 1997). Treatment with exogenous PPARα agonists prevents NAFLD in mice fed a high fat diet (Seo et al., 2008). In the present study, the TXNIP overexpression was found to parallel the down-regulation of hepatic PPARα in STZ-induced diabetic rats and high glucose-exposed BRL-3A and HepG2 cells, which possibly caused the impairment of fatty acid β-oxidation and lipogenesis that accounts for hepatic lipid accumulation. In addition, high glucose exposure was unable to suppress PPARα expression in TXNIP siRNA-transfected hepatocytes, indicating that the impairment of the hepatic TXNIP-PPARα pathway may be involved in the development of type 1 diabetes-associated NAFLD. Moreover, quercetin and allopurinol were found to effectively up-regulate hepatic PPARα expression both in vivo and in vitro (with the exception of the TXNIP siRNA-transfected hepatocytes). These results suggest that the ability of quercetin and allopurinol to alleviate diabetic hepatic steatosis is partly mediated by a modulation of the hepatic TXNIP-PPARα pathway.
An increase in the activity of caspase-1 mediated by NLRP3 inflammasome activation has been shown to induce the activation of SREBPs (Gurcel et al., 2006). SREBP-1c is preferentially involved in fatty acid synthesis, whereas SREBP-2 controls cholesterol synthesis (Shimano et al., 1996; Horton et al., 2003). Moreover, SREBP-1 mRNA expression is increased in ob/ob or SREBP-1 transgenic mice, demonstrating that the histological appearance of hepatic steatosis is secondary to increased de novo lipogenesis (Browning and Horton, 2004). Deletion of the liver SREBP cleavage-activating protein abolishes hepatic steatosis in ob/ob mice (Moon et al., 2012). These observations indicate that activation of SREBP-1c and SREBP-2 is essential for the development of diabetic hepatic steatosis. In addition, FAS mediates the lipogenesis process (Loftus et al., 2000). LXRα plays an important role in the efflux of cholesterol (Venkateswaran et al., 2000). In parallel with caspase-1 activation, mediated by TXNIP overexpression, an up-regulation of SREBP-1c, SREBP-2, FAS and LXRα were detected in STZ-induced diabetic rats and high glucose-stimulated BRL-3A and HepG2 cells in the present study. Furthermore, we found that a caspase-1 inhibitor blocked the high glucose-induced up-regulation of SREBP-1c and SREBP-2 in vitro, but failed to stop the overexpression of FAS and LXRα induced under these conditions. Moreover, quercetin and allopurinol were found to effectively suppress hepatic SREBP-1c, SREBP-2, FAS and LXRα expressions in diabetic rats and high glucose-exposed cells. They also inhibited the overexpression of FAS and LXRα in the hepatocytes co-incubated with the caspase-1 inhibitor and high glucose These results suggest that regulation of the TXNIP–NLRP3–SREBPs pathway by quercetin and allopurinol may partly mediate the alleviation of hepatic steatosis in these diabetic rats. AMP-activated PK (AMPK) regulates glucose and lipid metabolism (Viollet et al., 2009). Quercetin and allopurinol markedly increase AMPK activation in HepG2 cells (Suchankova et al., 2009; Lanaspa et al., 2012). AMPK activation can inhibit ligand-induced FAS expression and LXRα activity in rat hepatocytes (Foretz et al., 1998; Yap et al., 2011). Hence, it is possible that AMPK activation mediated by quercetin and allopurinol contributes to the down-regulation of FAS and LXRα expression in hepatic cells under high glucose conditions; this needs to be confirmed in future work.
In conclusion, the results from our in vivo and in vitro studies demonstrate that quercetin and allopurinol suppress the activation of NLRP3 inflammasome and reduce IL-1β levels by inhibiting the overexpression of hepatic TXNIP and, subsequently, modulate the expression of lipid metabolism genes under high glucose conditions. These results further support evidence that inhibition of hepatic TXNIP contributes to the alleviation of liver inflammation and lipid accumulation in type 1 diabetes. The targeting of hepatic TXNIP by quercetin and allopurinol may have therapeutic implications for the prevention of type 1 diabetes-associated NAFLD.
Acknowledgments
This work was supported by grants from NSFC 81025025, China 973 Program (No. 2012CB517602), RFDP20120091110039, PCSCRT (IRT1020) and NSFC J1103512.
Glossary
- AKP
alkaline phosphatase
- ALT
alanine transaminase
- ASC
apoptosis-associated speck-like protein containing a caspase recruitment domain
- AST
aspartate transaminase
- FAS
fatty acid synthase
- LXR
liver X receptor
- NAFLD
non-alcoholic fatty liver disease
- NASH
non-alcoholic steatohepatitis
- NEFA
non-esterified fatty acids
- NLRP3
NOD-like receptor family, pyrin domain-containing 3
- ROS
reactive oxygen species
- SREBP
sterol regulatory element binding protein
- STZ
streptozotocin
- TC
total cholesterol
- TG
triglycerides
- TRX
thioredoxin
- TXNIP
thioredoxin-interacting protein
- XDH
xanthine dehydrogenase
- XO
xanthine oxidase
Conflicts of interest
The authors declare that they have no competing financial interests.
Supporting information
Additional Supporting Information may be found in the online version of this article at the publisher's web-site:
Table S1 siRNA sequences and target sites.
Table S2 Sequences of primer pairs used for amplification of mRNA by RT-PCR.
Table S3 Primers used for qRT-PCR.
References
- Abdelmegeed MA, Moon KH, Hardwick JP, Gonzalez FJ, Song BJ. Role of peroxisome proliferator-activated receptor-alpha in fasting-mediated oxidative stress. Free Radic Biol Med. 2009;47:767–778. doi: 10.1016/j.freeradbiomed.2009.06.017. [DOI] [PMC free article] [PubMed] [Google Scholar]
- Ahsan MK, Okuyama H, Hoshino Y, Oka S, Masutani H, Yodoi J, et al. Thioredoxin-binding protein-2 deficiency enhances methionine-choline deficient diet-induced hepatic steatosis but inhibits steatohepatitis in mice. Antioxid Redox Signal. 2009;11:2573–2584. doi: 10.1089/ars.2009.2385. [DOI] [PubMed] [Google Scholar]
- Arrese M. Nonalcoholic fatty liver disease: liver disease: an overlooked complication of diabetes mellitus. Nat Rev Endocrinol. 2010;6:660–661. doi: 10.1038/nrendo.2010.173. [DOI] [PubMed] [Google Scholar]
- Babujanarthanam R, Kavitha P, Mahadeva Rao US, Pandian MR. Quercitrin a bioflavonoid improves the antioxidant status in streptozotocin: induced diabetic rat tissues. Mol Cell Biochem. 2011;358:121–129. doi: 10.1007/s11010-011-0927-x. [DOI] [PubMed] [Google Scholar]
- Bakhshaeshi M, Khaki A, Fathiazad F, Khaki AA, Ghadamkheir E. Anti-oxidative role of quercetin derived from Allium cepa on aldehyde oxidase (OX-LDL) and hepatocytes apoptosis in streptozotocin-induced diabetic rat. Asian Pac J Trop Biomed. 2012;2:528–531. doi: 10.1016/S2221-1691(12)60090-2. [DOI] [PMC free article] [PubMed] [Google Scholar]
- Bligh EG, Dyer WJ. A rapid method of total lipid extraction and purification. Can J Biochem Physiol. 1959;37:911–917. doi: 10.1139/o59-099. [DOI] [PubMed] [Google Scholar]
- Boesch-Saadatmandi C, Wagner AE, Wolffram S, Rimbach G. Effect of quercetin on inflammatory gene expression in mice liver in vivo – role of redox factor 1, miRNA-122 and miRNA-125b. Pharmacol Res. 2012;65:523–530. doi: 10.1016/j.phrs.2012.02.007. [DOI] [PubMed] [Google Scholar]
- Brown MS, Goldstein JL. The SREBP pathway: regulation of cholesterol metabolism by proteolysis of a membrane-bound transcription factor. Cell. 1997;89:331–340. doi: 10.1016/s0092-8674(00)80213-5. [DOI] [PubMed] [Google Scholar]
- Browning JD, Horton JD. Molecular mediators of hepatic steatosis and liver injury. J Clin Invest. 2004;114:147–152. doi: 10.1172/JCI22422. [DOI] [PMC free article] [PubMed] [Google Scholar]
- Cabrero A, Alegret M, Sanchez RM, Adzet T, Laguna JC, Carrera MV. Increased reactive oxygen species production down-regulates peroxisome proliferator-activated alpha pathway in C2C12 skeletal muscle cells. J Biol Chem. 2002;277:10100–10107. doi: 10.1074/jbc.M110321200. [DOI] [PubMed] [Google Scholar]
- Chen J, Hui ST, Couto FM, Mungrue IN, Davis DB, Attie AD, et al. Thioredoxin-interacting protein deficiency induces Akt/Bcl-xL signaling and pancreatic beta-cell mass and protects against diabetes. FASEB J. 2008;22:3581–3594. doi: 10.1096/fj.08-111690. [DOI] [PMC free article] [PubMed] [Google Scholar]
- Devi TS, Lee I, Huttemann M, Kumar A, Nantwi KD, Singh LP. TXNIP links innate host defense mechanisms to oxidative stress and inflammation in retinal Muller glia under chronic hyperglycemia: implications for diabetic retinopathy. Exp Diabetes Res. 2012;2012:438238. doi: 10.1155/2012/438238. [DOI] [PMC free article] [PubMed] [Google Scholar]
- Dias AS, Porawski M, Alonso M, Marroni N, Collado PS, Gonzalez-Gallego J. Quercetin decreases oxidative stress, NF-kappaB activation, and iNOS overexpression in liver of streptozotocin-induced diabetic rats. J Nutr. 2005;135:2299–2304. doi: 10.1093/jn/135.10.2299. [DOI] [PubMed] [Google Scholar]
- Foretz M, Carling D, Guichard C, Ferre P, Foufelle F. AMP-activated protein kinase inhibits the glucose-activated expression of fatty acid synthase gene in rat hepatocytes. J Biol Chem. 1998;273:14767–14771. doi: 10.1074/jbc.273.24.14767. [DOI] [PubMed] [Google Scholar]
- Giray B, Gurbay A, Hincal F. Cypermethrin-induced oxidative stress in rat brain and liver is prevented by vitamin E or allopurinol. Toxicol Lett. 2001;118:139–146. doi: 10.1016/s0378-4274(00)00277-0. [DOI] [PubMed] [Google Scholar]
- Griffith JW, Sun T, McIntosh MT, Bucala R. Pure hemozoin is inflammatory in vivo and activates the NALP3 inflammasome via release of uric acid. J Immunol. 2009;183:5208–5220. doi: 10.4049/jimmunol.0713552. [DOI] [PMC free article] [PubMed] [Google Scholar]
- Gurcel L, Abrami L, Girardin S, Tschopp J, van der Goot FG. Caspase-1 activation of lipid metabolic pathways in response to bacterial pore-forming toxins promotes cell survival. Cell. 2006;126:1135–1145. doi: 10.1016/j.cell.2006.07.033. [DOI] [PubMed] [Google Scholar]
- Hertog MG, Hollman PC. Potential health effects of the dietary flavonol quercetin. Eur J Clin Nutr. 1996;50:63–71. [PubMed] [Google Scholar]
- Horton JD, Shah NA, Warrington JA, Anderson NN, Park SW, Brown MS, et al. Combined analysis of oligonucleotide microarray data from transgenic and knockout mice identifies direct SREBP target genes. Proc Natl Acad Sci U S A. 2003;100:12027–12032. doi: 10.1073/pnas.1534923100. [DOI] [PMC free article] [PubMed] [Google Scholar]
- Hu QH, Wang C, Li JM, Zhang DM, Kong LD. Allopurinol, rutin, and quercetin attenuate hyperuricemia and renal dysfunction in rats induced by fructose intake: renal organic ion transporter involvement. Am J Physiol Renal Physiol. 2009;297:F1080–F1091. doi: 10.1152/ajprenal.90767.2008. [DOI] [PubMed] [Google Scholar]
- Ip E, Farrell GC, Robertson G, Hall P, Kirsch R, Leclercq I. Central role of PPARalpha-dependent hepatic lipid turnover in dietary steatohepatitis in mice. Hepatology. 2003;38:123–132. doi: 10.1053/jhep.2003.50307. [DOI] [PubMed] [Google Scholar]
- Kakkar R, Mantha SV, Radhi J, Prasad K, Kalra J. Increased oxidative stress in rat liver and pancreas during progression of streptozotocin-induced diabetes. Clin Sci (Lond) 1998;94:623–632. doi: 10.1042/cs0940623. [DOI] [PubMed] [Google Scholar]
- Kilkenny C, Browne W, Cuthill IC, Emerson M, Altman DG. NC3Rs Reporting Guidelines Working Group. Br J Pharmacol. 2010;160:1577–1579. doi: 10.1111/j.1476-5381.2010.00872.x. [DOI] [PMC free article] [PubMed] [Google Scholar]
- Kleiner DE, Brunt EM, Van Natta M, Behling C, Contos MJ, Cummings OW, et al. Design and validation of a histological scoring system for nonalcoholic fatty liver disease. Hepatology. 2005;41:1313–1321. doi: 10.1002/hep.20701. [DOI] [PubMed] [Google Scholar]
- Knight BL, Hebbachi A, Hauton D, Brown AM, Wiggins D, Patel DD, et al. A role for PPARalpha in the control of SREBP activity and lipid synthesis in the liver. Biochem J. 2005;389(Pt 2):413–421. doi: 10.1042/BJ20041896. [DOI] [PMC free article] [PubMed] [Google Scholar]
- Kobori M, Masumoto S, Akimoto Y, Oike H. Chronic dietary intake of quercetin alleviates hepatic fat accumulation associated with consumption of a Western-style diet in C57/BL6J mice. Mol Nutr Food Res. 2011;55:530–540. doi: 10.1002/mnfr.201000392. [DOI] [PubMed] [Google Scholar]
- Lanaspa MA, Cicerchi C, Garcia G, Li N, Roncal-Jimenez CA, Rivard CJ, et al. Counteracting roles of AMP deaminase and AMP kinase in the development of fatty liver. PLoS ONE. 2012;7:e48801. doi: 10.1371/journal.pone.0048801. [DOI] [PMC free article] [PubMed] [Google Scholar]
- Lee YK, Hwang JT, Kwon DY, Surh YJ, Park OJ. Induction of apoptosis by quercetin is mediated through AMPKalpha1/ASK1/p38 pathway. Cancer Lett. 2010;292:228–236. doi: 10.1016/j.canlet.2009.12.005. [DOI] [PubMed] [Google Scholar]
- Liu PG, He SQ, Zhang YH, Wu J. Protective effects of apocynin and allopurinol on ischemia/reperfusion-induced liver injury in mice. World J Gastroenterol. 2008;14:2832–2837. doi: 10.3748/wjg.14.2832. [DOI] [PMC free article] [PubMed] [Google Scholar]
- Loftus TM, Jaworsky DE, Frehywot GL, Townsend CA, Ronnett GV, Lane MD, et al. Reduced food intake and body weight in mice treated with fatty acid synthase inhibitors. Science. 2000;288:2379–2381. doi: 10.1126/science.288.5475.2379. [DOI] [PubMed] [Google Scholar]
- McGrath J, Drummond G, McLachlan E, Kilkenny C, Wainwright C. Guidelines for reporting experiments involving animals: the ARRIVE guidelines. Br J Pharmacol. 2010;160:1573–1576. doi: 10.1111/j.1476-5381.2010.00873.x. [DOI] [PMC free article] [PubMed] [Google Scholar]
- Marra F, Gastaldelli A, Svegliati Baroni G, Tell G, Tiribelli C. Molecular basis and mechanisms of progression of non-alcoholic steatohepatitis. Trends Mol Med. 2008;14:72–81. doi: 10.1016/j.molmed.2007.12.003. [DOI] [PubMed] [Google Scholar]
- Moon YA, Liang G, Xie X, Frank-Kamenetsky M, Fitzgerald K, Koteliansky V, et al. The Scap/SREBP pathway is essential for developing diabetic fatty liver and carbohydrate-induced hypertriglyceridemia in animals. Cell Metab. 2012;15:240–246. doi: 10.1016/j.cmet.2011.12.017. [DOI] [PMC free article] [PubMed] [Google Scholar]
- Muoio DM. TXNIP links redox circuitry to glucose control. Cell Metab. 2007;5:412–414. doi: 10.1016/j.cmet.2007.05.011. [DOI] [PubMed] [Google Scholar]
- Oka S, Yoshihara E, Bizen-Abe A, Liu W, Watanabe M, Yodoi J, et al. Thioredoxin binding protein-2/thioredoxin-interacting protein is a critical regulator of insulin secretion and peroxisome proliferator-activated receptor function. Endocrinology. 2009;150:1225–1234. doi: 10.1210/en.2008-0646. [DOI] [PubMed] [Google Scholar]
- Parmentier JH, Schohn H, Bronner M, Ferrari L, Batt AM, Dauca M, et al. Regulation of CYP4A1 and peroxisome proliferator-activated receptor alpha expression by interleukin-1beta, interleukin-6, and dexamethasone in cultured fetal rat hepatocytes. Biochem Pharmacol. 1997;54:889–898. doi: 10.1016/s0006-2952(97)00256-6. [DOI] [PubMed] [Google Scholar]
- Ramos-Romero S, Perez-Cano FJ, Ramiro-Puig E, Franch A, Castell M. Cocoa intake attenuates oxidative stress associated with rat adjuvant arthritis. Pharmacol Res. 2012;66:207–212. doi: 10.1016/j.phrs.2012.05.009. [DOI] [PubMed] [Google Scholar]
- Schroder K, Zhou R, Tschopp J. The NLRP3 inflammasome: a sensor for metabolic danger? Science. 2010;327:296–300. doi: 10.1126/science.1184003. [DOI] [PubMed] [Google Scholar]
- Sekiya M, Yahagi N, Matsuzaka T, Najima Y, Nakakuki M, Nagai R, et al. Polyunsaturated fatty acids ameliorate hepatic steatosis in obese mice by SREBP-1 suppression. Hepatology. 2003;38:1529–1539. doi: 10.1016/j.hep.2003.09.028. [DOI] [PubMed] [Google Scholar]
- Seo YS, Kim JH, Jo NY, Choi KM, Baik SH, Park JJ, et al. PPAR agonists treatment is effective in a nonalcoholic fatty liver disease animal model by modulating fatty-acid metabolic enzymes. J Gastroenterol Hepatol. 2008;23:102–109. doi: 10.1111/j.1440-1746.2006.04819.x. [DOI] [PubMed] [Google Scholar]
- Shimano H, Horton JD, Hammer RE, Shimomura I, Brown MS, Goldstein JL. Overproduction of cholesterol and fatty acids causes massive liver enlargement in transgenic mice expressing truncated SREBP-1a. J Clin Invest. 1996;98:1575–1584. doi: 10.1172/JCI118951. [DOI] [PMC free article] [PubMed] [Google Scholar]
- Spahr L, Bresson-Hadni S, Amann P, Kern I, Golaz O, Frossard JL, et al. Allopurinol, oxidative stress and intestinal permeability in patients with cirrhosis: an open-label pilot study. Liver Int. 2007;27:54–60. doi: 10.1111/j.1478-3231.2006.01382.x. [DOI] [PubMed] [Google Scholar]
- Stienstra R, Mandard S, Patsouris D, Maass C, Kersten S, Muller M. Peroxisome proliferator-activated receptor alpha protects against obesity-induced hepatic inflammation. Endocrinology. 2007;148:2753–2763. doi: 10.1210/en.2007-0014. [DOI] [PubMed] [Google Scholar]
- Suchankova G, Nelson LE, Gerhart-Hines Z, Kelly M, Gauthier MS, Saha AK, et al. Concurrent regulation of AMP-activated protein kinase and SIRT1 in mammalian cells. Biochem Bioph Res Co. 2009;378:836–841. doi: 10.1016/j.bbrc.2008.11.130. [DOI] [PMC free article] [PubMed] [Google Scholar]
- Targher G, Bertolini L, Rodella S, Zoppini G, Lippi G, Day C, et al. Non-alcoholic fatty liver disease is independently associated with an increased prevalence of chronic kidney disease and proliferative/laser-treated retinopathy in type 2 diabetic patients. Diabetologia. 2008;51:444–450. doi: 10.1007/s00125-007-0897-4. [DOI] [PubMed] [Google Scholar]
- The Ministry of Science and Technology of the People's Republic of China. 2006. Guidance suggestions for the care and use of laboratory animals.
- Tschopp J, Schroder K. NLRP3 inflammasome activation: the convergence of multiple signalling pathways on ROS production? Nat Rev Immunol. 2010;10:210–215. doi: 10.1038/nri2725. [DOI] [PubMed] [Google Scholar]
- Tsutsui H, Matsui K, Okamura H, Nakanishi K. Pathophysiological roles of interleukin-18 in inflammatory liver diseases. Immunol Rev. 2000;174:192–209. doi: 10.1034/j.1600-0528.2002.017418.x. [DOI] [PubMed] [Google Scholar]
- Venkateswaran A, Laffitte BA, Joseph SB, Mak PA, Wilpitz DC, Edwards PA, et al. Control of cellular cholesterol efflux by the nuclear oxysterol receptor LXR alpha. Proc Natl Acad Sci U S A. 2000;97:12097–12102. doi: 10.1073/pnas.200367697. [DOI] [PMC free article] [PubMed] [Google Scholar]
- Videla LA, Rodrigo R, Araya J, Poniachik J. Insulin resistance and oxidative stress interdependency in non-alcoholic fatty liver disease. Trends Mol Med. 2006;12:555–558. doi: 10.1016/j.molmed.2006.10.001. [DOI] [PubMed] [Google Scholar]
- Viollet B, Guigas B, Leclerc J, Hebrard S, Lantier L, Mounier R, et al. AMP-activated protein kinase in the regulation of hepatic energy metabolism: from physiology to therapeutic perspectives. Acta Physiol (Oxf) 2009;196:81–98. doi: 10.1111/j.1748-1716.2009.01970.x. [DOI] [PMC free article] [PubMed] [Google Scholar]
- Wang C, Pan Y, Zhang QY, Wang FM, Kong LD. Quercetin and allopurinol ameliorate kidney injury in STZ-treated rats with regulation of renal NLRP3 inflammasome activation and lipid accumulation. PLoS ONE. 2012;7:e38285. doi: 10.1371/journal.pone.0038285. [DOI] [PMC free article] [PubMed] [Google Scholar]
- Yao P, Nussler A, Liu L, Hao L, Song F, Schirmeier A, et al. Quercetin protects human hepatocytes from ethanol-derived oxidative stress by inducing heme oxygenase-1 via the MAPK/Nrf2 pathways. J Hepatol. 2007;47:253–261. doi: 10.1016/j.jhep.2007.02.008. [DOI] [PubMed] [Google Scholar]
- Yap F, Craddock L, Yang J. Mechanism of AMPK suppression of LXR-dependent Srebp-1c transcription. Int J Biol Sci. 2011;7:645–650. doi: 10.7150/ijbs.7.645. [DOI] [PMC free article] [PubMed] [Google Scholar]
- Zhao X, Zhu JX, Mo SF, Pan Y, Kong LD. Effects of cassia oil on serum and hepatic uric acid levels in oxonate-induced mice and xanthine dehydrogenase and xanthine oxidase activities in mouse liver. J Ethnopharmacol. 2006;103:357–365. doi: 10.1016/j.jep.2005.08.040. [DOI] [PubMed] [Google Scholar]
- Zhou R, Tardivel A, Thorens B, Choi I, Tschopp J. Thioredoxin-interacting protein links oxidative stress to inflammasome activation. Nat Immunol. 2010;11:136–140. doi: 10.1038/ni.1831. [DOI] [PubMed] [Google Scholar]
- Zhu JX, Wang Y, Kong LD, Yang C, Zhang X. Effects of Biota orientalis extract and its flavonoid constituents, quercetin and rutin on serum uric acid levels in oxonate-induced mice and xanthine dehydrogenase and xanthine oxidase activities in mouse liver. J Ethnopharmacol. 2004;93:133–140. doi: 10.1016/j.jep.2004.03.037. [DOI] [PubMed] [Google Scholar]
Associated Data
This section collects any data citations, data availability statements, or supplementary materials included in this article.