Recently, Griffith et al. reported that acetoin is a major product of the photolysis of aqueous pyruvic acid (PA), and proposed that its mechanism of formation involves the thermal decarboxylation of α-acetolactic acid (AL) intermediate (1). This finding is in contrast with a previous study by Guzman et al., based on experiments performed under similar conditions, which reported the formation of two major products: 2,3-dimethyl tartaric acid (A) and 2-(3-oxobutan-2-yloxy)-2-hydroxypropanoic acid (B) (2–4). Both A and B result after triplet radical pairs are formed via long-range (proton-coupled) electron transfer between carbonyl groups (5). Product B can thermally decompose into acetoin, but its carbonyl chromophore absorbs at λmax ∼ 285 nm vs. 276 nm for acetoin (2). In fact, Guzman et al. had shown that the thermal decarboxylation of aqueous AL proceeds at significantly slower rates than postphotolysis CO2(g) emissions, thereby excluding its participation in the mechanism of PA photolysis (2, 3).
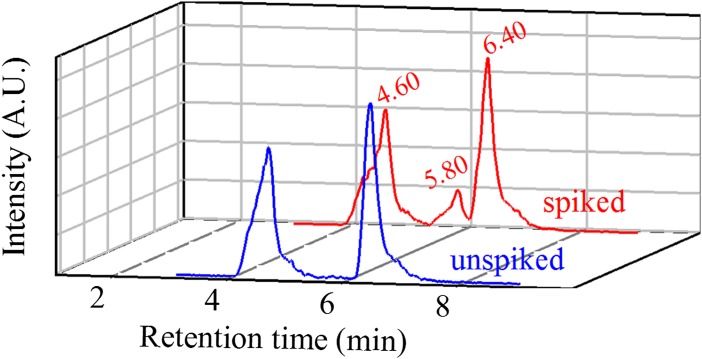
A realistic reaction mechanism based on multiple spectroscopic features, such as those detected by Griffith et al. (1), should be able to identify intermediates and explain the reaction kinetics. Assigning spectroscopic features to specific carbonyls in complex mixtures is challenging at best and problematic in general. The standard procedure for the unequivocal identification of carbonyls, such as acetoin, involves the chromatographic separation of their 2,4-dinitrophenylhydrazone derivatives. Fig. 1 shows the chromatogram of a mixture produced from 1-h photolysis of 50 mM PA at 4 °C, followed by warming at 25 °C for 1 h, and subsequent derivatization with 2,4-dinitrophenylhydrazine. The Z and E hydrazones of PA elute at 4.60 and 6.40 min, and are seen in samples spiked with acetoin or unspiked. Acetoin is only observed at 5.80 min, when it is spiked before derivatization [(acetoin)final = 20 μM]. The absence of acetoin in the unspiked sample warrants that its yield, if produced, must be below 0.006%.
Fig. 1.
Extracted ion (m/z = 267) chromatogram obtained by ultrahigh-performance liquid chromatography/electrospray ionization(-)/MS (Hypersil GOLD column 1.9 μm, 50 × 2.1 mm) of unspiked photolyzed sample (blue line) and 20 μM spiked acetoin for the same sample (red line) before derivatization. Retention times for the two hydrazones of PA and acetoin are 4.60, 6.40, and 5.80 min, respectively.
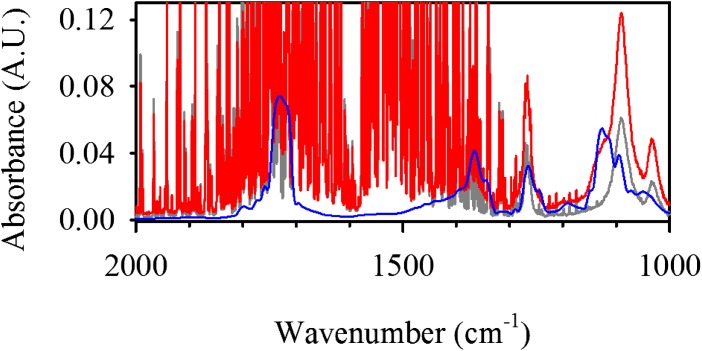
Inspection of the inset of figure 1 in Griffith et al. (1) makes it immediately apparent that the bands assigned to the trace species (overshadowed by water absorptions) do not match the spectrum of acetoin at multiple wavenumbers. Following a similar protocol to Griffith et al. (1), we obtained in Fig. 2 a better defined spectrum for the unknown species that partitions into the gas-phase (gray line), acetoin (blue line), and for a spike addition of acetoin to the product (red line). The spectrum of acetoin with a peak at 1,125 cm−1 does not match the spectrum of the photolysis product with a peak at 1,091 cm−1, as is appreciated in the sample spiked with acetoin that causes the shoulder at 1,125 cm−1. Therefore, we interpret Griffith et al.’s results (1) as in fact confirming that most of PA is converted to products A (m/z = 177) and B (m/z = 175) (2, 3), as displayed in figure S3 of ref. 1 which, in addition, lacks signals attributable to detectable amounts of lactate (m/z = 89) in the photolyzed sample.
Fig. 2.
Infrared spectrum of (gray line) collected gas over 50 mM aqueous PA after photolysis (λ > 305 nm) for 1 h, (blue line) acetoin and (red line) gas product spiked with acetoin.
Acknowledgments
A.J.E. was supported in part by a Kentucky Opportunity Fellowship.
Footnotes
The authors declare no conflict of interest.
References
- 1.Griffith EC, Carpenter BK, Shoemaker RK, Vaida V. Photochemistry of aqueous pyruvic acid. Proc Natl Acad Sci USA. 2013;110(29):11714–11719. doi: 10.1073/pnas.1303206110. [DOI] [PMC free article] [PubMed] [Google Scholar]
- 2.Guzmán MI, Colussi AJ, Hoffmann MR. Photoinduced oligomerization of aqueous pyruvic acid. J Phys Chem A. 2006;110(10):3619–3626. doi: 10.1021/jp056097z. [DOI] [PubMed] [Google Scholar]
- 3.Guzmán MI, Hoffmann MR, Colussi AJ. Photolysis of pyruvic acid in ice: Possible relevance to CO and CO2 ice core record anomalies. J Geophys Res-Atmos. 2007;112(D10):D10123. [Google Scholar]
- 4.Guzmán MI, Hildebrandt L, Colussi AJ, Hoffmann MR. Cooperative hydration of pyruvic acid in ice. J Am Chem Soc. 2006;128(32):10621–10624. doi: 10.1021/ja062039v. [DOI] [PubMed] [Google Scholar]
- 5.Guzmán MI, Colussi AJ, Hoffmann MR. Photogeneration of distant radical pairs in aqueous pyruvic acid glasses. J Phys Chem A. 2006;110(3):931–935. doi: 10.1021/jp053449t. [DOI] [PubMed] [Google Scholar]


