

Abstract
Previous publications demonstrated that the extrapolated solubility by polyethylene glycol (PEG) precipitation method (Middaugh et al., J Biol Chem 1979; 254:367–370; Juckes, Biochim Biophys Acta 1971; 229:535–546; Foster et al., Biochim Biophys Acta 1973; 317:505; Mahadevan and Hall, AIChE J 1990; 36:1517–1528; Stevenson and Hageman, Pharm Res 1995; 12:1671–1676) has a strong correlation to experimentally measured solubility of proteins. Here, we explored the utility of extrapolated solubility as a method to compare multiple protein drug candidates when nonideality of a highly soluble protein prohibits accurate quantitative solubility prediction. To achieve high efficiency and reduce the amount of protein required, the method is miniaturized to microwell plate format for high-throughput screening application. In this simplified version of the method, comparative solubility of proteins can be obtained without the need of concentration measurement of the supernatant following the precipitation step in the conventional method. The monoclonal antibodies with the lowest apparent solubilities determined by this method are the most difficult to be concentrated, indicating a good correlation between the prediction and empirical observations. This study also shows that the PEG precipitation method gives results for opalescence prediction that favorably compares to experimentally determined opalescence levels at high concentration. This approach may be useful in detecting proteins with potential solubility and opalescence problems prior to the time-consuming and expensive development process of high concentration formulation.
Keywords: solubility, polyethylene glycol, monoclonal antibody, volume exclusion, high-throughput screen
Introduction
Protein solubility is an important requisite for manufacture and administration of biological therapeutics. In particular, there is increasing demand for stable highly concentrated, liquid antibody formulations for subcutaneous (s.c.) administration. Developing robust, scalable formulation steps to obtain soluble proteins at a sufficiently elevated concentration (>100 mg/mL) remains a major challenge.1 It has been estimated that more than 90% of all potential protein pharmaceuticals are unsuitable for preclinical or clinical development due to low solubility.2 To increase the probability of success of a product relying on elevated protein solubility, common strategies include avoiding potentially difficult targets, focusing on proteins that offer better chances for high solubility, or optimizing the formulation of the protein to enhance solubility. There are many methods available for solubility measurement, including concentrating the protein solution by membrane-based ultrafiltration until a phase change (precipitates or other solid forms) is observed or by dissolving lyophilized protein powder to a high concentration solution. Despite the fact that the experimental determination of solubility is relatively accessible, protein availability could be a limiting factor in many cases at the early stage of new drug development processes. The ability to predict protein potential for solubility would therefore be extremely beneficial for drug candidate selection and formulation screening.
It has been demonstrated that a log-linear relationship exists between protein solubility and weight percent polyethylene glycol (PEG).3–8 The apparent maximum solubility in the absence of PEG, determined by extrapolation using this relationship, compared well with values measured by conventional concentration approaches for several proteins. As explained elsewhere, in high concentration protein solutions, the apparent solubility, derived from the intercept, comprises not only the intrinsic solubility term but also the thermodynamic nonideality term of the solution.3,7 Under conditions we studied (at pH away from the pI), the nonideality term is not negligible, and therefore the extrapolated solubility exceeds the actual solubility. Here, we demonstrate an application of the prediction method despite the fact that it overestimates the protein solubility and present a novel evaluating technique to assess the likelihood of a protein to be a good candidate for a high concentration product. It provides an alternate knockout approach to identify protein candidates with potential for difficulty in reaching high concentration that could preclude development of dosage forms for subcutaneous administration. In addition, this low volume high-throughput screening (HTS) technique can be utilized to improve efficiency of solubility screening and reduce the amount of protein needed.
Results and Discussion
Previous literature has reported the precipitation method using PEG for predicting solubility of proteins, including antibodies.3,4,9–11 In many cases, these studies used less soluble proteins (e.g., cryoimmunoglobulins) or buffer conditions at which protein solubility is not maximized (e.g., antibodies at pH 7–8). Here, we pose the question of whether this method still remains valid for predicting solubility characteristics when applied to relatively highly soluble proteins such as antibodies at pH away from their pIs. The predicted apparent solubility level in this study can be as high as 104 mg/mL (Fig. 1), two orders of magnitude higher than the most soluble protein used in reported studies, far exceeding the protein's actual solubility.
Figure 1.
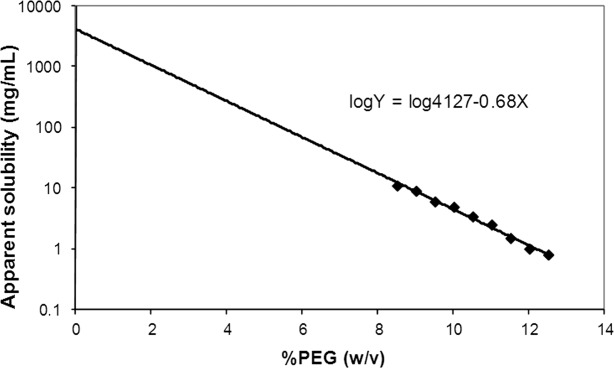
Apparent solubility of mAb1 by PEG 10k. Measurements were conducted at 10 mg/mL in 50 mM histidine pH 6 at 20°C. Data are shown as mean ± SD (n = 3).
Some noticeable features when using the method of PEG-induced protein precipitation can be understood in accordance with Figure 1. The apparent solubility of 4127 mg/mL, which is estimated by the intercept, is unrealistically high. For comparison, it was reported that the estimated maximum solubility of albumin is 677 mg/mL based on the packing density of hexagonally close-packed hard spheres7; therefore the predicted apparent solubility of 4127 mg/mL for mAb1 far exceeds the protein's actual solubility. Also, due to the highly soluble nature of monoclonal antibodies (mAbs) at a pH away from their pIs (pH 6.0 in this study), maximum solubility cannot be obtained under practical experimental conditions since the protein solution reaches a kinetically trapped state or a gel phase.12 In other words, properties of a highly concentrated protein solution are such that the mobility of the water molecules is progressively reduced due to increase in viscosity which finally results in immobility in the protein–water gel matrix, and thus further removal of the residual water by ultrafiltration or further dissolving of protein powder into the solution becomes impossible. Therefore, unlike previous studies, direct correlation of the predicted apparent solubility with protein actual solubility cannot be experimentally established for these highly soluble proteins. In previous works,3,7 authors point out that nonideal protein solutions give intercepts which include an activity related term representing the solution nonideality, and therefore exceed the practical solubility limits. Consequently, care should be taken in interpretation of data for nonideal protein solutions.
Protein solubility as a thermodynamic parameter is defined as the concentration of soluble protein that is in equilibrium with a crystalline solid phase under given conditions of pH, temperature, buffer concentration, and various additives.13 Since the protein precipitates obtained by addition of PEG were amorphous in nature, the solubility obtained from the supernatant concentration does not fit the thermodynamic definition, but rather represents apparent solubility of mAbs under given PEG solution conditions. This “apparent solubility” simply represents the extrapolated protein solubility at zero %PEG from protein concentration in the supernatant under defined PEG-containing solution conditions. Although the apparent solubility does not depict the actual solubility, we investigated whether the solubilities of different antibodies under the same buffer condition is a valid comparison.
A visual microwell plate method was developed for rapid, HTS for apparent solubility using in-house mAbs. Due to the fact that the slope of the phase diagram remains constant for different mAbs (data not shown), a simplified version of the PEG-based solubility assay was designed for HTS. When the initial protein concentrations of all mAbs are adjusted with the same levels of PEG, a more soluble mAb requires higher %PEG to precipitate. Therefore, the minimum %PEG needed for protein precipitation indicates relative apparent solubility of the protein (Fig. 2). This simplified version of the method avoids centrifugation, dilution, and concentration measurement of the supernatant following the precipitation step, resulting in high efficiency and reduced protein material need.
Figure 2.
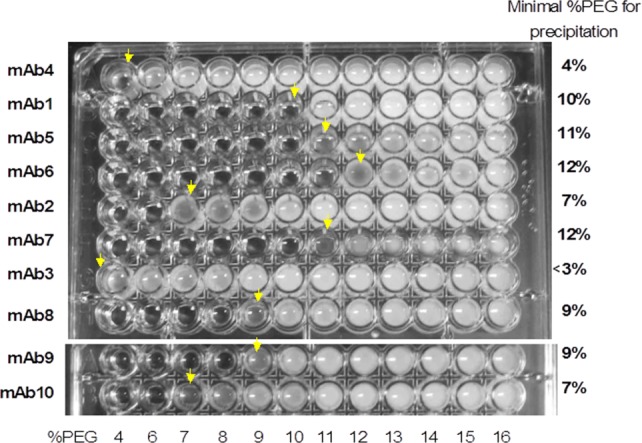
Microplate screen of antibody apparent solubility by the PEG precipitation method. Concentration of all proteins is 10 mg/mL in 50 mM histidine, pH 6.
For mAbs in general, solubility is not a major issue since most mAbs are highly soluble proteins. mAb3 is an exception, as major protein loss was found during an UF/DF process, and maximum achievable concentration was 17 mg/mL in 10 mM histidine pH 6 buffer. In contrast, other mAbs could be concentrated to over 200 mg/mL in the same buffer by UF/DF. These data correlate with the apparent solubility comparison shown in Figure 2, where mAb3 has the poorest solubility. Therefore, the screening power of apparent solubility renders this method an excellent evaluation tool for manufacturability assessment of target proteins to avoid potentially problematic drug candidates.
At an early stage of drug development when available protein material is scarce, achievable maximum protein solubility is often assessed by concentrating a very small amount of protein using a centrifugal concentrating device. It is not our intention to suggest replacing this brute force method with a predictive method. Instead we consider the PEG method as additional information that compliments the concentration data because the apparent solubility determined by the PEG method reflects the intrinsic solubility properties of the molecule without the complication from other interferences (such as binding to membrane, pH shift due to Donnan effect, viscosity, aggregation, etc.). We have found that the data from a concentration study using a concentrator is sometimes too ambiguous to make a comparison between different molecules and formulations, and the data does not represent actual manufacturability of high concentration protein at scale.
At high protein concentration, protein solutions often have an opalescent appearance. This raises concern with regard to irreversible association and its potential to cause immunogenicity or injection-site reactions.14 Also, it is desirable to obtain a clear protein solution for a more elegant appearance of the final drug product. We observed that mAb3, whose apparent solubility is the lowest among the mAbs tested, has the highest level of opalescence. This leads us to speculate that the apparent solubility may predict the turbidity at high protein concentration. The opalescence of the mAbs at 90 mg/mL, obtained by membrane based centrifugation concentrator devices, was measured by UV/vis absorbance, and the resulting relationship with the apparent solubility is plotted on the graph in Figure 3. These results suggest that, among the fifteen mAbs tested, the apparent solubility trends inversely with experimentally determined opalescence (Table I and Fig. 3). Therefore, the discriminatory ability of apparent solubility in the assessment of opalescence was demonstrated with different mAb molecules. However, we stress that the method developed here may not apply to comparing entirely different proteins which might be expected to have completely distinct intrinsic solubility characteristics.
Figure 3.
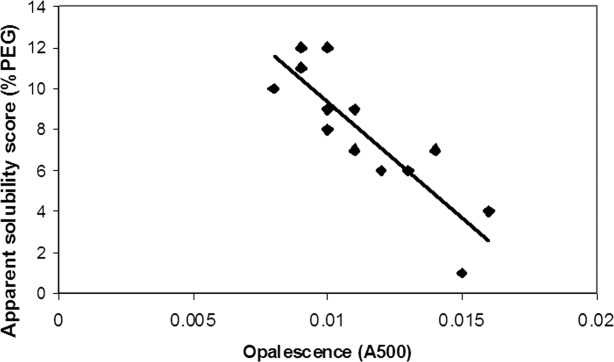
Correlation of opalescence of mAbs at 90 mg/mL with apparent solubilities measured by the PEG precipitation method.
Table I.
Correlation of Opalescence of Antibodies With Apparent Solubility Score as Demonstrated in Figure 3
| mAbs | Subclass | Opalescence A500 | Apparent solubility score %PEG |
|---|---|---|---|
| mAb1 | IgG2 | 0.008 (0.001) | 10 (1) |
| mAb2 | IgG4 | 0.011 (0.002) | 7 (1) |
| mAb3 | IgG1 | 0.015 (0.002) | 1 (0) |
| mAb4 | IgG2 | 0.016 (0.003) | 4 (0) |
| mAb5 | IgG1 | 0.009 (0.002) | 11 (2) |
| mAb6 | IgG1 | 0.009 (0.002) | 12 (2) |
| mAb7 | IgG1 | 0.010 (0.002) | 12 (2) |
| mAb8 | IgG1 | 0.011 (0.002) | 9 (1) |
| mAb9 | IgG1 | 0.010 (0.002) | 9 (1) |
| mAb10 | IgG4 | 0.011 (0.002) | 7 (1) |
| mAb11 | IgG1 | 0.014 (0.003) | 9 (1) |
| mAb12 | IgG1 | 0.013 (0.002) | 6 (1) |
| mAb13 | IgG1 | 0.012 (0.002) | 6 (0) |
| mAb14 | IgG1 | 0.009 (0.001) | 11 (1) |
| mAb15 | IgG1 | 0.010 (0.002) | 8 (1) |
Results are given as arithmetic means and standard deviations within parentheses, n = 3.
The data in Table I and Figure 3 were generated using GMP grade proteins purified for clinical trials. Occasionally, protein materials at early development stage tend to have higher turbidity than late development materials, representing more refined purification processes, and can pose an exception to the trend noted above. We observed that the predicted apparent solubility of mAb7 [Fig. 4(C)] remains unchanged despite different opalescence level in these samples presumably caused by different amount of residual host cell proteins and/or nucleotides [Fig. 4(A,B)]. A typical GMP mAb purification process involves two to three chromatography steps which result in one to two log(s) reduction in HCP and DNA levels, as compared to a single pro-A column purification process. It is possible that trace amount (<0.1%) of the contaminant does not have noticeable impact on solubility characteristics of the active protein, although the overall solution appearance seems to be sensitive to the contaminant. In other words, the method is robust and can sustain a small level of impurity from up-stream purification steps. Therefore, this method could be utilized as a quick screening tool to gain preliminary insight as to whether observed opalescence is a true inherent protein characteristic or caused by contaminants likely be removed in late stage development.
Figure 4.
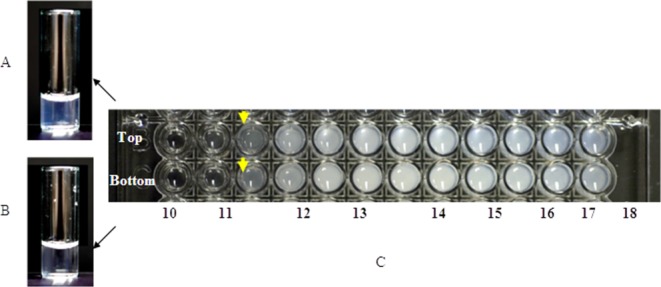
Opalescence levels and apparent solubilities by PEG precipitation method of mAb7 at different purification steps. The material from early development stage has the same apparent solubility read out (C, top) as material from more refined purification process (C, bottom), despite its higher opalescence (A and B) due to the presence of residual host cell protein/DNA. A: 100 mg/mL mAb7 purified by single-column purification process; B: 100 mg/mL mAb7 purified by two-column purification process; C: apparent solubility of 10 mg/mL single-column purified (top) and two-column purified (bottom) mAb7 by the microplate PEG precipitation method.
What is noteworthy about the prediction method described in this article is that it not only applies to identifying poorly soluble protein constructs but also applies to predicting opalescence for proteins based on the fact that both protein apparent solubility and actual solubility/opalescence are affected by protein–protein interaction (solution nonideality).7 The implication that apparent solubility is also related to opalescence in our study is consistent with published reports which suggest that protein–protein interactions account for the opalescence15–17 in protein solutions. Most antibodies tested here are highly soluble (>100 mg/mL) and their apparent solubilities significantly exceed the actual solubility. Because of the dynamics and complexity of factors altering protein solubility, the intended use of the method is to identify antibodies with challenging solubility characteristics (<100 mg/mL) for high concentration dosage form development. It may not be necessary or desirable to differentiate the true solubilities among already highly soluble (solubility >200 mg/mL) antibodies.
In summary, we report here the use of the PEG precipitation-based solubility prediction method in a microplate format as a comparative approach to assess relative protein solubility and opalescence. The method is expected to be helpful in detecting particularly less soluble mAbs and selecting more suitable proteins for development. The predictive abilities of the method were confirmed by high correlation of the response of apparent solubility to empirical observation. This study also shows that the PEG precipitation method gives favorable results for opalescence prediction and compares to experimentally determined opalescence levels at high concentration. The novel HTS version of the method avoids the limitations of conventional methods that can be tedious and leads to significantly reduced protein material need, sample preparation time, and increased sample throughput.
Materials and Methods
Materials
PEG 10k was purchased from Fluka (Ronkonkoma, NY). Histidine was purchased from Sigma Chemical Company (St. Louis, MO). All mAbs in this study were manufactured at Pfizer (Andover, MA).
Preparation of PEG stock solution
It was observed that dissolving solid PEG in buffered solutions caused a significant change in the measured pH by as much as 1 pH unit with 40% PEG (w/v) in 50 mM histidine buffer. This could alter the slope of the solubility curve by progressively increasing the pH with increasing PEG concentration. Therefore, the pH values of the 40% PEG stock solutions were adjusted using 5N HCl after dissolving PEG into the desired buffers.
Protein precipitation by PEG and solubility measurements
Phase diagrams were determined by preparing samples at given protein concentrations with different PEG concentrations. Antibody stock solutions were prepared by dialyzing the protein into desired buffer and then diluting to 11 mg/mL with the buffer. Aliquots of the protein solution and 40% PEG solution were added to 1.5-mL eppendorf tubes and thoroughly mixed to give a final volume of 500 μL. A two-phase separation occurred upon mixing the buffered antibody solution with the buffered 40% PEG solution at varied ratios. All solutions were allowed to equilibrate at a target temperature for at least 10 min, after which solutions were centrifuged at 4000 rpm for 30 min at the same temperature, and the supernatant assayed by UV/vis. Temperature of the samples was maintained at 20°C.
Microwell plate screen
In preparation for a HTS, the method was miniaturized to 200-μL final volumes and adapted to suit the 96-well plate format using Corning Costar 96 well UV plates. The microwell plates were set up by hand; however, the method is amenable to automation. All mAbs were dialyzed in 50 mM histidine pH 6.0 and their concentrations were adjusted to 10 mg/mL. 40% PEG 10k stock solution was prepared in the same buffer and pH was adjusted to 6.0. A 96-well plate was prepared by loading wells with different ratios of PEG 10k stock solution to mAbs solution to give a final volume of 200 μL in each well. Each row was designated for a specific mAb with increased final PEG concentration from 2% in Column 1 to 16% in Column 12. The contents were mixed by pipetting followed by incubation at room temperature for 15 min. Insolubility of the mixture was indicated by the increase in turbidity of the solution. The microwell plate was examined visually or by absorbance measured by spectrophotometer.
Opalescence measurement
Absorbance at 500 nm was monitored with a SPECTRAmax PLUS384 microplate reader (Molecular Devices, Sunnyvale, CA) at room temperature. Increase in absorbance at 500 nm visually correlates with increase in sample turbidity.
References
- 1.Shire SJ, Shahrokh Z, Liu J. Challenges in the development of high protein concentration formulations. J Pharm Sci. 2004;93:1390–1402. doi: 10.1002/jps.20079. [DOI] [PubMed] [Google Scholar]
- 2.Caldwell GW, Ritchie DM, Masucci JA, Hageman W, Yan Z. The new pre-preclinical paradigm: compound optimization in early and late phase drug discovery. Curr Top Med Chem. 2001;1:353–366. doi: 10.2174/1568026013394949. [DOI] [PubMed] [Google Scholar]
- 3.Middaugh CR, Tisel WA, Haire RN, Rosenberg A. Determination of the apparent thermodynamic activities of saturated protein solutions. J Biol Chem. 1979;254:367–370. [PubMed] [Google Scholar]
- 4.Juckes IRM. Fractionation of proteins and viruses with polyethylene glycol. Biochim Biophys Acta. 1971;229:535–546. [PubMed] [Google Scholar]
- 5.Foster PR, Dunhill P, Lilly MD. The precipitation of enzymes from cell extracts of Saccharomyces cerevisiae by polyethylene-glycol. Biochem Biophys Acta. 1973;317:505. doi: 10.1016/0005-2795(73)90243-2. [DOI] [PubMed] [Google Scholar]
- 6.Stevenson CL, Hageman MJ. Estimation of recombinant bovine somatotropin solubility by excluded-volume interaction with polyethylene glycols. Pharm Res. 1995;12:1671–1676. doi: 10.1023/a:1016201319136. [DOI] [PubMed] [Google Scholar]
- 7.Atha DH, Ingham KC. Mechanism of precipitation of proteins by polyethylene glycols: analysis in terms of excluded volume. J Biol Chem. 1981;256:12108–12117. [PubMed] [Google Scholar]
- 8.Polson A, Potgieter GH, Largier JF, Mears GEF, Joubert FJ. The fractionation of protein mixtures by linear polymers of high molecular weight. Biochim Biophys Acta. 1964;82:463–475. doi: 10.1016/0304-4165(64)90438-6. [DOI] [PubMed] [Google Scholar]
- 9.Mahadevan H, Hall CK. A statistical-mechanical model of protein precipitation by nonionic polymer. AIChE J. 1990;36:1517–1528. [Google Scholar]
- 10.Lawson EQ, Schubert CF, Lewis RV, Middaugh CR. The solubility of bovine lens crystallins. J Biol Chem. 1981;256:6523–6525. [PubMed] [Google Scholar]
- 11.Boncina M, Rescic J, Vlachy V. Solubility of lysozyme in polyethylene glycol-electrolyte mixtures: the depletion interaction and ion-specific effects. Biophys J. 2008;95:1285–1294. doi: 10.1529/biophysj.108.128694. [DOI] [PMC free article] [PubMed] [Google Scholar]
- 12.Dumetz AC, Chockla AM, Kaler EW, Lenhoff AM. Protein phase behavior in aqueous solutions: crystallization, liquid-liquid phase separation, gels, and aggregates. Biophys J. 2008;94:570–583. doi: 10.1529/biophysj.107.116152. [DOI] [PMC free article] [PubMed] [Google Scholar]
- 13.Ries-Kautt M, Ducruix A. Inferences drawn from physicochemical studies of crystallogenesis and precrystalline state. Methods Enzymol. 1997;276:23–59. doi: 10.1016/S0076-6879(97)76049-X. [DOI] [PubMed] [Google Scholar]
- 14.Schellekens H. Bioequivalence and the immunogenicity of biopharmaceuticals. Nat Rev Drug Discov. 2002;1:457–462. doi: 10.1038/nrd818. [DOI] [PubMed] [Google Scholar]
- 15.Sukumar M, Doyle BL, Combs JL, Pekar AH. Opalescent appearance of an IgG1 antibody at high concentrations and its relationship to noncovalent association. Pharm Res. 2004;21:1087–1093. doi: 10.1023/b:pham.0000032993.98705.73. [DOI] [PubMed] [Google Scholar]
- 16.Liu J, Nguyen MD, Andya JD, Shire SJ. Reversible self-association increases the viscosity of a concentrated monoclonal antibody in aqueous solution. J Pharm Sci. 2005;94:1928–1940. doi: 10.1002/jps.20347. [DOI] [PubMed] [Google Scholar]
- 17.Saluja A, Kalonia DS. Nature and consequences of protein-protein interactions in high protein concentration solutions. Int J Pharm. 2008;358:1–15. doi: 10.1016/j.ijpharm.2008.03.041. [DOI] [PubMed] [Google Scholar]