

Abstract
The purpose of this study was to characterize exercise-induced arterial hypoxaemia (EIAH), pulmonary gas exchange and respiratory mechanics during exercise, in young healthy women. We defined EIAH as a >10 mmHg decrease in arterial oxygen tension ( ) during exercise compared to rest. We used a heliox inspirate to test the hypothesis that mechanical constraints contribute to EIAH. Subjects with a spectrum of aerobic capacities (n= 30; maximal oxygen consumption (
 ) = 49 ± 1, range 28–62 ml kg−1 min−1) completed a stepwise treadmill test and a subset (n= 18 with EIAH) completed a constant load test (∼85%
 ) with heliox gas. Throughout exercise arterial blood gases, oxyhaemoglobin saturation (
 ), the work of breathing (WOB) and expiratory flow limitation (EFL) were assessed. Twenty of the 30 women developed EIAH with a nadir
  and
and  ranging from 58 to 88 mmHg and 87 to 96%, respectively. At maximal exercise,
  was inversely related to
  (r=–0.57, P < 0.05) with notable exceptions where some subjects with low aerobic fitness levels demonstrated EIAH. Subjects with EIAH had a greater
  (51 ± 1 vs. 43 ± 2 ml kg−1 min−1), lower end-exercise
  (93.2 ± 0.5 vs. 96.1 ± 0.3%) and a greater maximal energetic WOB (324 ± 19 vs. 247 ± 23 J min−1), but had similar resting pulmonary function compared to those without EIAH. Most subjects developed EIAH at submaximal exercise intensities, with distinct patterns of hypoxaemia. In some subjects with varying aerobic fitness levels, mechanical ventilatory constraints (i.e. EFL) were the primary mechanism associated with the hypoxaemia during the maximal test. Mechanical ventilatory constraints also prevented adequate compensatory alveolar hyperventilation in most EIAH subjects. Minimizing mechanical ventilatory constraints with heliox inspiration partially reversed EIAH in subjects who developed EFL. In conclusion, healthy women of all aerobic fitness levels can develop EIAH and begin to do so at submaximal intensities. Mechanical ventilatory constraints are a primary mechanism for EIAH in some healthy women and prevent reversal of hypoxaemia in women for whom it is not the primary mechanism.
Key points
By virtue of their smaller lung volumes and airway diameters, women develop more mechanical ventilatory constraints during exercise, which may result in increased vulnerability to hypoxaemia during exercise.
Hypoxaemia developed at all exercise intensities with varying patterns and was more common in aerobically trained subjects; however, some untrained women also developed hypoxaemia.
Mechanical respiratory constraints directly lead to hypoxaemia in some women and prevent adequate reversal of hypoxaemia in most women.
Experimentally reversing mechanical constraints with heliox gas partially reversed the hypoxaemia in subjects who developed expiratory flow limitation.
Due in part to increased mechanical ventilatory constraints, the respiratory system's response to exercise is less than ideal in most women.
Introduction
During dynamic whole body exercise, many healthy highly trained men are unable to maintain arterial blood gases homeostasis (Dempsey et al. 1984; Wagner et al. 1986; Nielsen et al. 1998). Rather, a large alveolar-to-arterial oxygen difference ( ) develops and consequently arterial oxygen tension (
 ) falls relative to resting values. Reductions in
  result in decreases in oxyhaemoglobin saturation (
 ) and, subsequently, exercise tolerance and maximal oxygen consumption (
 ) are compromised (Powers et al. 1989; Harms et al. 2000). Collectively, this phenomenon is referred to as exercise-induced arterial hypoxaemia (EIAH) and has been observed by many (Holmgren & Linderholm, 1958; Dempsey et al. 1984; Anselme et al. 1994; Hopkins et al. 1998; Sheel et al. 2001), but not necessarily all (Calbet et al. 2003, 2005) research groups. One theory explaining EIAH is that the respiratory system's static capacity is unable to meet the high demand for ventilation in highly trained subjects (Dempsey, 1986). The ‘Demand vs. Capacity’ concept is rooted in observations made during or near maximal exercise intensities. The maximal capacity of the respiratory system is governed, in part, by principles of ventilatory mechanics such as airflow, operational lung volumes and the energetic work of breathing (WOB). Accordingly, some highly trained men who develop significant mechanical constraints during intense exercise also develop EIAH (Johnson et al. 1992). One method to manipulate mechanical ventilatory constraints involves breathing heliox gas (21% O2:79% He) (Babb, 1997). When nitrogen is replaced with helium as a backing gas, airflow remains more laminar thus allowing greater flows. Heliox inspiration can offset some of the observed EIAH, indicating that relative alveolar hypoventilation is a contributing mechanism in some, but not all subjects (Dempsey et al. 1984). However, many subjects develop EIAH at submaximal intensities, where there is ample capacity to increase ventilation, and mechanical ventilatory constraints, such as expiratory flow limitation (EFL), are largely absent. Therefore, the specific contributing role of ventilatory mechanics to EIAH observed at submaximal exercise is relatively unknown.
Women exhibit greater mechanical ventilatory constraints during exercise than men (Wanke et al. 1991; Guenette et al. 2007), owing to their smaller lungs and airways (Mead, 1980; Sheel et al. 2009). Increased ventilatory constraints in women limit effective ventilation and result in relative alveolar hypoventilation during intense exercise (McClaran et al. 1998). These sex-based differences in airway anatomy and function could lead women to develop EIAH more often at submaximal intensities and at a lower relative  than men, a hypothesis supported by Harms et al. (1998). The aforementioned study reported that several women free from respiratory disease and with an unremarkable aerobic fitness (
 < 50 ml kg−1 min−1) developed significant reductions in arterial oxygenation. Conversely, to date there have been no published reports of healthy but untrained men developing EIAH. However, the previous findings are not universal, as other similar studies found that EIAH occurs similarly between the sexes (Hopkins et al. 2000; Olfert et al. 2004). As such, it is unclear if the established sex-based anatomical differences in the respiratory system manifest in differences in EIAH.
Accordingly, the purpose of our study was threefold. First, our study was designed to more fully characterize EIAH and the role of mechanical ventilatory constraints in women. We sought to determine the relative prevalence of EIAH in trained women. Second, we asked if untrained women will develop EIAH and if hypoxaemia occurs during submaximal exercise intensities. Finally, we aimed to determine the role of mechanical ventilatory constraints in EIAH development and severity by using heliox inspiration during constant load exercise. We hypothesized that the majority of aerobically trained, and some untrained, women would develop EIAH during all intensities of treadmill exercise. Furthermore, mechanical ventilatory constraints would be associated with the occurrence and/or worsening of EIAH in women, as indicated by the partial reversal of EIAH during acute heliox breathing.
Methods
Subjects
Thirty, young (19–42 years) healthy women provided informed consent and participated in testing. All procedures were approved by the Clinical Research Ethics Board at the University of British Columbia in accordance with the Declaration of Helsinki. The cohort included subjects from a variety of athletic disciplines and ranged from elite athletes to non-obese sedentary individuals resulting in a range of  values (28–62 ml kg−1 min−1). A spectrum of aerobic capacities was intended to test the hypothesis regarding untrained women and EIAH. Subjects were free of any current or previous cardiorespiratory ailments and had no history of asthma. Previously, our laboratory demonstrated significant inter- and intra-subject variability with respect to hormone levels throughout the menstrual cycle (MacNutt et al. 2012). Therefore, we tested subjects at random points throughout their menstrual cycle and oral contraceptives were not an exclusion criteria. The testing facility was located near sea-level (barometric pressure 752 ± 8 mmHg) and ambient temperature was consistent (21 ± 1°C) throughout all experiments.
Protocol
Upon arrival, subjects completed medical/physical activity questionnaires followed by pulmonary function and anthropometric measures. Subjects were then instrumented with a radial artery catheter, an oesophageal balloon-tipped catheter and an oesophageal temperature probe. After instrumentation, subjects rested in a chair before completing a self-selected warm-up. Initial resting arterial blood samples were taken at least 1 h after instrumentation to ensure the subjects were not hyperventilating due to the procedures. Measurements of expired gases, respiratory parameters and arterial blood were obtained during an incremental exercise test on a treadmill to volitional exhaustion. A subset of these subjects (n= 18) demonstrating EIAH during the maximal test completed a second exercise bout. Initially, subjects rested (15–20 min) in a chair (off the mouthpiece) to ensure their core temperature and ventilation had returned to (near) resting levels. There was an additional 10 min of rest (on the mouthpiece) while ventilatory, metabolic and arterial blood gas parameters were gathered, followed by the constant load exercise test.
Pulmonary function
Seated resting pulmonary function was assessed using a portable spirometer (Spirolab II, Medical International Research, Vancouver, BC, Canada) according to standard procedures (ATS, 1995). Subjects were excluded if any parameter was <80% predicted. Subjects were familiarized with and practiced, inspiratory capacity and graded forced vital capacity manoeuvres with visual feedback. Single breath pulmonary diffusion capacity for carbon monoxide (Collins DS/PLUS II, Braintree, MA, USA) was measured prior to any exercise (ATS, 1995). Static recoil pressure at 50% forced vital capacity (FVC) was measured and used to calculate the dysanapsis index according to previously described methods (Mead, 1980).
Graded exercise test
Prior to exercise, resting blood samples were obtained while the subjects rested for 10 min in a chair. After a self-selected warm-up (∼10 min), an incremental maximal exercise test on a treadmill (TMX425C, Full Vision Inc., Newton, KA, USA) was completed. During exercise a chest harness was secured to the subject and a support structure as a safety precaution. Starting treadmill speed varied between 5.6 and 8.9 km h−1 at a 0% gradient depending on aerobic fitness. Treadmill speed increased 1.6 km h−1 every 2.5 min until a comfortable speed or 16.1 km h−1 was reached. Thereafter, the gradient was increased by 1% every 2.5 min until volitional fatigue. Arterial blood samples were obtained during the last 30 s of each stage and at maximal intensity, while inspiratory capacity manoeuvres were performed at the 2 and 2.5 min mark of each stage. Three subjects had additional arterial samples taken immediately (<20 s) after exercise cessation while seated.
Constant load exercise test
The constant load exercise test consisted of three 2.5 min stages at a submaximal intensity (80–90% ). Intensity was determined prior to testing and was two stages below the highest, in order for completion. During the 1st and 3rd stage, room air was inspired. During the 2nd stage, humidified (∼50% relative humidity) heliox gas (20.93–21.17% O2:balance He) was inspired. Subjects were aware that they would inspire compressed gas during the 2nd stage, but were blinded to the composition and intended effect. Immediately after the final stage, a maximal expiratory flow–volume (MEFV) curve was developed with heliox. Arterial blood samples and ventilatory parameters were obtained in a similar manner to the graded exercise test.
Arterial blood sampling
After administering local anaesthesia (2% lidocaine (lignocaine) HCl), a 20-gauge catheter (Radial Artery Catheter, Arrow International, Reading, PA, USA) was inserted into the radial artery by modified Seldinger technique. The catheter was connected to a commercially available arterial blood sampling kit (VP1, Edwards Lifescience, Irvine, CA, USA), allowing for repeated sampling and flushing with 0.9% saline to ensure patency. Dead space between the catheter and sampling port was 3 ml. Before sampling, an excess of dead space volume (5 ml) was withdrawn and discarded. Immediately thereafter, arterial samples (3 ml) were collected in pre-heparinized syringes (Pro-Vent, Smiths Medical, Keene, NH, USA) and any air bubbles were evacuated. Blood analysis was performed within 30 s of sampling with a calibrated blood gas analyser (ABL Flex80 CO-OX, Radiometer, Copenhagen, Denmark). Analysed variables included: pH,  , arterial carbon dioxide tension (
 ),
),  , K+, haemoglobin concentration ([Hb]) and haematocrit (Hct), while HCO3− was calculated. Average total blood loss was 30–60 ml, with none exceeding 100 ml, while total infused saline was 50–200 ml. Resting samples with a
  < 85 mmHg were analysed in duplicate with all repeated resting samples in close agreement with the initial. Using standard equations (Severinghaus, 1966), arterial blood gases were corrected for oesophageal temperature as measured from a rapid response thermistor (Ret-1, Physitemp Instruments, Clinton, NJ, USA) connected to a temperature sensor (Thermalert TH-5, Physitemp Instruments). Prior to placement, the thermistor was calibrated using physiologically relevant water baths (range 35–42°C). Recently, others have argued that arterial blood gases should be corrected for active muscle temperature rather than oesophageal temperature (Scroop & Shipp, 2010). By doing so,
  measures appear unchanged relative to rest. With respect to the purpose of our study, we contend that using muscle temperature is inappropriate as it reflects local venous effluent gas tensions, but does not represent blood during oxygen loading in the lungs. Accordingly, oesophageal temperature was chosen because it closely matches (∼0.1°C) pulmonary artery temperature (Lefrant et al. 2003) which is representative of blood participating in pulmonary gas exchange. The alveolar gas equation was used to calculate ideal alveolar oxygen tension (
 ) and the
  , with water vapour pressure calculated using oesophageal temperature.
Pressure, flow and volume
A viscous topical anaesthetic (2% lidocaine HCl) was applied to the nares and nasopharynx before passing a 10 cm balloon-tipped latex catheter (no. 47-9005; Ackrad Laboratory, Cranford, NJ, USA) through the nose. The catheter was positioned in the lower third of the oesophagus (∼40 cm past nostril) to estimate pleural pressure (Milic-Emili et al. 1964). Placement was confirmed with the dynamic occlusion test. After securing with tape, the balloon catheter was connected to a calibrated piezoelectric pressure transducer (Raytech Instruments, Vancouver, BC, Canada). Mouth pressure was measured through a port in the mouthpiece and connected to the same pressure transducer. Subjects breathed through a low resistance (0.6–0.9 cmH2O l−1 s−1 at 0.5–8 l s−1 on room air and 0.3–0.5 cmH2O l-1 s-1 over 1.5–9.5 l s−1 flow using heliox) two-way non-rebreathing valve (2700B, Hans Rudolph, Kansas City, MO, USA) attached to large bore tubing. Screens were not added to equalize external resistance between conditions as a reduction in the total WOB and minimization of mechanical constraints, regardless of site (intrathoracic or breathing circuit), was the desired effect. Ventilatory and mixed expired metabolic parameters were gathered using a customized metabolic cart consisting of independently calibrated inspired and expired pneumotachographs (3818, Hans Rudolph) and O2 and CO2 analysers (S-3-A/I and CD-3A, respectively, Applied Electrochemistry, Pittsburgh, PA, USA). Metabolic volumes ( and
and  ) are expressed in STPD, while all other volumes are BTPS.
Data collection and analysis
Raw data (flow, volume, ventilatory and mixed expired parameters) were recorded continuously at 200 Hz using a 16-channel analog–digital data acquisition system (PowerLab/16SP model ML 795, ADI, Colorado Springs, CO, USA) and stored on a computer for subsequent analysis. Volumes were corrected for pneumotachograph drift using customized software (LabVIEW, National Instruments, Austin, TX, USA). The WOB was estimated using previously described techniques (Guenette et al. 2009). Ventilatory capacity ( ) during rest and exercise was estimated using the method described in detail elsewhere (Johnson et al. 1995). Briefly, using measured breathing parameters (duty cycle, tidal volume and operational lung volume), we assumed that the subjects respired exclusively along their MEFV curve, thus allowing the determination of minimal expiratory time and subsequently maximal breathing frequency. Using the alveolar gas and ventilation equations with concurrent gas exchange measures, we estimated the minute ventilation (
 ) required to increase
  sufficiently to return
  back to resting levels during each exercise stage. We would expect the
  and dead space ventilation to worsen with increased
  , but, we assumed they remained constant. Consequently, our estimates of the
  necessary to increase
  to resting levels are conservative. In addition to direct measurement by the blood gas analyser,
  was calculated as though pH, temperature and
  remained unchanged from ideal resting conditions (7.4, 37°C, 40 mmHg; respectively), indicating what percentage of desaturation was solely due to
  changes. Furthermore,
  was calculated with
  remaining at each subject's resting level, but with pH, temperature and
  at their respective exercise levels, indicating what percentage of desaturation was due to shifting of the oxygen disassociation curve (ODC). Arterial oxygen content (
 ) was measured similarly to
  . Maximum expiratory flow–volume curves, tidal flow–volume (FV) loops, EFL and operational lung volumes were determined as previously described, with the limitations of these techniques also detailed (Guenette et al. 2010; Dominelli et al. 2011).
Statistics
Subjects were partitioned based on the appearance of EIAH (EIAH and NEIAH (no exercise-induced arterial hypoxaemia) groups) and EFL (EFL and NEFL groups). For EIAH, we utilized the definition of a 10 mmHg decrease in  during exercise compared to rest (Harms et al. 1998; Dempsey & Wagner, 1999). Of note, all of our EIAH subjects also met the other common definition of EIAH, a 3% decrease in
  compared to rest, which represents the amount of desaturation needed to affect
  (Harms et al. 2000). Expiratory flow limitation was defined as >5% of any exercise tidal FV loop intersecting with the MEFV curve (Derchak et al. 2000). The EIAH group was compared to the NEIAH group at
  using unpaired t tests with Bonferroni corrections. Groups were also compared at different percentages of
  using a repeated measures analysis of variance (ANOVA) and Tukey's post hoc test. Pearson product moment correlations determined relationships between selected variables. Resting pulmonary function breathing room air and heliox were compared using dependent t tests. Stages were compared during the constant load test using a repeated measure ANOVA and Tukey's post hoc test. Significance was set at P < 0.05 and all values are presented as mean ± SEM.
Results
Subject characteristics and maximal exercise data
Table 1 summarizes descriptive characteristics and pulmonary function measurements for the cohort separated into EIAH and NEIAH groups. Table 2 displays metabolic, ventilatory, arterial blood gas and respiratory mechanics variables at maximal exercise. There was no difference in breathing pattern (tidal volume, breathing frequency, operational lung volume) or timing (inspiratory duty cycle: 48 vs. 49% for the EIAH and NEIAH groups, respectively). The lower end-exercise  in the EIAH group was due to a wider
  and not a lower
  (Table 2). Greater desaturation in the EIAH group was due to decreases in
  and not temperature, pH and
  effects on the ODC. Both groups increased
  compared to rest; however, the NEIAH group's increase was twice that of the EIAH group, as a result of a similar increase in haemoglobin concentrations, while the NEIAH group maintained a higher
  . The WOB was greater in the EIAH group due to their greater
  . There was a significant association between
  and
and  and
and  (r=–0.57 and r= 0.58, respectively). However, there were notable exceptions, whereby some subjects (n= 6) possessed modest
  values (35–50 ml kg−1 min−1) and yet their
  dropped below 80 mmHg and had a wide
  (>30 mmHg) (see Supplemental Fig. 1, available online).
Table 1.
Descriptive variables for the subjects (n= 30) based on the appearance of EIAH
| EIAH (n= 20) | NEIAH (n= 10) | |||
|---|---|---|---|---|
| Value | Range | Value | Range | |
| Age (years) | 27 ± 2 | 19–42 | 25 ± 2 | 19–34 |
| Height (cm) | 169 ±1 | 161–179 | 168 ± 3 | 157–188 |
| Weight (kg) | 62 ± 1 | 51–72 | 66 ± 3 | 58–81 |
| BMI (kg m−2) | 21.9 ± 0.5 | 18.0–25.7 | 23.7 ± 0.9 | 20.4–29.4 |
| BSA (m2) | 1.71 ± 0.02 | 1.50–1.88 | 1.77 ± 0.05 | 1.47–2.05 |
| Hb (g dl−1) | 12.7 ± 0.2 | 11.3–13.7 | 12.0 ± 0.3 | 10.1–13.2 |
| Hct (%) | 37 ± 1 | 35–42 | 37 ± 1 | 31–41 |
| FVC (l) | 4.0 ± 0.1 | 2.9–4.8 | 4.1 ± 0.1 | 3.7–4.7 |
| %Pred | 103 ± 2 | 82–118 | 105 ± 2 | 95–120 |
| FEV1 (l) | 3.4 ± 0.1 | 2.7–4.0 | 3.4 ± 0.1 | 3.0–3.9 |
| %Pred | 101 ± 2 | 84–116 | 100 ± 2 | 84–112 |
| FEV1/FVC (%) | 86 ± 1 | 69–95 | 84 ± 2 | 73–93 |
| %Pred | 102 ± 2 | 81–122 | 99 ± 2 | 88–112 |
| PEF (l s−1) | 8.1 ± 0.3 | 4.5–10.1 | 7.4 ± 0.3 | 6.2–8.9 |
| FEF75 (l s−1) | 6.8 ± 0.3 | 4.5–8.9 | 6.3 ± 0.2 | 5.5–7.2 |
| FEF50 (l s−1) | 4.7 ± 0.3 | 2.9–7.5 | 4.5 ± 0.2 | 3.1–5.3 |
| FEF25 (l s−1) | 2.4 ± 0.2 | 0.8–4.9 | 2.1 ± 0.2 | 1.3–3.5 |
| DLCO (mmHg ml−1 min−1) | 28.2 ± 1.0 | 22.1–37.2 | 25.4 ± 1.5 | 21.5–32.8 |
| %Pred | 109 ± 4 | 85–144 | 91 ± 5* | 81–116 |
| MIP (cmH2O) | 97 ± 5 | 62–134 | 99 ± 7 | 41–13 |
| %Pred | 122 ± 7 | 69–173 | 124 ± 9 | 50–157 |
All values are mean ± SEM. EIAH, exercise-induced arterial hypoxaemia; NEIAH, no exercise-induced arterial hypoxaemia; BMI, body mass index; BSA, body surface area; Hb, haemoglobin; Hct, haematocrit; FVC, forced vital capacity; Pred, predicted; FEV1, forced expired volume in 1 s; PEF, peak expiratory flow; FEF75, forced expiratory flow at 75% FVC; FEF50, forced expiratory flow at 50% FVC; FEF25, forced expiratory flow at 25% FVC; DLCO, carbon monoxide diffusion capacity of the lung; MIP, maximal inspiratory pressure. *Significantly different from EIAH group, P < 0.05.
Table 2.
Mean data at maximal exercise for all subjects and based on the appearance of EIAH
| EIAH (n= 20) | NEIAH (n= 10) | |||
|---|---|---|---|---|
| Value | Range | Value | Range | |
 (l min−1) (l min−1) |
3.2 ± 0.1 | 2.4–3.7 | 2.8 ± 0.1* | 2.3–3.3 |
| (ml kg−1 min−1) | 51 ± 1 | 38–62 | 43 ± 2* | 28–52 |
 (l min−1) (l min−1) |
3.5 ± 0.1 | 2.7–4.1 | 3.0 ± 0.1* | 2.5–3.6 |
 (l min−1) (l min−1) |
105 ± 3 | 73–133 | 91 ±3* | 70–111 |
| VT (l) | 1.9 ±0.1 | 1.5–2.6 | 1.8 ± 0.1 | 1.4–2.1 |
| f (beats min-1) | 56 ± 2 | 40–71 | 53 ± 3 | 34–68 |
| VD/VT | 0.18 ± 0.01 | 0.09–0.27 | 0.20 ± 0.04 | 0.05–0.60 |
 (mmHg) (mmHg) |
80 ± 2 | 67–89 | 93 ± 2* | 77–103 |
 (mmHg) (mmHg) |
111 ± 1 | 103–119 | 113 ± 1 | 106–117 |
 (mmHg) (mmHg) |
31 ± 1 | 21–45 | 18 ± 1* | 11–26 |
 (mmHg) (mmHg) |
38 ± 1 | 30–46 | 38 ± 1.0 | 34–42 |
| pH | 7.23 ± 0.01 | 7.14–7.31 | 7.25 ± 0.02 | 7.16–7.36 |
| HCO3− (mmol l−1) | 15 ± 0.3 | 11–17 | 16 ± 0.8 | 13–22 |
| K+ (mmol l−1) | 5.7 ± 0.1 | 4.9–6.2 | 5.7 ± 0.1 | 5.2–6.3 |
| Toes (°C) | 38.9 ± 0.2 | 37.5–40.0 | 38.1 ± 0.2* | 37.3–39.3 |
 (%) (%) |
93.2 ± 0.5 | 87.1–96.0 | 96.2 ± 0.3* | 94.6–97.9 |
 changes changes |
95.6 ± 0.3 | 93.1–96.8 | 97.1 ± 0.3* | 95.2–98.1 |
pH, Toes, 
|
94.5 ± 0.3 | 91.4–96.5 | 94.7 ± 0.4 | 93.0–97.0 |
 (ml dl−1) (ml dl−1) |
17.6 ± 0.2 | 16.0–19.7 | 18.1 ± 0.5 | 15.5–20.7 |
Δ rest (ml dl−1) rest (ml dl−1) |
 |
−0.8–2.5 |
 * * |
0.1–3.2 |
| EELV (%FVC) | 36 ± 2 | 21–49 | 40 ± 3 | 23–63 |
| EILV (%FVC) | 87 ± 2 | 73–96 | 88 ± 2 | 74–96 |
| WOB (J min−1) | 324 ± 19 | 158–507 | 224 ± 24* | 124–330 |
| ΔPoes (cmH2O) | 49 ± 2 | 33–66 | 39 ± 3* | 23–50 |
 (l min−1) (l min−1) |
167 ± 9 | 103–246 | 168 ± 10 | 130–229 |
 / / (%) (%) |
57 ± 2 | 36–77 | 49 ± 3* | 32–66 |
 offset EIAH (l min−1) offset EIAH (l min−1) |
155 ± 11 | 89–283 | 76 ± 3* | 59–88 |
%
|
93 ± 6 | 52–149 | 50 ± 4* | 37–59 |
| EFL (%) | 19 ± 5 | 0–58 | 11 ± 5 | 0–37 |
Values are mean ± SEM.  , oxygen consumption;
  , carbon dioxide production;
  , expired minute ventilation; VT, tidal volume; f, breathing frequency; VD, physiological deadspace;
  , arterial oxygen tension;
  , alveolar oxygen tension;
  , alveolar-to-arterial oxygen difference;
  , arterial carbon dioxide production; Toes, oesophageal temperature;
  , arterial oxyhaemoglobin saturation; Δ
 rest, change in arterial oxygen content from rest; EELV, end expiratory lung volume; FVC, forced vital capacity; EILV, end-inspiratory lung volume; WOB, work of breathing; ΔPoes, oesophageal pressure swings per breath;
  , maximal ventilatory capacity;
  , minute ventilation; EIAH, exercise-induced arterial hypoxaemia; EFL, expiratory flow limitation. *Significantly different from EIAH group, P < 0.05.
Individual and group response
Individual blood gas responses at each stage of exercise are shown in Fig. 1. The two subjects in panel A with resting  values near 80 mmHg had an additional resting sample taken to ensure the values were not erroneous. The additional samples were in close agreement (1–2 mmHg) with the original and these subjects had
  > 98%. While some resting
  values are lower than expected, they are commensurate with other published work where studies often report one or more subject with a resting
  < 85 mmHg in women and men (St Croix et al. 1998; Wetter et al. 2001; Romer et al. 2006). There was high inter-subject variability amongst
  and
and  at rest and all exercise intensities, while
  and
and  were relatively homogeneous at low exercise intensities, but became more variable at higher intensities. For example, at a
  of 50 ml kg−1 min−1 there was a range of approximately 30 mmHg in
  and
and  . The sharp decrease in
  seen in some subjects near end-exercise (Fig. 1D) was caused by a shifting of the ODC and not a sudden decrease in
  . In three subjects who developed EIAH, blood samples were obtained immediately after exercise cessation (<20 s) and
  ,
,  and
and  had all returned to resting levels.
Figure 1. Individual arterial blood gas response to maximal exercise test.
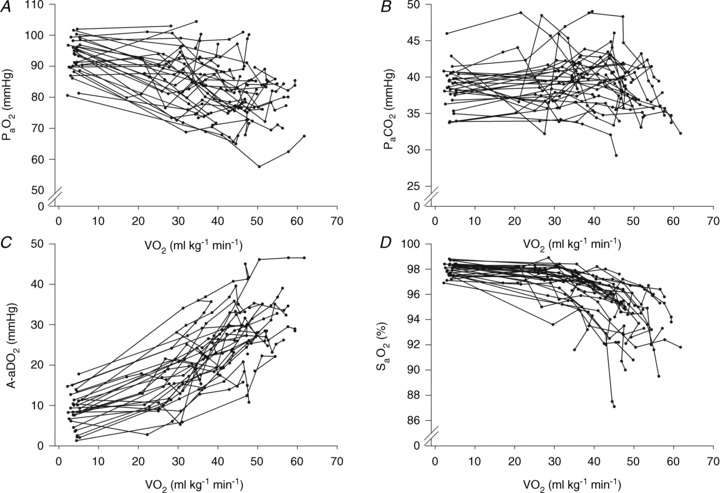
 , arterial oxygen tension;
  , arterial carbon dioxide tension;
  , alveolar-to-arterial oxygen difference;
  , arterial oxyhaemoglobin saturation;
  , oxygen consumption.
We were concerned about the possibility that the oesophageal instrumentation may have impacted ventilation. Two subjects returned on a separate occasion and ran at a constant load for 3.5 min under three conditions: (i) with a mouthpiece measuring ventilatory and metabolic data, (ii) with the same mouthpiece and oesophageal balloon catheter, and (iii) the combination of (i) and (ii) and oesophageal thermistor. All trials were nearly identical with respect to  , tidal volume and breathing frequency (See Supplemental Table 1, available online). As such, it is unlikely that the oesophageal instrumentation affected ventilation.
The response to progressive exercise in the EIAH and NEIAH groups is shown in Fig. 2. From 80% onwards, the EIAH group had significantly lower
  and
and  concurrent with a larger
  , yet
, yet  was similar at all relative intensities. The difference became amplified as intensity progressed. The greater WOB was due to differences in greater resistive work, as the elastic component was similar (Fig. 2F).
Figure 2. Arterial blood gas and respiratory mechanics variables at different percentages of.
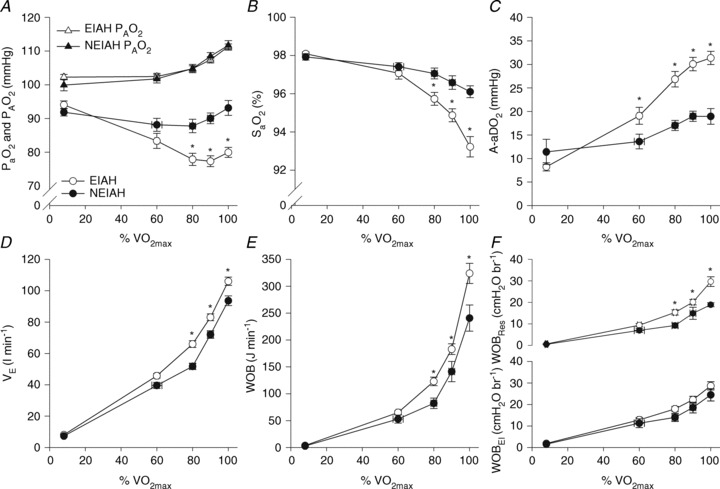
 EIAH, exercise-induced arterial hypoxaemia; NEIAH, no exercise-induced arterial hypoxaemia;
  , arterial oxygen tension;
  , alveolar oxygen tension;
  , arterial oxyhaemoglobin saturation;
  , alveolar-to-arterial oxygen gradient;
  , expired minute ventilation; WOB, work of breathing; WOBEl, elastic work of breathing; WOBRes, resistive work of breathing;
  , maximal oxygen consumption. *Significantly different from NEIAH group, P < 0.05.
Submaximal EIAH
Eighteen subjects developed EIAH at submaximal intensities (<80% ) persisting throughout the exercise test. However, one subject displayed EIAH at submaximal intensities, but raised their
  to within 10 mmHg of the resting value at maximal exercise. Figure 3 displays the MEFV curve, tidal FV loops and
  for the EIAH group split into six distinct patterns of hypoxaemia. Groupings were determined based on the temporal changes in blood gases along with the development of EFL. In panel A, the subjects demonstrate a gradual decrease in
  with the capacity to increase ventilation, indicated by the lack of EFL. Subjects in panel B demonstrate an immediate decrease in
  upon exercise onset; however, at ∼90%
 ,
,  increases and
  approaches resting levels. In panel C, an immediate decrease in
  was also observed. However, as exercise intensity increases,
  remains stable despite an apparent mechanical ability to increase
  (absence of EFL). In panel D,
  is maintained until the onset of EFL (80%
 ) at which point
  decreases and remains stable. Subjects in Panel E also show an immediate drop in
  upon exercise onset and a slight increase (+4 mmHg) near maximal intensities. However, unlike panel B, subjects in panel E were unable to substantially increase their
  due to EFL. Finally, panel F shows a nearly identical response to that in panel C (immediate
  drop followed by a plateau), except that at maximal exercise these subjects display some EFL, which prevented any further increases in
  .
.
Figure 3. Maximal expiratory flow–volume curves, tidal flow–volume loops and arterial oxygen tension for the EIAH subjects (n= 20) split into six groups based on the pattern of hypoxaemia during the maximal exercise test.
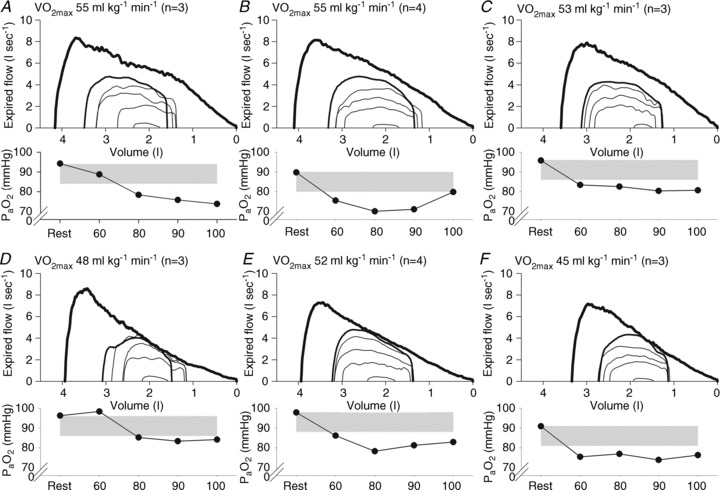
Values are mean averages for each panel's respective number of subjects. Grey shaded area in each panel's lower graph represents a ≥10 mmHg decrease in  relative to rest.
  , maximal oxygen consumption;
  , arterial oxygen tension.
Respiratory mechanics
Fourteen of 30 subjects developed some degree of EFL during the exercise test (32 ± 4, range 14–69% of tidal volume). There was no difference in  (47 ± 2 vs. 51 ± 2 ml kg−1 min−1) or end-exercise
  (84 ± 2 vs. 82 ± 2 mmHg) between the EFL and NEFL group, respectively. The NEFL group had a significantly greater resting forced expired volume in 1 s (3.3 ± 0.1 vs. 3.5 ± 0.1 l) and mid-range expiratory flows (FEF75: 6.2 ± 0.4 vs. 7.1 ± 0.4 l s−1; FEF50: 4.6 ± 0.3 vs. 5.0 ± 0.2 l s−1; FEF25: 1.9 ± 0.2 vs. 2.7 ± 0.2 l s−1). All six untrained women with EIAH also developed EFL and three of those developed EFL at submaximal intensities. The EFL group had a smaller dysanapsis ratio (0.17 vs. 0.24 arbitrary units), but a similar FVC (3.9 vs. 4.1 l), compared with the NEFL group (n= 22 total, n= 11 for EFL). Figure 4 displays the mechanical WOB for all subjects based on the appearance of EIAH. Figure 5 shows different ventilations at relative
  for the subjects, independently based on the appearance of EFL (A) and EIAH (B). In panel A, the measured
  is similar, but the EFL group's
  is reduced at all intensities. However, since
  levels were similar in the EFL and NEFL groups, the predicted
  to eliminate EIAH in the EFL group approaches
  , but not in the NEFL group. Conversely, the EIAH and NEIAH groups have a similar
  , but their measured
  and
and  to eliminate EIAH are different. Specifically, for the EIAH group to raise their
  to resting levels, they would have to ventilate at or near their mechanical capacity.
Figure 4. Individual work of breathing data points for all subjects during the maximal exercise and the heliox portion of the constant load exercise test.
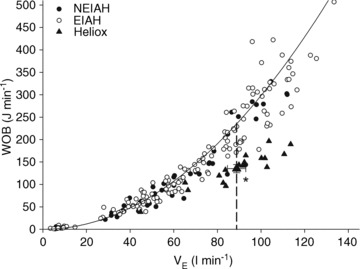
Large triangle indicates the average  and WOB during heliox breathing. Dashed line directs to the WOB at an iso-ventilation. Regression line uses the equation described by Otis (1964). WOB, work of breathing;
  , expired minute ventilation. *Significantly different compared to a similar
  on room air, P < 0.05.
Figure 5. Expired minute ventilation, maximal ventilatory capacity and theoretical ventilation to fully offset EIAH during the maximal exercise for the EFL and NEFL subjects (A) and the EIAH and NEIAH subjects (B).
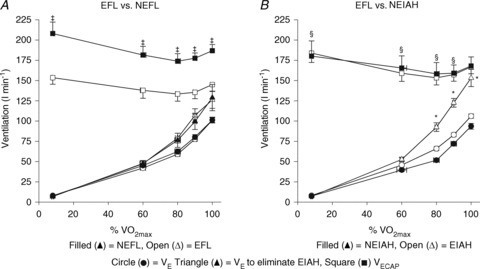
EFL, expiratory flow limitation; NEFL, no expiratory flow limitation; EIAH, exercise-induced arterial hypoxaemia; NEIAH, no exercise-induced arterial hypoxaemia;  , maximal oxygen consumption;
  , expired minute ventilation;
  , ventilatory capacity. ‡Different from EFL group's ventilatory capacity; *different from EIAH group's expired minute ventilation; §different from EIAH group's ventilation to eliminate EIAH, P < 0.05.
Constant load exercise bout
Descriptive characteristic for subjects completing the constant load exercise were not different from the group as a whole (see Supplemental Table 2). Table 3 displays resting pulmonary function during air and heliox breathing. Resting  obtained before the constant bout was statistically similar to the initial resting sample (within 1–3 mmHg). Exercise and resting values are shown in Table 4 and are similar between the latter stages, with the exception of oesophageal temperature and WOB components. Figure 6 displays composite MEFV, FV loops and
  for all subjects and split based on the appearance of EFL. Subjects in panel B did not display any EFL and did not change
  with the administration of the heliox. Conversely, the EFL subjects (panel C) increased
  during heliox breathing. The increased
  during heliox breathing in the EFL group resulted in a greater
  and
and  , while the NEFL group's oxygen tensions remained unchanged (Fig. 7A). The increased
  resulted in a significant rise in
  (Fig. 7B), with no effect on
  . The WOB during heliox inspiration is shown in Fig. 4, and the group mean was significantly lower when compared to similar ventilation on room air. The WOB on heliox was similar to the 1st air condition, despite a greater
  . Conversely, the
  was similar between heliox and the 2nd air stage condition, but the WOB was lower (Fig. 7E). Differences in WOB were primarily due to resistive changes (Fig. 7F). At similar oxygen consumptions (80 and 90%
 ) the
) the  and
and  during the constant load exercise was within 2 mmHg of the graded test and not statistically different, while
  was lower during the constant load bout (41 vs. 35 and 40 vs. 37 mmHg, for 80% and 90%
 , respectively, P < 0.05).
Table 3.
Pulmonary function during air and heliox inspiration (n= 18)
| Air | Heliox | |
|---|---|---|
| FVC (l) | 3.8 ± 0.1 | 3.8 ± 0.1 |
| %Pred | 97 ± 0.1 | 97 ± 0.1 |
| FEV1 (l) | 3.3 ± 0.1 | 3.4 ± 0.1 |
| %Pred | 100 ± 2 | 103 ± 3 |
| FEV1/FVC (%) | 86 ± 1 | 88 ± 4 |
| %Pred | 102 ± 2 | 105 ± 5 |
| PEF (l s−1) | 8.0 ± 0.3 | 10.7 ± 0.5* |
| FEF75 (l s−1) | 6.5 ± 0.2 | 9.5 ± 0.4* |
| FEF50 (l s−1) | 4.4 ± 0.2 | 6.5 ± 0.3* |
| FEF25 (l s−1) | 2.3 ± 0.2 | 3.2 ± 0.2* |
Values are mean ± SEM. FVC, forced vital capacity; Pred, predicted; FEV1, forced expired volume in 1 s; PEF, peak expiratory flow; FEF75, forced expiratory flow at 75% forced vital capacity; FEF50, forced expiratory flow at 50% forced vital capacity; FEF25, forced expiratory flow at 25% forced vital capacity. *Different from heliox, P < 0.05.
Table 4.
Mean data during rest and the constant load exercise bout (n= 18)
| Rest | 1st Air | Heliox | 2nd Air | |
|---|---|---|---|---|
 (mmHg) (mmHg) |
10 ± 1 | 28 ± 2§ | 28 ± 2§ | 29 ± 2§ |
| pH | 7.32 ± 0.01 | 7.34 ± 0.01§ | 7.34 ± 0.01§ | 7.32 ± 0.02 |
| Toes (°C) | 37.3 ± 0.1 | 37.6 ± 0.1§* | 38.1 ± 0.1§ | 38.3 ± 0.1§* |
| K+ (mmol l−1) | 3.6 ± 0.1 | 5.4 ± 0.1§ | 5.3 ± 0.1§ | 5.3 ± 0.1§ |
| HCO3− (mmol l−1) | 17 ± 1 | 19 ± 0.4§ | 18 ± 1§ | 19 ± 1§ |
| Hb (g dl−1) | 12.5 ± 0.2 | 13.1 ± 0.2§ | 13.2 ± 0.2§ | 13.3 ± 0.2§ |
| VT (l) | 0.7 ± 0.03 | 1.8 ± 0.1§ | 1.9 ± 0.1§ | 1.9 ± 0.1§ |
| f (beats min-1) | 17 ± 1 | 40 ± 2§* | 48 ± 3§ | 47 ± 3§ |
 (l min−1) (l min−1) |
0.32 ± 0.01 | 2.6 ± 0.1§* | 2.9 ± 0.1§ | 2.9 ± 0.1§ |
 (l min−1) (l min−1) |
0.26 ± 0.01 | 2.3 ± 0.1§* | 2.7 ± 0.1§ | 2.8 ± 0.1§ |
| RER | 0.81 ± 0.02 | 0.87 ± 0.01§* | 0.94 ± 0.01§ | 0.97 ± 0.02§ |
| VD/VT | 0.2 ± 0.01 | 0.14 ± 0.01§ | 0.16 ± 0.01§ | 0.17 ± 0.01 |
| Ti (%) | 33 ± 1 | 48 ± 1§ | 48 ± 1§ | 47 ± 1§ |
| WOBel (%total) | 69 ± 2 | 55 ± 2§* | 60 ± 2§ | 51 ± 2§* |
| WOBres (%total) | 31 ± 2 | 45 ± 2§* | 40 ± 2§ | 49 ± 2§* |
Values are mean ± SEM.  , alveolar oxygen tension;
  , alveolar-to-arterial oxygen difference; Toes, oesophageal temperature; Hb, haemoglobin; VT, tidal volume; f, breathing frequency;
  , oxygen consumption;
  , carbon dioxide production; RER, respiratory exchange ratio; VD, physiological deadspace; Ti, inspiratory time; VT, tidal volume; WOBel, elastic work of breathing; WOBRes, resistive work of breathing. §Different from rest; *different from heliox, P < 0.05.
Figure 6. Maximal expiratory flow–volume curves, tidal flow–volume loops and minute ventilation for the subset of EIAH subjects (n= 18) split into groups based on the development of expiratory flow limitation during the constant load exercise test.
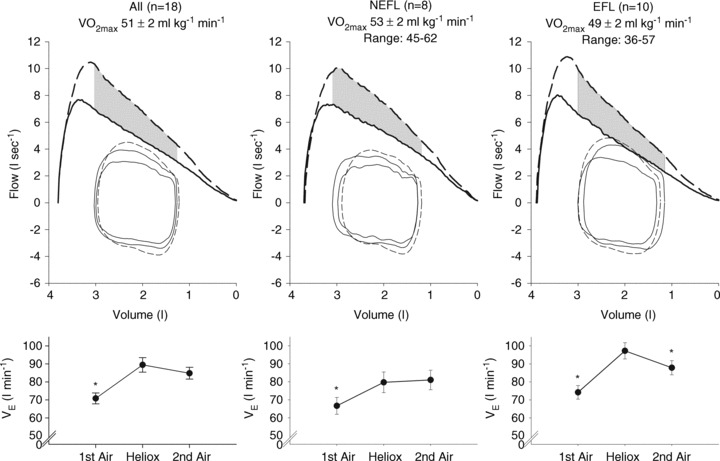
Values are mean averages for each panel's respective number of subjects. Continuous lines represent room air breathing and dashed lines indicate heliox breathing. Grey shaded area in each upper panel represents the increase in ventilatory capacity due to heliox. EFL, expiratory flow limitation; NEFL, no expiratory flow limitation;  , maximal oxygen consumption;
  , expired minute ventilation. *Different from heliox stage, P < 0.05.
Figure 7. Arterial blood gases, oxyhaemoglobin saturation and respiratory mechanics during the constant load exercise bout.
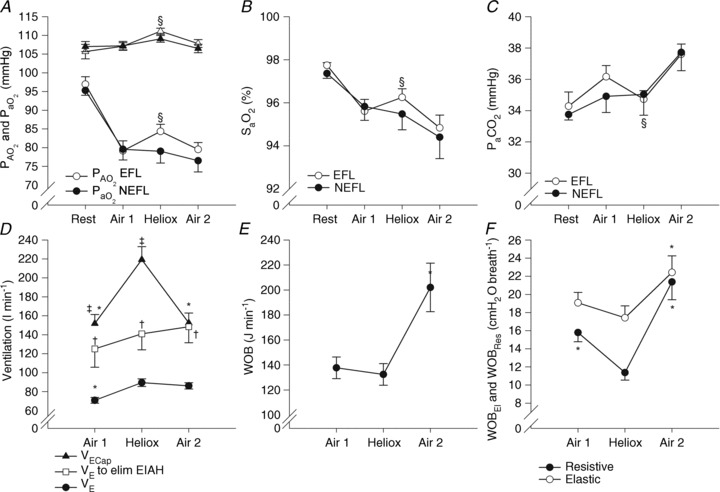
In A, B and C, subjects are divided based on the appearance of expiratory flow limitation during the constant load exercise bout. All subjects are pooled for D, E and F. EFL, expiratory flow limitation; NEFL, no expiratory flow limitation;  , arterial oxygen tension;
  , alveolar oxygen tension;
  , arterial carbon dioxide tension;
  , arterial oxyhaemoglobin saturation; EIAH, exercise-induced arterial hypoxaemia;
  , expired minute ventilation;
  , ventilatory capacity; WOB, work of breathing; WOBEl, elastic work of breathing; WOBRes, resistive work of breathing. §Different from both room air stages; *different from heliox stage; †different from
  at similar stage; ‡different from the
  to eliminate EIAH at similar stage P < 0.05.
Discussion
Major findings
The major findings from this study are fivefold. First, blood gas homeostasis during treadmill exercise in healthy women is variable between subjects, but almost all aerobically trained women ( > 50 ml kg−1 min−1) developed some degree of EIAH. Second, the majority of those developing EIAH do so at submaximal intensities, but with varying patterns. By analysing the different patterns of EIAH we could better understand the underlying mechanisms. Third, untrained women with average aerobic capacities can develop EIAH. Fourth, mechanical ventilatory constraints can lead to EIAH, regardless of aerobic fitness, and prevent full reversal of hypoxaemia in most subjects. Fifth, reversing mechanical constraints partially reverses EIAH in subjects who display EFL. Our findings support the concept that untrained women can develop EIAH and that pulmonary gas exchange in healthy young women appears to be different to that commonly reported in men.
EIAH in healthy young women
We have demonstrated that blood gas homeostasis during treadmill running is less than ideal in young healthy women. To that end, the more aerobically trained one is, the more incomplete pulmonary gas exchange becomes. Specifically, aerobically trained women typically have a lower  and greater
  at maximal exercise compared to less trained women. Yet, we found notable exceptions where women who develop EIAH had modest aerobic capacities. Our findings are similar to those of Harms et al. (1998), but in contrast to Hopkins et al. (2000) who did not report EIAH in women with a
  < 50 ml kg−1 min−1. An explanation of possible discrepancies between the studies is detailed elsewhere (Hopkins & Harms, 2004). Despite the discrepancy, we questioned: what mechanism(s) results in untrained women possibly developing EIAH while untrained men appear not to? One explanation is the apparent increased mechanical ventilatory constraints women display during exercise. In our study, all the untrained subjects with EIAH developed EFL and half did so at submaximal exercise intensities. Furthermore, in some untrained subjects, mechanical constraints (i.e. EFL) appeared to be the primary mechanism responsible for the EIAH because
  was maintained near resting levels until the onset of EFL (Fig. 3D). Conversely, the male respiratory system is thought to be relatively overbuilt, and as such, untrained men possess a large reserve with which to increase ventilation and maintain arterial oxygenation at all exercise intensities. On the other hand, during progressive exercise, some women possess a respiratory system which functions near their ventilatory capacity (as indicated by EFL) despite having a modest fitness level.
Decreases in  relative to resting values result in a decrease in
  , which compromises exercise performance and results in a lowered
  (Harms et al. 2000). All individuals exercising at high intensities develop some degree of arterial desaturation due to temperature- and pH-related shifts in the ODC. However, along with these hyperthermic and acidaemic changes, we observed decreases in
  resulting from the lower
  (Table 1, EIAH group). The EIAH and NEIAH groups showed a similar decrease in
  resulting from temperature and pH; therefore, the lower measured
  in the EIAH group was solely due to
  changes. Despite
  and
and  decreasing significantly in the EIAH group throughout exercise,
  increased. The marked increase in
  observed in both groups could be due to haematoconcentration during exercise which resulted in increased haemoglobin levels or splenic release of erythrocytes (Stewart et al. 2003). However, while both groups increased their
  , the rise in NEIAH subjects was twice that of the EIAH group because they were better able to maintain
  near resting levels. The increase in
  may become important during intense exercise when the arterial-to-venous oxygen difference becomes large and mixed venous
  becomes low (Calbet et al. 2005). However, it is not known if women show similar decreases in mixed venous
  with intense exercise. Noteworthy is that the large
  developed immediately upon exercise initiation and resolved quickly upon termination (as demonstrated by the three subjects with samples taken <20 s after exercise cessation). This phenomenon indicates that the primary mechanism(s) for EIAH is elicited with the onset of exercise and resolves quickly after exercise termination.
To this point we have focused on characterizing the exercise response in subjects demonstrating EIAH. However, it is equally important to emphasize that many subjects did not show any hypoxaemia and demonstrated the typical or expected blood gas response to progressive exercise. For example, one NEIAH subject ( = 46 ml kg−1 min−1) maintained
  in a narrow range (98–101 mmHg), demonstrated an appropriate end-exercise hyperventilation (
 = 34 mmHg) and had a minimal widening of the
  (16 mmHg). As shown in Table 1, the EIAH and NEIAH groups are similar with respect to resting pulmonary function and anthropometric variables. Accordingly, other than high aerobic fitness, it is unlikely that any of the included measures appear to predict whether a healthy woman will develop EIAH. For example, during exercise breathing pattern, operational lung volumes and
  were similar, implying that a specific breathing strategy was not responsible for the observed hypoxaemia. Notably, the EIAH subjects have greater maximal oxygen consumption (Table 2), in both absolute and relative values. The increased metabolic demand explains the higher
  , which results in the greater WOB observed in the EIAH subjects. Others (Anderson & Kippelen, 2005) suggest that the high volumes or rates of air respired by elite athletes during training results in airway/lung injury and could be an underlying mechanism behind EIAH. This is a possibility due to the EIAH group's greater
  . It is unlikely that the lower
  in the NEIAH subjects was due to prematurely terminating exercise, as they became equally acidaemic and had a respiratory exchange ratio over 1.05. Others have shown that airway reactivity and lung inflammatory mediators are not linked to EIAH in young healthy subjects (Wetter et al. 2001, 2002). As such, this probably does not explain the discrepancy between groups. Finally, many of the NEIAH subjects showed a small decrease in
  immediately upon exercise initiation (see ‘Patterns of submaximal EIAH’ below), but not to the extent of the EIAH group. Therefore, the precise factor(s) responsible for why some young healthy women develop EIAH remains elusive.
Patterns of submaximal EIAH
Most subjects in the present study developed EIAH at submaximal intensities which is consistent with other reports (Dempsey et al. 1984; Harms et al. 1998; St Croix et al. 1998; Rice et al. 1999; Durand et al. 2000; Wetter et al. 2001; Romer et al. 2006), but has garnered less attention than EIAH during maximal intensities. Most studies classify subjects in a binary fashion (i.e. EIAH or NEIAH) or by the extent of hypoxaemia at maximal exercise. We suggest that an instructive approach is to analyse the interaction between lung mechanics and gas exchange variables throughout the exercise test. Figure 3 demonstrates this approach, allowing for examination of the patterns of hypoxaemia and provides insight into potential mechanisms for submaximal EIAH. Subjects in panel A have a consistent decrease in  resulting from an increasing
  . No EFL is present and they have considerable capacity to increase
  (Dempsey et al. 1984; Wagner et al. 1986) implying this gas exchange inefficiency is unrelated to respiratory mechanics. Subjects in panel B have a similar
  , MEFV curve and tidal FV response to subjects in panel A, but the pattern of
  change is noticeably different. Their
  decreases immediately and continues to do so until 80%
 , at which point it increases towards resting levels. The mechanism(s) of EIAH during submaximal exercise is assumed to be different, as one is progressive (panel A), whereas the other is immediate and partially reversible (panel B). Subjects in panel C are similar to those in panels A and B with respect to respiratory mechanics and
  , yet they demonstrate another pattern of submaximal EIAH. Immediately upon exercise onset,
  decreases but changes little thereafter. Why do the subjects in panel B increase their
  while those in panel C do not? Both groups have the capacity to increase their
  , but only panel B's subjects do. Differences in resting ventilatory sensitivity are a plausible explanation; however, its relationship to EIAH is not consistent (Hopkins & McKenzie, 1989; Harms & Stager, 1995; Guenette et al. 2004). As such, measures of ventilatory sensitivity during exercise could provide insight.
In Fig. 3D,  is maintained near resting levels until the onset of EFL, at which point
  is constrained. Subsequently,
  decreases while the
  remains stable and
  increases. Our observation of mechanically induced relative alveolar hypoventilation has been reported in highly trained men (Johnson et al. 1992). Subjects in panel E show an immediate decrease in
  which increases towards resting levels. However, the subjects in panel E also develop EFL during maximal exercise and are unable to increase their
  , suggesting that the constraint on
  prevents
  from increasing to levels similar to those of the subjects in panel B. Subjects in panel F display a comparable immediate fall in
  to that in panels B, C and E, but this is followed by a persistent plateau. Unlike the subjects in panel C, these subjects are further confounded by the presence of EFL at maximal exercise. Therefore, it is not possible to determine whether their lack of sufficient
  increase is due to mechanical constraints or a blunted ventilatory drive.
Previously, EIAH was explained using the ‘Demand vs. Capacity’ concept, whereby increasing demand for pulmonary ventilation is not adequately achieved due to a fixed capacity (Dempsey, 1986). While the ‘Demand vs. Capacity’ theory explains EIAH observed during maximal exercise intensities and/or when EIAH progressively worsens, it does explain our submaximal observations. As such, the question remains: why do some individuals tolerate submaximal EIAH if they have the ventilatory capacity to reverse it? We are unable to provide any direct evidence; however, these important observations merit comment and we cautiously describe possible explanations. First, submaximal EIAH could have little consequence to exercise tolerance or performance. Second, submaximal EIAH could represent a lag between exercise onset and the associated chemical and neural changes necessary to elicit an appropriate ventilatory response. Third, submaximal EIAH may result from a specific exercise modality or intensity. Specifically, submaximal EIAH (and EIAH in general) is most readily seen during treadmill exercise (Dempsey et al. 1984; Hopkins et al. 2000) and not routinely observed by others despite testing highly trained individuals completing whole-body exercise (e.g. cross country skiing) (Calbet et al. 2005). We cautiously suggest that higher impact exercise (running) causes a disturbance in gas exchange that may not be elicited during lower-impact exercise (cycling, skiing, rowing). Previously, EFL was suggested to cause non-uniformity in ventilation distribution by compressing small airways due to increased intrathoracic pressure (Johnson et al. 1992). Running consistently causes transient pressure changes observed when using an oesophageal balloon and previous work has already demonstrated that altering intra-thoracic pressure during tidal breathing can affect central haemodynamics (Miller et al. 2006). Perhaps tolerating EIAH is a ‘strategy’ to minimize the potential negative consequences of increasing exercise hyperpnoea and excessive WOB, such as: increased  of breathing (Aaron et al. 1992), diaphragm fatigue (Johnson et al. 1993) or reduced limb blood flow (Harms et al. 1997). Thus, natural lung and chest-wall mechanics are preserved at the expense of worsening arterial hypoxaemia. Unfortunately, there is little direct evidence to support the above theories. Nonetheless, these hypotheses warrant investigation and greater attention, as submaximal EIAH is clearly present in many individuals and remains poorly understood.
Role of mechanical constraints
The respiratory system exhibits few, if any, positive adaptations to aerobic training (Saltin et al. 1968). In our study and others (Newman et al. 1962; Reuschlein et al. 1968; Martin & May, 1987; McClaran et al. 1998), subjects with higher  did not necessarily have superior pulmonary function. As such, a person's
  is largely determined by anatomical features such as lung size and airway size/geometry (Green et al. 1974). Therefore, women, by virtue of their smaller lungs and airways (Mead, 1980; Sheel et al. 2009) have a smaller
  and are especially susceptible to mechanical ventilatory constraints during exercise (Wanke et al. 1991; Guenette et al. 2007). In the present study, subjects with the most mechanical constraints also had a smaller dysanapsis ratio, indicating their airways, on average, are narrower. We have identified three different roles regarding mechanical ventilatory constraints and EIAH in healthy young women. First, in some women, mechanical constraints (i.e. EFL) appear to be the primary mechanism responsible for EIAH by resulting in relative alveolar hypoventilation (Fig. 3D). Unlike men, women, irrespective of aerobic fitness, readily develop EFL (Dominelli et al. 2011); as such, this relationship may explain why some untrained women and not men develop EIAH. Second, mechanical constraints prevent adequate compensatory alveolar hyperventilation which effectively raises
  despite a large
  . In these subjects, at (near) maximal exercise, significant EFL prevents
  from sufficiently increasing. However, unlike the previous example, these subjects already developed EIAH prior to EFL onset; therefore, mechanical constraints serve to exacerbate the hypoxaemia, but are not the initial causative mechanism. Third, in most women who develop EIAH, the
  required to fully reverse the hypoxaemia is substantially higher than the observed ventilation. In Fig. 5A, the EFL group, by virtue of their smaller midrange flow and dysanapsis ratio, have a reduced
  compared to the NEFL group. However, the groups have a similar
  and demonstrate a similar degree of hypoxaemia. Therefore, their
  predicted to reverse EIAH approaches only the EFL group's
  . Moreover, while EFL does not always directly lead to EIAH, the reduced
  of mechanically limited subjects does not allow appropriate increases in
  to offset the hypoxaemia, whereas, the NEFL group can potentially increase
  . In contrast, at
  the EIAH group would have to increase their
  ∼50 l min−1 and would approach their mechanical ventilatory limit in order to increase
  to resting levels. Based on the regression in Fig. 5, we can estimate that the WOB for a
  over 150 l min−1 (necessary to reverse the hypoxaemia) would be ∼650 J min−1 and twice that of the EIAH (323 J min−1).
During the constant load exercise test, we manipulated mechanical ventilatory constraints while subjects exhibited EIAH. Previously, heliox inspiration has been used in women who develop EIAH (McClaran et al. 1998), but neither arterial blood gas status or the WOB was evaluated. Independent from the heliox, we demonstrate that EIAH does not have a carry-over effect on subsequent exercise bouts. We found that at similar oxygen consumptions,  and
and  are not different, while
  is lower. This has been previously shown during maximal exercise (St Croix et al. 1998) and our findings confirm this phenomenon during submaximal intensities. Breathing heliox lowered the WOB by 43 ± 2% (range: 17–56%), removed virtually all EFL and considerably expanded
  , principally eliminating mechanical ventilatory constraints. Despite these,
  was only partially improved with heliox, a finding previously shown in trained men (Dempsey et al. 1984). Specifically, those without EFL did not increase their
  during heliox breathing, despite a decreased energetic cost and the ability to partially raise
  and reverse the EIAH. Conversely, those who developed EFL took advantage of greater expiratory flows and increased their
  which offset some of the EIAH. As only the subjects with EFL increased their
  during heliox inspiration, the relative alveolar hypoventilation is probably related to mechanical constraints, rather than a blunted ventilatory drive. Unique to our data set was untrained women developing EIAH which was partially reversed with heliox at a submaximal intensity. This suggests that mechanical constraints play a greater mechanistic role in the onset of EIAH in women.
Sex differences
We did not assess male subjects, therefore, direct comparison between the sexes are not possible, but our observations merit general comparisons to the body of literature. In our study and others (Harms et al. 1998; Dominelli et al. 2012) some women who are not aerobically trained developed EIAH, although this is controversial (Hopkins et al. 2000; Olfert et al. 2004). Conversely, to our knowledge, there are no published reports of untrained men developing EIAH. The specific prevalence of EIAH in trained men is unknown, but most studies find it occurs in roughly half of subjects (Powers et al. 1988; Dempsey & Wagner, 1999). We found EIAH to occur in 65% of all women (trained and untrained) and 93% of our trained subjects. However, we stress the continued lack of adequate epidemiological evidence, using best methodologies, to determine the true population prevalence of EIAH. Nonetheless, it appears that trained men are equally likely to develop or not develop EIAH, whereas, in trained women, the exception is those who do not. However, evidence regarding the specific effect of aerobic training on blood gas is present (Rowell et al. 1964; Miyachi & Katayama, 1999), but not fully elucidated. Finally, mechanical ventilatory constraints are related to EIAH in some highly aerobically trained ( 73 ± 1 ml kg−1 min−1) men (Johnson et al. 1992). Conversely, we found that mechanical ventilatory constraints directly lead to EIAH in women of varying fitness levels (
 44–54 ml kg−1 min−1) and 55% of our EIAH group developed EFL, which prevents compensatory hyperventilation. Overall, our data support the idea that women are more prone to developing EIAH (Hopkins & Harms, 2004) and this may, in part, be due to their increased mechanical ventilatory constraints.
Conclusion
Four conclusions can be drawn from our study. First, most aerobically trained women and some untrained women develop EIAH during treadmill exercise. Second, most women who develop EIAH begin to do so at submaximal exercise intensities. However, the pattern of submaximal hypoxaemia appears to differ amongst subjects, suggesting there are multiple mechanisms responsible for submaximal EIAH. Third, mechanical ventilatory constraints have several roles with regards to gas exchange impairments in women. Specifically, mechanical constraints can directly lead to EIAH, prevent adequate compensatory hyperventilation near maximal exercise and/or constrain ventilatory capacity to a rate which is unable to fully reverse the hypoxaemia. Finally, reversing mechanical constraints with heliox partially reverses EIAH in subjects who display EFL. Overall, women of all aerobic fitness levels develop EIAH during all exercise intensities and mechanical ventilatory constraints are a contributing mechanism, but not the exclusive cause.
Acknowledgments
We are indebted to our research subjects for their patience, commitment and enthusiastic participation in this study.
Glossary
- A – aDO2
alveolar-to-arterial oxygen difference
- EIAH
exercise-induced arterial hypoxaemia
- EFL
expiratory flow limitation
- FV
flow–volume
- MEFV
maximal expiratory flow–volume
- NEIAH
no exercise-induced arterial hypoxaemia
- NEFL
no expiratory flow limitation
- ODC
oxygen disassociation curve
- WOB
work of breathing
Additional information
Competing interests
None.
Author contributions
P.B.D. contributed to the conception, design of the experiment, data collection, analysis and interpretation, and drafted the article; G.E.F. contributed to the conception, design of the experiment, data collection, analysis and interpretation, and drafted the article; G.S.D. contributed to the design of the experiment, data collection and interpretation, and drafted the article; W.R.H. contributed to the design of the experiment, data collection and interpretation, and drafted the article; M.S.K. contributed to the conception, design of the experiment, data collection, interpretation, and drafted the article; D.C.M. contributed to the conception, design of the experiment, interpretation, and drafted the article; A.W.S. contributed to the conception, design of the experiment, data collection, analysis and interpretation, and drafted the article. All authors approved the final version of the manuscript.
Funding
This study was supported by the Natural Sciences and Engineering Research Council (NSERC) of Canada. P. B. Dominelli was supported by a Canada Graduate Scholarship from NSERC. G. E. Foster was supported by: (1) a postdoctoral fellowship from NSERC, (2) a focus-on-stroke research fellowship funded by the Heart and Stroke Foundation of Canada, the Canadian Stroke Network, the Canadian Institutes of Health Research (CIHR) Institute of Circulatory and Respiratory Health and the CIHR Institute of Aging, and (3) a research award from the Michael Smith Foundation for Health Research. W. R. Henderson was supported by a Four-Year Fellowship from the University of British Columbia.
Supplementary material
Supplemental Information
References
- Aaron EA, Seow KC, Johnson BD, Dempsey JA. Oxygen cost of exercise hyperpnea: implications for performance. J Appl Physiol. 1992;72:1818–1825. doi: 10.1152/jappl.1992.72.5.1818. [DOI] [PubMed] [Google Scholar]
- Anderson S, Kippelen P. Exercise-induced bronchoconstriction: Pathogenesis. Curr Allergy Asthma Rep. 2005;5:116–122. doi: 10.1007/s11882-005-0084-y. [DOI] [PubMed] [Google Scholar]
- Anselme F, Caillaud C, Couret I, Rossi M, Prefaut C. Histamine and exercise-induced hypoxemia in highly trained athletes. J Appl Physiol. 1994;76:127–132. doi: 10.1152/jappl.1994.76.1.127. [DOI] [PubMed] [Google Scholar]
- ATS. Standardization of spirometry, 1994 update. Am J Respir Crit Care Med. 1995;152:1107–1136. doi: 10.1164/ajrccm.152.3.7663792. American Thoracic Society. [DOI] [PubMed] [Google Scholar]
- Babb TG. Ventilatory response to exercise in subjects breathing CO2 or HeO2. J Appl Physiol. 1997;82:746–754. doi: 10.1152/jappl.1997.82.3.746. [DOI] [PubMed] [Google Scholar]
- Calbet JAL, Boushel R, Radegran G, Sondergaard H, Wagner PD, Saltin B. Determinants of maximal oxygen uptake in severe acute hypoxia. Am J Physiol Regul Integr Comp Physiol. 2003;284:R291–R303. doi: 10.1152/ajpregu.00155.2002. [DOI] [PubMed] [Google Scholar]
- Calbet JAL, Holmberg H-C, Rosdahl H, van Hall G, Jensen-Urstad M, Saltin B. Why do arms extract less oxygen than legs during exercise. Am J Physiol Regul Integr Comp Physiol. 2005;289:R1448–R1458. doi: 10.1152/ajpregu.00824.2004. [DOI] [PubMed] [Google Scholar]
- Dempsey JA. Is the lung built for exercise. Med Sci Sports Exerc. 1986;18:143–155. [PubMed] [Google Scholar]
- Dempsey JA, Hanson PG, Henderson KS. Exercise-induced arterial hypoxaemia in healthy human subjects at sea level. J Physiol. 1984;355:161–175. doi: 10.1113/jphysiol.1984.sp015412. [DOI] [PMC free article] [PubMed] [Google Scholar]
- Dempsey JA, Wagner PD. Exercise-induced arterial hypoxemia. J Appl Physiol. 1999;87:1997–2006. doi: 10.1152/jappl.1999.87.6.1997. [DOI] [PubMed] [Google Scholar]
- Derchak PA, Stager JM, Tanner DA, Chapman RF. Expiratory flow limitation confounds ventilatory response during exercise in athletes. Med Sci Sports Exerc. 2000;32:1873–1879. doi: 10.1097/00005768-200011000-00009. [DOI] [PubMed] [Google Scholar]
- Dominelli PB, Foster GE, Dominelli GS, Querido JS, Henderson WR, Koehle MS, Sheel AW. Repeated exercise-induced arterial hypoxemia in a healthy untrained woman. Respir Physiol Neurobiol. 2012;183:201–205. doi: 10.1016/j.resp.2012.06.021. [DOI] [PubMed] [Google Scholar]
- Dominelli PB, Guenette JA, Wilkie SS, Foster GE, Sheel AW. Determinants of expiratory flow limitation in healthy women during exercise. Med Sci Sports Exerc. 2011;43:1666–1674. doi: 10.1249/MSS.0b013e318214679d. [DOI] [PubMed] [Google Scholar]
- Durand F, Mucci P, Prefaut C. Evidence for an inadequate hyperventilation inducing arterial hypoxemia at submaximal exercise in all highly trained endurance athletes. Med Sci Sports Exerc. 2000;32:926–932. doi: 10.1097/00005768-200005000-00008. [DOI] [PubMed] [Google Scholar]
- Green M, Mead J, Turner JM. Variability of maximum expiratory flow-volume curves. J Appl Physiol. 1974;37:67–74. doi: 10.1152/jappl.1974.37.1.67. [DOI] [PubMed] [Google Scholar]
- Guenette JA, Diep TT, Koehle MS, Foster GE, Richards JC, Sheel AW. Acute hypoxic ventilatory response and exercise-induced arterial hypoxemia in men and women. Respir Physiol Neurobiol. 2004;143:37–48. doi: 10.1016/j.resp.2004.07.004. [DOI] [PubMed] [Google Scholar]
- Guenette JA, Dominelli PB, Reeve SS, Durkin CM, Eves ND, Sheel AW. Effect of thoracic gas compression and bronchodilation on the assessment of expiratory flow limitation during exercise in healthy humans. Respir Physiol Neurobiol. 2010;170:279–286. doi: 10.1016/j.resp.2010.01.017. [DOI] [PubMed] [Google Scholar]
- Guenette JA, Querido JS, Eves ND, Chua R, Sheel AW. Sex differences in the resistive and elastic work of breathing during exercise in endurance-trained athletes. Am J Physiol Regul Integr Comp Physiol. 2009;297:R166–R175. doi: 10.1152/ajpregu.00078.2009. [DOI] [PubMed] [Google Scholar]
- Guenette JA, Witt JD, McKenzie DC, Road JD, Sheel AW. Respiratory mechanics during exercise in endurance-trained men and women. J Physiol. 2007;581:1309–1322. doi: 10.1113/jphysiol.2006.126466. [DOI] [PMC free article] [PubMed] [Google Scholar]
- Harms CA, Babcock MA, McClaran SR, Pegelow DF, Nickele GA, Nelson WB, Dempsey JA. Respiratory muscle work compromises leg blood flow during maximal exercise. J Appl Physiol. 1997;82:1573–1583. doi: 10.1152/jappl.1997.82.5.1573. [DOI] [PubMed] [Google Scholar]
- Harms CA, McClaran SR, Nickele GA, Pegelow DF, Nelson WB, Dempsey JA. Exercise-induced arterial hypoxaemia in healthy young women. J Physiol. 1998;507:619–628. doi: 10.1111/j.1469-7793.1998.619bt.x. [DOI] [PMC free article] [PubMed] [Google Scholar]
- Harms CA, McClaran SR, Nickele GA, Pegelow DF, Nelson WB, Dempsey JA. Effect of exercise-induced arterial O2 desaturation on VO2max in women. Med Sci Sports Exerc. 2000;32:1101–1108. doi: 10.1097/00005768-200006000-00010. [DOI] [PubMed] [Google Scholar]
- Harms CA, Stager JM. Low chemoresponsiveness and inadequate hyperventilation contribute to exercise-induced hypoxemia. J Appl Physiol. 1995;79:575–580. doi: 10.1152/jappl.1995.79.2.575. [DOI] [PubMed] [Google Scholar]
- Holmgren A, Linderholm H. Oxygen and carbon dioxide tensions of arterial blood during heavy and exhaustive exercise. Acta Physiol Scand. 1958;44:203–215. doi: 10.1111/j.1748-1716.1958.tb01622.x. [DOI] [PubMed] [Google Scholar]
- Hopkins SR, Barker RC, Brutsaert TD, Gavin TP, Entin P, Olfert IM, Veisel S, Wagner PD. Pulmonary gas exchange during exercise in women: effects of exercise type and work increment. J Appl Physiol. 2000;89:721–730. doi: 10.1152/jappl.2000.89.2.721. [DOI] [PubMed] [Google Scholar]
- Hopkins SR, Gavin TP, Siafakas NM, Haseler LJ, Olfert IM, Wagner H, Wagner PD. Effect of prolonged, heavy exercise on pulmonary gas exchange in athletes. J Appl Physiol. 1998;85:1523–1532. doi: 10.1152/jappl.1998.85.4.1523. [DOI] [PubMed] [Google Scholar]
- Hopkins SR, Harms CA. Gender and pulmonary gas exchange during exercise. Exerc Sport Sci Rev. 2004;32:50–56. doi: 10.1097/00003677-200404000-00003. [DOI] [PubMed] [Google Scholar]
- Hopkins SR, McKenzie DC. Hypoxic ventilatory response and arterial desaturation during heavy work. J Appl Physiol. 1989;67:1119–1124. doi: 10.1152/jappl.1989.67.3.1119. [DOI] [PubMed] [Google Scholar]
- Johnson BD, Babcock MA, Suman OE, Dempsey JA. Exercise-induced diaphragmatic fatigue in healthy humans. J Physiol. 1993;460:385–405. doi: 10.1113/jphysiol.1993.sp019477. [DOI] [PMC free article] [PubMed] [Google Scholar]
- Johnson BD, Saupe KW, Dempsey JA. Mechanical constraints on exercise hyperpnea in endurance athletes. J Appl Physiol. 1992;73:874–886. doi: 10.1152/jappl.1992.73.3.874. [DOI] [PubMed] [Google Scholar]
- Johnson BD, Scanlon PD, Beck KC. Regulation of ventilatory capacity during exercise in asthmatics. J Appl Physiol. 1995;79:892–901. doi: 10.1152/jappl.1995.79.3.892. [DOI] [PubMed] [Google Scholar]
- Lefrant JY, Muller L, de La Coussaye JE, Benbabaali M, Lebris C, Zeitoun N, Mari C, Saïssi G, Ripart J, Eledjam JJ. Temperature measurement in intensive care patients: comparison of urinary bladder, oesophageal, rectal, axillary, and inguinal methods versus pulmonary artery core method. Intensive Care Med. 2003;29:414–418. doi: 10.1007/s00134-002-1619-5. [DOI] [PubMed] [Google Scholar]
- McClaran SR, Harms CA, Pegelow DF, Dempsey JA. Smaller lungs in women affect exercise hyperpnea. J Appl Physiol. 1998;84:1872–1881. doi: 10.1152/jappl.1998.84.6.1872. [DOI] [PubMed] [Google Scholar]
- MacNutt MJ, De Souza MJ, Tomczak SE, Homer JL, Sheel AW. Resting and exercise ventilatory chemosensitivity across the menstrual cycle. J Appl Physiol. 2012;112:737–747. doi: 10.1152/japplphysiol.00727.2011. [DOI] [PubMed] [Google Scholar]
- Martin DE, May DF. Pulmonary function characteristics in elite women distance runners. Int J Sports Med. 1987;8(Suppl. 2):84–90. doi: 10.1055/s-2008-1025711. [DOI] [PubMed] [Google Scholar]
- Mead J. Dysanapsis in normal lungs assessed by the relationship between maximal flow, static recoil, and vital capacity. Am Rev Respir Dis. 1980;121:339–342. doi: 10.1164/arrd.1980.121.2.339. [DOI] [PubMed] [Google Scholar]
- Milic-Emili J, Mead J, Turner JM, Glauser EM. Improved technique for estimating pleural pressure from esophageal balloons. J Appl Physiol. 1964;19:207–211. doi: 10.1152/jappl.1964.19.2.207. [DOI] [PubMed] [Google Scholar]
- Miller JD, Hemauer SJ, Smith CA, Stickland MK, Dempsey JA. Expiratory threshold loading impairs cardiovascular function in health and chronic heart failure during submaximal exercise. J Appl Physiol. 2006;101:213–227. doi: 10.1152/japplphysiol.00862.2005. [DOI] [PubMed] [Google Scholar]
- Miyachi M, Katayama K. Effects of maximal interval training on arterial oxygen desaturation and ventilation during heavy exercise. Jpn J Physiol. 1999;49:401–407. doi: 10.2170/jjphysiol.49.401. [DOI] [PubMed] [Google Scholar]
- Newman F, Smalley BF, Thomson ML. Effect of exercise, body and lung size on CO diffusion in athletes and nonathletes. J Appl Physiol. 1962;17:649–655. doi: 10.1152/jappl.1962.17.4.649. [DOI] [PubMed] [Google Scholar]
- Nielsen HB, Madsen P, Svendsen LB, Roach RC, Secher NH. The influence of PaO2, pH and SaO2 on maximal oxygen uptake. Acta Physiol Scand. 1998;164:89–97. doi: 10.1046/j.1365-201X.1998.00405.x. [DOI] [PubMed] [Google Scholar]
- Olfert IM, Balouch J, Kleinsasser A, Knapp A, Wagner H, Wagner PD, Hopkins SR. Does gender affect human pulmonary gas exchange during exercise. J Physiol. 2004;557:529–541. doi: 10.1113/jphysiol.2003.056887. [DOI] [PMC free article] [PubMed] [Google Scholar]
- Otis AB. Handbook of Physiology. I. Washington, DC, USA: American Physiological Society; 1964. The work of breathing; pp. 463–476. section 3, chap. 17. [Google Scholar]
- Powers S, Dodd S, Lawler J, Landry G, Kirtley M, McKnight T, Grinton S. Incidence of exercise induced hypoxemia in elite endurance athletes at sea level. Eur J Appl Physiol Occup Physiol. 1988;58:298–302. doi: 10.1007/BF00417266. [DOI] [PubMed] [Google Scholar]
- Powers SK, Lawler J, Dempsey JA, Dodd S, Landry G. Effects of incomplete pulmonary gas exchange on VO2max. J Appl Physiol. 1989;66:2491–2495. doi: 10.1152/jappl.1989.66.6.2491. [DOI] [PubMed] [Google Scholar]
- Reuschlein PS, Reddan WG, Burpee J, Gee JB, Rankin J. Effect of physical training on the pulmonary diffusing capacity during submaximal work. J Appl Physiol. 1968;24:152–158. doi: 10.1152/jappl.1968.24.2.152. [DOI] [PubMed] [Google Scholar]
- Rice AJ, Scroop GC, Gore CJ, Thornton AT, Chapman M, Greville HW, Holmes M, Scicchitano R. Exercise-induced hypoxaemia in highly trained cyclists at 40% peak oxygen uptake. Eur J Appl Physiol Occup Physiol. 1999;79:353–359. doi: 10.1007/s004210050520. [DOI] [PubMed] [Google Scholar]
- Romer LM, Haverkamp HC, Lovering AT, Pegelow DF, Dempsey JA. Effect of exercise-induced arterial hypoxemia on quadriceps muscle fatigue in healthy humans. Am J Physiol Regul Integr Comp Physiol. 2006;290:R365–R375. doi: 10.1152/ajpregu.00332.2005. [DOI] [PubMed] [Google Scholar]
- Rowell LB, Taylor HL, Wang Y, Carlson WS. Saturation of arterial blood with oxygen during maximal exercise. J Appl Physiol. 1964;19:284–286. doi: 10.1152/jappl.1964.19.2.284. [DOI] [PubMed] [Google Scholar]
- Saltin B, Blomqvist G, Mitchell JH, Johnson RL, Wildenthal K, Chapman CB, Frenkel E, Norton W, Siperstein M, Suki W, Vastagh G, Prengler A. A longitudinal study of adaptive changes in oxygen transport and body composition. Circulation. 1968;38(Suppl. VII):VII-1–VII-78. [Google Scholar]
- Scroop GC, Shipp NJ. Exercise-induced hypoxemia: Fact or fallacy. Med Sci Sports Exerc. 2010;42:120–126. doi: 10.1249/MSS.0b013e3181ad0117. [DOI] [PubMed] [Google Scholar]
- Severinghaus JW. Blood gas calculator. J Appl Physiol. 1966;21:1108–1116. doi: 10.1152/jappl.1966.21.3.1108. [DOI] [PubMed] [Google Scholar]
- Sheel AW, Edwards MR, Hunte GS, McKenzie DC. Influence of inhaled nitric oxide on gas exchange during normoxic and hypoxic exercise in highly trained cyclists. J Appl Physiol. 2001;90:926–932. doi: 10.1152/jappl.2001.90.3.926. [DOI] [PubMed] [Google Scholar]
- Sheel AW, Guenette JA, Yuan R, Holy L, Mayo JR, McWilliams AM, Lam S, Coxson HO. Evidence for dysanapsis using computed tomographic imaging of the airways in older ex-smokers. J Appl Physiol. 2009;107:1622–1628. doi: 10.1152/japplphysiol.00562.2009. [DOI] [PMC free article] [PubMed] [Google Scholar]
- St Croix CM, Harms CA, McClaran SR, Nickele GA, Pegelow DF, Nelson WB, Dempsey JA. Effects of prior exercise on exercise-induced arterial hypoxemia in young women. J Appl Physiol. 1998;85:1556–1563. doi: 10.1152/jappl.1998.85.4.1556. [DOI] [PubMed] [Google Scholar]
- Stewart IB, Warburton DER, Hodges ANH, Lyster DM, McKenzie DC. Cardiovascular and splenic responses to exercise in humans. J Appl Physiol. 2003;94:1619–1626. doi: 10.1152/japplphysiol.00040.2002. [DOI] [PubMed] [Google Scholar]
- Wagner PD, Gale GE, Moon RE, Torre-Bueno JR, Stolp BW, Saltzman HA. Pulmonary gas exchange in humans exercising at sea level and simulated altitude. J Appl Physiol. 1986;61:260–270. doi: 10.1152/jappl.1986.61.1.260. [DOI] [PubMed] [Google Scholar]
- Wanke T, Formanek D, Schenz G, Popp W, Gatol H, Zwick H. Mechanical load on the ventilatory muscles during an incremental cycle ergometer test. Eur Respir J. 1991;4:385–392. [PubMed] [Google Scholar]
- Wetter TJ, St Croix CM, Pegelow DF, Sonetti DA, Dempsey JA. Effects of exhaustive endurance exercise on pulmonary gas exchange and airway function in women. J Appl Physiol. 2001;91:847–858. doi: 10.1152/jappl.2001.91.2.847. [DOI] [PubMed] [Google Scholar]
- Wetter TJ, Xiang Z, Sonetti DA, Haverkamp HC, Rice AJ, Abbasi AA, Meyer KC, Dempsey JA. Role of lung inflammatory mediators as a cause of exercise-induced arterial hypoxemia in young athletes. J Appl Physiol. 2002;93:116–126. doi: 10.1152/japplphysiol.01095.2001. [DOI] [PubMed] [Google Scholar]
Associated Data
This section collects any data citations, data availability statements, or supplementary materials included in this article.