Abstract
Single-particle electron cryo-microscopy is undergoing a technical revolution due to the recent developments of direct detectors. These new recording devices detect electrons directly (i.e. without conversion into light) and feature significantly improved detective quantum efficiencies and readout rates as compared to photographic films or CCDs. We evaluated here the potential of one such detector (Gatan K2 Summit) to enable the achievement of near-atomic resolution reconstructions of biological specimens when coupled to a widely used, mid-range transmission electron microscope (FEI TF20 Twin). Compensating for beam-induced motion and stage drift provided a 4.4 Å resolution map of Sulfolobus Turreted Icosahedral Virus (STIV), which we used as a test particle in this study. Several motion correction and dose fractionation procedures were explored and we describe their influence on the resolution of the final reconstruction. We also compared the quality of this data to that collected with a FEI Titan Krios microscope equipped with a Falcon I direct detector, which provides a benchmark for data collected using a high-end electron microscope.
1. Introduction
Single-particle electron cryomicroscopy (cryoEM) is an increasingly important technique in structural biology, which enables the study of biological macromolecules in a near-native environment. Recent developments have allowed the achievement of several near-atomic resolution 3D reconstructions validating theoretical predictions made about the potential of this method nearly 20 years ago (Henderson, 1995). Just over a dozen icosahedral virus structures have been reported at a resolution of ~4Å since 2008, allowing for the visualization of the protein backbone as well as some amino-acid side chain densities for the first time using single-particle cryoEM (Bi et al., 2012; D.-H. Chen et al., 2011; J. Z. Chen et al., 2009; Jiang et al., 2008; Lerch et al., 2012; H. Liu et al., 2010; X. Liu et al., 2010; Settembre et al., 2011; Wolf et al., 2010; Yang et al., 2012; Yu et al., 2008; R Zhang et al., 2011; Xing Zhang et al., 2010; 2008; Xinzheng Zhang et al., 2012). Despite this tremendous step forward, until the beginning of this year near-atomic resolution maps have been obtained only for large icosahedral viruses and have required averaging hundreds of thousand to millions of asymmetric units. These results are still lagging far behind theoretical expectations due to the poor contrast of cryoEM images arising from the low dose used to prevent the molecules from being disintegrated by the electron-beam (Henderson, 1995). Besides radiation damage, beam-induced sample movement and the quality of image recording devices have been proposed as key factors accounting for the loss of contrast in cryoEM (Glaeser and Hall, 2011; Grigorieff and Harrison, 2011; Henderson, 1992; Henderson and McMullan, 2013).
Recently, a new generation of detectors has been developed on the basis of Complementary Metal-Oxide Semiconductors (CMOS) and has held the promise to overcome the two aforementioned limiting factors. They are designated as “direct detectors” due to their ability to directly detect incoming electrons, without the need for a scintillator converting the signal into light, and are characterized by an improved Detective Quantum Efficiency (DQE) at all spatial frequencies compared to traditional Charge-Coupled Device (CCD) cameras and even photographic film. Moreover, their enhanced readout rates allow for the collection of data as movies composed of several frames, during the time lapse previously corresponding to a single exposure, and correcting for beam-induced sample movement (Brilot et al., 2012; Shigematsu and Sigworth, 2013). We recently reported the icosahedral reconstruction of the 70 MDa Rotavirus double-layered particle at ~4.4 Å resolution using 807 particle images (629,460 asymmetric units) from movies recorded with a DE-12 camera operated at 25 frames per seconds (Campbell et al., 2012). Subsequently, an asymmetric reconstruction of a 4MDa eukaryotic ribosome was published at a resolution of ~4 Å using 30,000 particle images recorded at 16 frames per second with a FEI Falcon II camera (Bai et al., 2013). Most recently, a 3.3 Å resolution cryoEM structure of a 700 kDa archaeal proteasome (with D7 symmetry) was obtained with 126,729 particle images (1,774,206 subunits) and the electron-counting capabilities of the Gatan K2 Summit detector (requiring acquisition and internal processing of 400 frames per seconds) (Li et al., 2013). These outcomes represent a revolution in the cryoEM field and pave the way toward the routine achievement of near-atomic resolution reconstructions for samples of moderate size and symmetry in the near future.
We describe here the characterization of the ability of an FEI TF20 Twin electron microscope to produce data suitable for obtaining high-resolution reconstructions when coupled to a Gatan K2 Summit direct detector. Sulfolobus Turreted Icosahedral Virus (STIV) was used as a test particle to demonstrate that near-atomic resolution reconstructions can reproducibly be achieved with a midrange electron microscope (operating at 200kV) when accounting for beam-induced motion and stage drift (Campbell et al., 2012). We tested several data processing schemes of the direct detector data and describe their influence on the resolution and quality of the final reconstruction. Finally, the availability of data collected on the same sample with a FEI Titan Krios microscope equipped with an FEI Falcon I direct detector provided us with the unique opportunity to compare the quality of the two data sets and evaluate the influence of technical differences (Veesler et al., 2013). We found that the reconstruction obtained with the latter high-end microscope is improved as compared to the one resulting from the mid-range TF20 microscope although both strategies yielded structures at near-atomic resolution with excellent interpretability. This study constitutes an attempt at benchmarking microscopes and direct detection devices in terms of their performances to yield high-resolution 3D maps and we hope that it can serve as a basis for selecting an appropriate data collection strategy for future experiments.
2. Material and methods
2.1 Data collection
STIV mature virions were prepared as previously described (Veesler et al., 2013). Three microliters of sample were applied to a 1.2/1.3 C-flat grid (Protochips), which had been plasma-cleaned for 6s at 20mA using a Gatan Solarus. Thereafter, grids were plunge-frozen in liquid ethane using a Gatan CP3 and a blotting time of 3 s. Data were acquired using a FEI Tecnai TF20 Twin transmission electron microscope operated at 200 kV equipped with a Gatan K2 Summit direct detector and a Gatan 626 side entry cryoholder. A condenser aperture of 50 μm and an objective aperture of 100 μm were used (the resolution limit imposed by this latter is 1.2 Å). After careful alignment of the microscope, we performed a coma-free alignment using the Leginon software (Glaeser et al., 2011) and we were able to observe Thon rings up to 4 Å resolution using a gold grating replicate grid. Data collection was fully automated using Leginon (Suloway et al., 2005) which had been adapted to handle movies and control the Gatan K2 summit camera. Movies were recorded in “super resolution mode” with an exposure time of 4 sec and contained 16 frames of 0.25 s each (termed 0-15 throughout the manuscript). The dose rate was ~10 electrons/pixel/s and the total exposure per movie was 22 electrons/Å2 (1.38 electrons/Å2/frame). Micrograph defoci varied between −0.45 and −3.7 μm.
2.2 Data processing
We collected 754 movies of frozen-hydrated STIV at a super-resolution pixel size of 0.605 Å (corresponding to a magnification of 41,322x). The 7424×7680 pixels2 frames were binned by a factor of 2 by real-space averaging of neighboring pixels and cropped to be squared (3712×3712 pixels2) before carrying out whole frame alignment using the algorithm published by Li et al (Li et al., 2013) which we have integrated into the Appion pipeline (Lander et al., 2009). Alternatively, the super-resolution frames were used to track single particle motions using an algorithm we developed (based on a previously reported method (Shigematsu and Sigworth, 2013)) before binning by a factor of 2 by real-space averaging of neighboring pixels or Fourier space averaging. Particles were automatically picked using FindEM (Roseman, 2004) integrated into the Appion pipeline before visual inspection to remove junk picks, overlapping particles, or particles on the carbon between holes. Capsids were then extracted using a box size of 1024×1024 or 1200×1200 pixels2 yielding stacks of 4,490 or 3,996 particle images, respectively. The parameters of the microscope contrast transfer function were estimated for each micrograph using ctffind3 (Mindell and Grigorieff, 2003). A systematic search of particle image orientation was performed with Frealign (Grigorieff, 2007) using a previously reported STIV reconstruction (Khayat et al., 2010) low-pass filtered at 50 Å resolution. We then carried out a local angular and positional refinement in Frealign while always limiting the data included to 10 Å resolution to avoid bias in the Fourier shell correlation (FSC) at higher resolution (Grigorieff, 2007; Grigorieff and Harrison, 2011; Scheres and S. Chen, 2012; Stewart and Grigorieff, 2004). The resolutions of the obtained maps were determined by using the FSC, calculated between two reconstructions each containing half of the data, at a cutoff of 0.143 (Rosenthal and Henderson, 2003). A negative temperature factor of 650 Å2 was applied to the final reconstructions with the software Bfactor (http://emlab.rose2.brandeis.edu/bfactor). For comparisons, maps were scaled to match the rotationally averaged amplitude spectrum of the Titan Krios reconstruction after adjusting its pixel size to 1.21 Å to match the pixel size of the reconstructions obtained from the TF20 data set.
3. Results
3.1. Accounting for stage drift and beam-induced motion using movie frame alignment
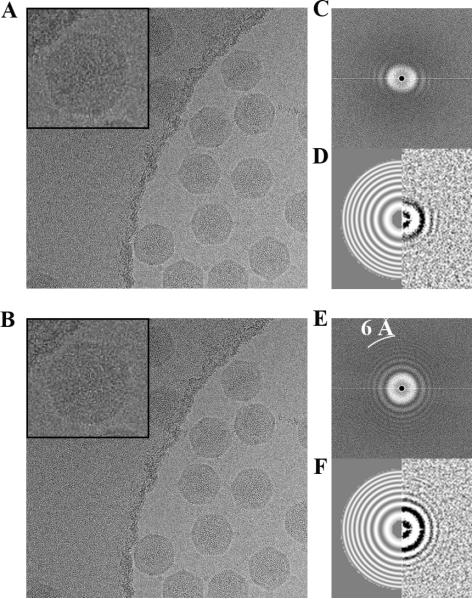
Fully automated data collection was carried out using Leginon (Suloway et al., 2005) to control both the TF20 Twin microscope and the Gatan K2 Summit camera operated in “super-resolution” mode at a dose rate of ~10 electrons/pixels/s. Such low beam intensity is required to detect individual electron landing events on the detector (electron counting (Li et al., 2013)) and therefore necessitates a prolonged acquisition time (4 s per image in our case) to achieve a total targeted exposure of 22 electrons/Å2. As a result, image blurring inevitably corrupts the micrographs due to beam-induced sample motion and stage drift (Fig 1 A).
Figure 1.
Motion correction using movie frame alignment. A micrograph of ice-embedded STIV virions is shown before (A) and after (B) movie frame alignment with a zoomed-in view of a single particle on the top left of each panel. (C) The power spectrum computed from the micrograph in (A) shows anisotropic Thon rings extending to ~16 Å. (D) Estimation of defocus parameters of the micrograph in (A) with ctffind3: Thon ring pattern (right) and fitted pattern to 6 Å resolution (left). (E) The power spectrum computed from the micrograph in (B) shows isotropic Thon rings extending up to 6 Å. (F) Estimation of defocus parameters of the micrograph in (B) with ctffind3: Thon ring pattern (right) and fitted pattern to 6 Å resolution (left).
To address this issue, we acquired the data as movies composed of 16 frames of 0.25 s each and subsequently aligned these frames to each other using a recently described cross-correlation based method (Li et al., 2013). The quality of all micrographs was significantly improved upon alignment, as attested by the restoration of sharp (previously unobservable) details in the images (Fig 1 B). However, comparison of the power spectra corresponding to the 16-frame averages computed before and after frame alignment is required to fully appreciate the extent of image blurring taking place during data collection and the importance of accounting for it at the processing stage. Unaligned micrograph averages exhibited anisotropic power spectra with mostly unidirectional resolution cutoff extending to approximately 16 Å resolution (Fig 1 C & D). However, motion correction yielded very symmetrical power spectra for all micrographs, characterized by the presence of visible Thon rings extending up to 6 Å resolution and improved accuracy in the estimated defocus parameters (Fig 1 E and F).
The observed trajectory of motion was complex and frequently varied throughout acquisition of a given movie as well as among different movies. Some movies were characterized by a roughly linear translational trajectory with an approximately constant rate (Fig 2 A) whereas others exhibited a more intricate trajectory with sudden change of direction from one frame to the next (Fig 2 B). We monitored drift rates every time we moved to a different part of the grid (translations larger than ~10 μm) using Leginon (Suloway et al., 2005) to ensure that stage drift was kept at a minimum before movie acquisition. The average drift rate recorded for the entire data set after these mechanical stage movements was on average 3 Å/s with a standard deviation of 1.4 Å/s. We also computed the average drift rate per frame among all the movies composing the data set to extrapolate a general trend for the extent of sample motion occurring during acquisition (Fig 2 C). As the average drift measured by aligning movie frames was substantially larger than the average drift occurring upon translation of the grid at all time points, it seems reasonable to propose that beam-induced movement played a significant role in the total averaged drift observed during our experiments.
Figure 2.
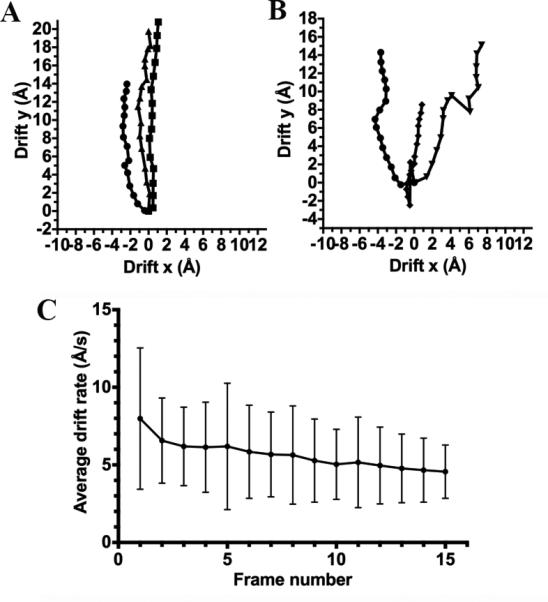
Translational shifts observed during data acquisition. (A) Plot of the relative positional shifts determined by alignment of movie frames for three different images featuring an approximately linear trajectory of motion. (B) Plot of the relative positional shifts determined by alignment of movie frames for three different images featuring a more complex trajectory of motion. (C) Average speed of motion measured over the entire data set for each of the 16 frames composing the movies. Error bars indicate the standard deviations of each average.
3.2. Near-atomic resolution reconstruction of STIV
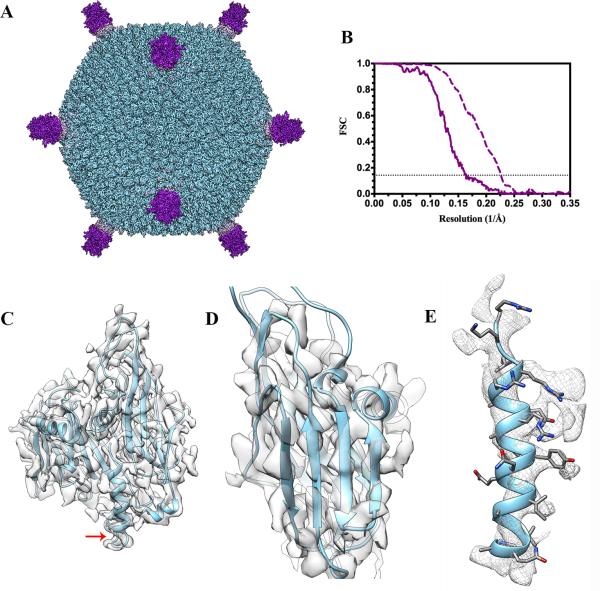
We computed an icosahedrally-averaged 3D reconstruction of the mature STIV virion using 4,446 particle images (out of 4,490 available) extracted from the 16-frame averages obtained using the motion correction procedure described above (Fig. 3 A). We used a frequency-limited refinement procedure (Grigorieff, 2007; Grigorieff and Harrison, 2011; Scheres and S. Chen, 2012; Stewart and Grigorieff, 2004) consisting of using only data up to 10 Å resolution during determination of particle image orientations and positions to avoid bias in the Fourier Shell correlation (FSC) at higher resolution. The resolution of the entire virus reconstruction is 6.1 Å as indicated by the FSC at a cutoff of 0.143 (Rosenthal and Henderson, 2003) (Fig. 3 B). STIV has a total radius of 960 Å, comprising a 730 Å wide proteinaceous icosahedral capsid decorated with turrets at each 5-fold vertex and enclosing a lipid membrane surrounding the dsDNA genome. As a result of the complexity of this macromolecular assembly, different regions exhibit different degrees of ordering, with the capsid shell being the best defined (Veesler et al., 2013). We estimated the resolution in the coat subunit region to be 4.4 Å according to the FSC at a cutoff of 0.143 and the observed features in the map that exhibits clearly defined α-helices and partially resolved β-strands along with density corresponding to some amino-acid side chains (Fig. 3 C-E).
Figure 3.
Near-atomic resolution reconstruction of the mature STIV virion using a FEI TF20 Twin electron microscope and a Gatan K2 Summit direct detector. (A) The overall virus reconstruction is displayed with the different protein components individually colored (coat subunit/B345, light blue; penton base/ A223, light pink; turret protein/C381, purple). (B) The Fourier shell correlation curves point to resolutions of 6.1 Å and 4.4 Å for the whole reconstruction (solid line) and the coat subunit region only (dashed line), respectively. The horizontal dotted line indicates the FSC=0.143 criterion. (C) Fit of the coat subunit (B345) crystal structure into the corresponding cryoEM density. The crystal structure stops at residue 324 (indicated by a red arrow) whereas the cryoEM density is continuous until the C-terminal residue and folds as an α-helix. (D) Zoom-in view on a coat subunit N-terminal jelly-roll highlighting the fact that individual β-strands are partially resolved in the density. (E) The coat subunit C-terminal α-helix (residues 325–345) is depicted to show that some side chains are visible in the reconstruction.
We investigated the influence of the number of particle images on the resolution of the reconstruction, as well as the potential of improving the resolution by including more data. Reconstructions were computed including varying proportions of particle images based on the phase residual cutoff implemented in Frealign (Grigorieff, 2007). This corresponds to the agreement between a particle image and the corresponding projection from the model and is expressed as the amplitude-weighted phase residual between the Fourier transform of the CTF-corrected image and the Fourier transform of the calculated model projection (Rosenthal and Henderson, 2003). While the resolution of the whole reconstruction and of the coat subunit region improved by increasing the number of particle images contributing to the map, this trend became increasingly subtle above 3,500 particles (Fig 4A). Based on these results, we expect that only modest improvements could be achieved in terms of resolution by collecting more data although a few tenths of an Angstrom in the ~4 Å resolution range is a significant enhancement of map interpretability. One can argue that the selection scheme we have applied to select particle images could be considered as somewhat biased beyond the simple expectation that we retained the best correlating particles. For this specific dataset, the particles with the highest phase residuals were the ones extracted from micrographs acquired with the lowest amount of defocus and vice-versa (Fig 4B). Hence, it appears that the reconstructions we have computed with an increasing number of particle images are also characterized by an increasing number of close-to-focus particles. These particles may present the advantage of an enhanced high-resolution signal but at the price of an attenuation of the low-resolution contrast (useful for determining alignment and shift parameters) (van Heel et al., 2000).
Figure 4.
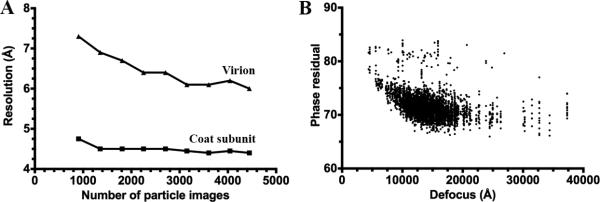
(A) Plot of the resolution of the reconstruction as a function of the number of particle images contributing to it. (B) Plot of the phase residual values output by Frealign for each particle image as a function of the estimated defocus for the micrograph from which it originates.
3.3. Characterization of the effect of dose-fractionation on the reconstruction
The use of direct detectors to collect data as multi-frame-containing movies enables selecting the number of frames contributing to the refinement and the reconstruction steps of a projection matching protocol. Hence, the effective dose can be accurately tuned to fulfill the different requirements of these two steps: enhancing the low-resolution contrast using higher dose during refinement to obtain good alignment parameters; and preserving the high-resolution signal of the particle images by using a low-dose during reconstruction. As the high-resolution signal fades more rapidly with dose than the low-resolution signal (Smith et al., 2010), applying a dose-dependent frame filtering to amplify both low and high-resolution contrasts can easily accommodate these conflicting requirements (Bai et al., 2013; Campbell et al., 2012; Li et al., 2013).
We carried out several reconstructions using various subsets of frames corresponding to exposures ranging from ~20 electrons/Å2 to ~5 electrons/Å2 using the alignment parameters determined with the stack of particle images containing the 16 aligned frames (22 electrons/Å2). The estimated resolutions for these different reconstructions, both for the whole map and the coat subunit region only, are reported in Table 1. We observed very little effect on the resolution upon removal of the first and/or the last few frames or due to variation of the total exposure used (Fig 5A). Virtually all the reconstructions obtained have a resolution of ~6.0 Å for the entire virion and ~4.4 Å for the coat subunits. The only noticeable deviation detected corresponds to the reconstruction performed with a total dose of 5.5 e/Å2, which has a resolution of 6.5 and 4.5 Å for the equivalent regions. This latter case probably represents a lower dose boundary where the resolution starts dropping due to the lower signal-to-noise ratio of the particle images. The outcome of this dose-fractionation study is in contrast with what was reported by Li et al (Li et al., 2013) where the first two and the last ten frames had a negative impact on their proteasome reconstruction. The absence of an effect on the reconstruction due to removal of the first frame is probably related to the fact that the average drift rate occurring during the recording of early frames throughout the entire data set was nearly half the rate in our experiments compared to the reported study (Li et al., 2013) (Fig 2 C). Obtaining virtually identical reconstructions by removing the last 6 frames (Table 1) was more surprising. Indeed, one would have expected a more pronounced effect resulting from the accumulation of noise at high-resolution toward the end of each exposure due to fading of the signal (Smith et al., 2010). We suggest that although the resolution of the reconstruction in the coat subunit shell is high for electron microscopy standards (~4.4 Å), it is not high enough to significantly suffer from noise accumulation in this region of reciprocal space at the exposure used for these experiments. This hypothesis allows our results to be reconciled with the above-mentioned ones where the authors described a severe degradation of signal at high-spatial frequency in the last ten frames of each exposure but at a significantly higher resolution of 3.3 Å (Li et al., 2013).
Table 1.
Resolution estimations for the reconstructions performed with stack of particle images containing various movie frames. The values reported correspond to the criterion FSC=0.143 both for the entire virion and for the coat subunit region only.
| Frames 0-15 22 e/Å2 | Frames 0-12 17.9 e/Å2 | Frames 0-9 13.75 e/Å2 | Frames 0-7 11 e/Å2 | Frames 0-5 8.25 e/Å2 | Frames 0-3 5.5 e/Å2 | Frames 1-15 20.6 e/Å2 | Frames 1-13 17.9 e/Å2 | Frames 1-12 16.5 e/Å2 | |
|---|---|---|---|---|---|---|---|---|---|
| Whole map | 6.1 | 6.1 | 6.0 | 6.0 | 6.2 | 6.4 | 6.2 | 6.1 | 6.0 |
| Coat subunit | 4.4 | 4.35 | 4.35 | 4.35 | 4.4 | 4.5 | 4.4 | 4.35 | 4.35 |
Figure 5.
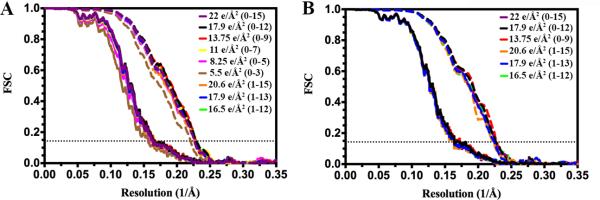
Characterization of the influence of different dose-fractionation schemes on the resolution of the reconstruction. (A) Fourier shell correlations for reconstructions carried out using various subsets of frames corresponding to exposures ranging from 20.6 electrons/Å2 to 5.5 electrons/Å2 and using the alignment parameters determined with the stack of particle images containing the 16 aligned frames (22 electrons/Å2). (B) Fourier shell correlations for full refinements and reconstructions performed using stacks of particles images composed of various subsets of frames. In the two panels, Fourier shell correlations are shown for the whole reconstruction (solid line) and the coat subunit region only (dashed line). Each color corresponds to a different stack of particle images including the movie frames annotated between parentheses. The horizontal dotted line indicates the FSC=0.143 criterion.
As an alternative strategy, we also performed full refinements and reconstructions using stacks of particle images composed of various subsets of frames to assess the ability of determining accurate alignment parameters as a function of the exposure used. Similarly to the observations made above, there was very little effect of the exposures tested or of the removal of the first or last few frames on the resolution of the reconstructions (Fig 5B and Table 2). The best results were achieved when using particle images originating from the aligned averages of the first 10 movie frames with resolutions of 5.8 Å and 4.35 Å for the whole reconstruction and the coat subunit region, respectively. Our ability to efficiently determine alignment parameters using an exposure less than 14 e/Å2 is most likely due to the large size of STIV virions (~75MDa), which strongly scatter incoming electrons. The narrow range of estimated resolutions for the reconstructions resulting from these two different dose-fractionation strategies correlates well with the features observed in the corresponding electron potential maps that are all of similar quality. As a control experiment, we also performed several cycles of refinements and reconstructions using a larger box size (1200×1200 pixels2) and ruled out that this could be a limiting factor in our experiments (Fig. S1 and Table S1). These results can be used as a framework to select an appropriate data collection strategy in order to maximize the potential of producing a high-resolution map and minimize the acquisition time when dealing with samples of similar size (Table 1 and 2).
Table 2.
Resolution estimations for the full refinements and reconstructions performed with stack of particle images containing various movie frames. The values reported correspond to the criterion FSC=0.143 both for the entire virion and for the coat subunit region only.
| Frames 0-15 22 e/Å2 | Frames 0-12 17.9 e/Å2 | Frames 0-9 13.75 e/Å2 | Frames 1-15 20.6 e/Å2 | Frames 1-13 17.9 e/Å2 | Frames 1-12 16.5 e/Å2 | |
|---|---|---|---|---|---|---|
| Whole map | 6.1 | 5.8 | 5.8 | 6.1 | 6.1 | 6.1 |
| Coat subunit | 4.4 | 4.4 | 4.35 | 4.45 | 4.4 | 4.4 |
3.4. Accounting for stage drift and beam-induced motion by following movement of individual particles
Several studies have demonstrated that frozen-hydrated particles can undergo independent motions from each others when irradiated by the electron beam of the microscope(Bai et al., 2013; Brilot et al., 2012; Campbell et al., 2012; Glaeser and Hall, 2011; Li et al., 2013). In these cases, beam-induced motion correction has been implemented either by tracking the trajectory of individual particles during exposure (when their sizes were large enough to allow it (Bai et al., 2013; Brilot et al., 2012; Campbell et al., 2012)) or by following the motions of group of particles belonging to a region of a micrograph (for smaller-sized particles (Li et al., 2013)). We developed a cross-correlation based algorithm that allows analysis of the motion trajectory of individual particles and correction for each by aligning movie frames collected using direct detectors. When applied to our STIV data set, this alignment algorithm demonstrated that the particles belonging to a given micrograph exhibited virtually identical trajectories, both in terms of direction and magnitude, and this trend was conserved throughout the entire data set (Fig. 6 A). Indeed, 88% of the particle images exhibited a residual independent shift that was inferior or equal to 1.5 Å. We ran a projection-matching refinement using the same protocol as the one described above and the stack of particle images corresponding to the 16-frame averages aligned on the basis of single-particle motions. As expected, the estimated resolution for the resulting reconstruction is identical to the one of the reconstruction obtained using the whole frame alignment procedure (Fig. 6 B and Table 3). These results indicate that particles were not moving independently from each other in the conditions of our experiments.
Figure 6.
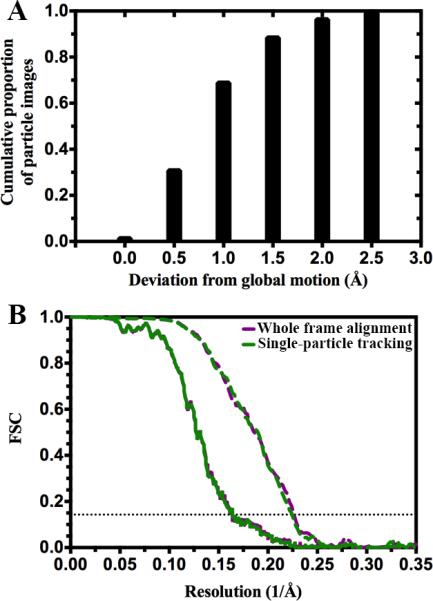
Correcting for beam-induced motion at the level of individual particles. (A) Residual independent particle motion after global (whole frame) alignment. The global trajectory for each micrograph is subtracted from the trajectories of the particles in that micrograph, and then the maximum remaining displacement for each particle is reported. We see that ~97% of particles drift less than 2 Å away from the global drift. (B) Fourier shell correlations for refinements performed using stacks of particle images corresponding to the 16-frame averages aligned by following the trajectory of motion for the whole frames (purple) or individual particles (dark green). In the two panels, Fourier shell correlations are shown for the whole reconstruction (solid line) and the coat subunit region only (dashed line). The horizontal dotted line indicates the FSC=0.143 criterion.
Table 3.
Resolution estimations for the full refinements and reconstructions performed using the stack of particle images corresponding to the 16-frame averages aligned by following the trajectory of motion for individual particles. The values reported correspond to the criterion FSC=0.143 both for the entire virion and for the coat subunit region only.
| Frames 0-15 22 e/Å2 | |
|---|---|
| Whole map | 6.1 |
| Coat subunit | 4.4 |
3.5. Comparison with a dataset collected using a FEI Titan Krios microscope
We recently reported the electron cryomicroscopy structure of the mature STIV virion at 3.9 Å resolution using data collected on a FEI Titan Krios microscope equipped with a FEI Falcon I direct detector (Veesler et al., 2013). We therefore set out to compare this data to the one described above so as to benchmark the potential of the two instrumentational setups to yield high-resolution reconstructions. A representative micrograph, its corresponding power spectrum (showing Thon rings up to 8 Å resolution) and the estimation of defocus parameters for this micrograph are shown in Figure 7 A, B and C for the Titan Krios data set.
Figure 7.
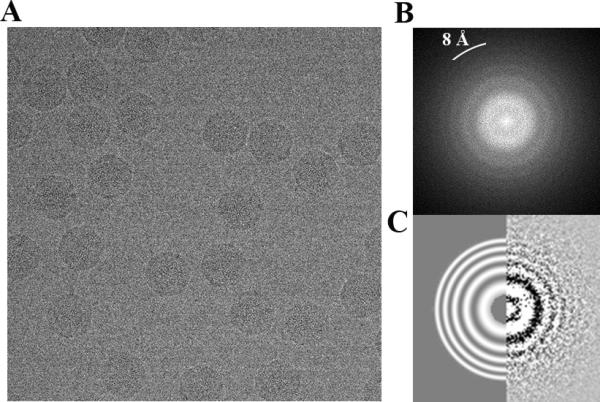
A micrograph of ice-embedded STIV virions collected with a FEI Titan Krios microscope equipped with a FEI Falcon direct detector is shown in (A) with the corresponding power spectrum (B) and defocus estimation using ctffind3: Thon ring pattern (right) and fitted pattern to 8 Å resolution (left). (C). Thon rings are visible up to 8 Å resolution.
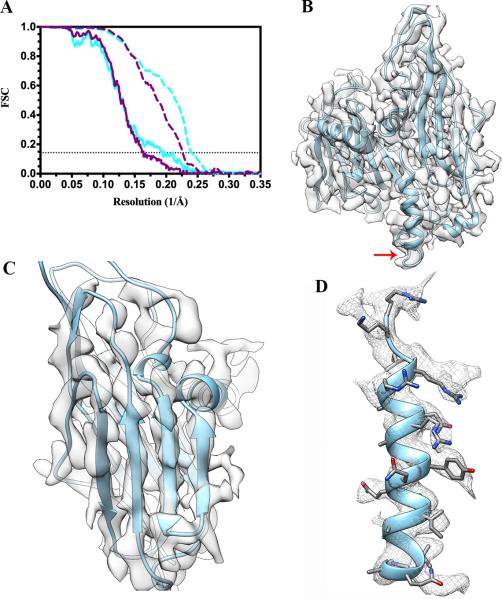
A random selection of 4,490 particle images (out of the 9,371 available) was performed to match the size of the data set acquired with the FEI TF20. We computed a 3D reconstruction of STIV following the same refinement protocol as we used for the TF20 data set and estimated the resolution in an identical way to make the results as comparable as possible. The resolution estimated for the whole reconstruction and for the coat subunit region is higher in the case of the Titan Krios data (5.1 Å/4.1 Å) as compared to the TF20 data (6.1 Å/4.4 Å) (Fig 8 A and Table 4). Careful examination of the reconstructions showed that they both exhibit well-resolved α-helices, distinguishable β-strands and densities for several side-chains throughout the coat subunit structure (Fig 8 B-D). Although the two maps are of excellent quality, the Titan Krios reconstruction appears to be overall better defined, as illustrated by the improved separation of individual β-strands as well as the larger number of side chains being resolved. These differences are in agreement with the estimated nominal resolutions and can be attributed to several factors such as the difference in accelerating voltage used and microscope optical performances (cf. Discussion).
Figure 8.
Comparison with a STIV reconstruction obtained with a FEI Titan Krios microscope equipped with a FEI Falcon direct detector. (A) Fourier shell correlations for the whole reconstruction (solid line) and the coat subunit region only (dashed line) are depicted in purple for the TF20 data set (stack of particle images comprising frames 0 to 15) and in cyan for the Titan Krios data set. The horizontal dotted line indicates the FSC=0.143 criterion. (B) Fit of the coat subunit (B345) crystal structure into the corresponding cryoEM density extracted from the Titan Krios reconstruction. The crystal structure stops at residue 324 (indicated by a red arrow) whereas the cryoEM density is continuous until the C-terminal residue and folds as an α-helix. (C) Zoom-in view on a coat subunit N-terminal jelly-roll highlighting the fact that individual β-strands are well resolved in the density. (D) The coat subunit C-terminal α-helix (residues 325–345) is depicted to show that many side chains are visible in the reconstruction. In panels B, C and D, the maps are on the same scale and contoured at the same level than the corresponding maps in Figure 3 C,D and E, respectively.
Table 4.
Comparison of the resolutions estimated for the reconstructions obtained using the FEI TF20 Twin/Gatan K2 Summit or FEI Titan Krios/FEI Falcon setups. The values reported correspond to the criterion FSC=0.143 both for the entire virion and for the coat subunit region only.
| TF20/K2 | Krios/Falcon | |
|---|---|---|
| Whole map | 6.1 | 5.1 |
| Coat subunit | 4.4 | 4.1 |
4. Discussion
In the present study, we described the strategy employed to produce a ~4.4 Å resolution reconstruction of the mature STIV virion using a FEI TF20 microscope and a Gatan K2 Summit direct detector. Beyond emphasizing that it is possible to routinely collect high-resolution data in an automated way and in a single session, our results also demonstrate that near atomic resolution reconstructions can reproducibly be achieved with microscopes operated at 200kV when accounting for beam-induced motion and stage drift (Campbell et al., 2012). The availability of these new direct detectors greatly enhance the capability of mid-range electron microscopes and will probably result in a larger number of high-resolution maps deposited in the future.
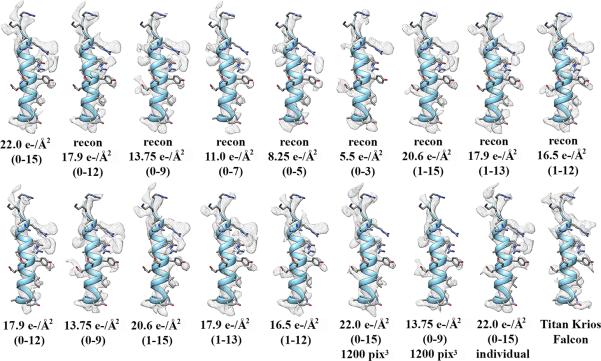
We investigated the potential of different dose-fractionation strategies to improve the quality of the final reconstruction and detected only minor influence of the various frame combinations tested (Fig. 9). The discrepancy between these results and those reported by Li et al (Li et al., 2013) for their 3.3 Å proteasome structure could arise from a combination of different data collection strategies and high-resolution limits. We collected our data in a fully automated way using Leginon (Suloway et al., 2005) that allows careful monitoring of sample drift after moving the stage to a different area of the grid and implements a waiting period until the drift is under an acceptable value before acquiring images. This data collection scheme might be a reason (along with other non identified factors) as to why the average drift rate we measured over the entire data set during acquisition of the first frame was less than 8 Å/s compared to ~18 Å/s in the study of Li et al (Li et al., 2013). The marginal improvement observed upon discarding the last few frames of each movie suggests that fading of the high-resolution signal in the conditions of our experiments was insufficient to significantly affect the quality of the reconstructed map but might become an issue at higher spatial frequency due to more severe noise accumulation (Smith et al., 2010). The translational motions we measured during the time course of movie acquisition are likely resulting from a combination of beam-induced sample movement and stage drift. Alignment of movie frames yielded average drift values comprised between 8 Å/s (frame 0 → frame1) and 4.6 Å/s (frame 14 → frame 15) for the entire data set and featuring a progressive fall-off likely caused by settling of the sample in the electron beam. The average drift rate due to stage instability after translation of the grid by 10 μm or more was of ~3 Å/s throughout the entire session, as recorded by Leginon. It is reasonable to assume that this drift rate was not significantly different after small translations of the grid (~2 μm), required to move to areas where movies were recorded, following the 5 s delay we used before each exposure. The observation that the sample was drifting at a rate that was on average 65-200% higher than the drift resulting only from stage instability strongly suggests that the total observed shifts can be in part attributed to beam-induced motion.
Figure 9.
Comparison of the cryoEM density corresponding to the coat subunit C-terminal α-helix (residues 325–345) for the various reconstructions carried out in this study. The total exposure and the corresponding movie frames from which each stack of particle images have been generated is shown below each map. The densities labeled “recon” are the reconstructions carried out using the alignment parameters determined with the stack of particle images containing the 16 aligned frames (22 electrons/Å2). All the other reconstructions have been obtained by running successive cycles of refinement and reconstruction using the indicated stack of particle images. The reconstructions annotated “1200 pix3” and “individual” have been performed using a box size of 1200 pixels3 and by correcting motion for individual particles, respectively. All the maps are on the same scale and contoured at the same level.
We had here a unique opportunity to compare data collected on the same sample with different microscopes (FEI Titan Krios and FEI TF20) and different direct detection devices (FEI Falcon I and Gatan K2 Summit) to benchmark the potential of these two setups to yield high-resolution reconstructions. One important difference between the way the two microscopes were operated is the fact that the Titan Krios data set was collected at 300kV whereas the TF20 data set was acquired at 200 kV. A higher accelerating voltage presents several advantages that could have additively contributed to yield a better reconstruction for the Titan Krios data: (i) a lower electron scattering cross-section (effectively reducing multiple scattering events), (ii) less severe beam-tilt (Glaeser et al., 2011; Xing Zhang and Zhou, 2011), (iii) a reduced curvature of the Ewald sphere (Xing Zhang and Zhou, 2011), (iv) slower oscillations of the contrast transfer function at high-resolution (making correction more robust) and (iv) a higher DQE of direct detectors. The Titan Krios microscope also benefits from the presence of a third continuously adjustable condenser lens, guarantying a parallel illumination and effectively minimizing off-axis coma, as well as of the constant powering of the lenses that reduces thermal drift due to hysteresis. As a result, the Titan Krios data set has been collected in nanoprobe mode while we used the microprobe mode to collect the TF20 data set. These different factors might also have participated in improving the quality of the reconstruction produced from the data collected with the Titan Krios microscope (Fig. 9).
Finally, we would like to emphasize that we have been able to reconstruct the 3D structure of an icosahedral virus at ~4.4 Å resolution using micrographs displaying visible Thon rings in their power spectra up to 6 Å resolution. This outcome is in contrast with earlier suggestions (Huang et al., 2003) but has already been reported by Grigorieff and colleagues in several instances (Grigorieff and Harrison, 2011). The availability of data sets collected on the same sample, but with different microscopes and cameras, allows us to stress the validity of these results. Comparison of the power spectra of micrographs belonging to the Titan Krios and the TF20 data sets shows Thon rings extending up to 8 Å and 6 Å resolution, respectively. The fact that both data sets yielded near-atomic resolution reconstructions clearly demonstrates that useful signal was present in each image beyond detectable Thon rings and was recovered by averaging a large number of particle images. A commonly implemented strategy based on the strict selection of micrographs whose power spectra show visible Thon rings up to 4 Å resolution or better, is thus probably leading to a waste of “good data” with the potential to contribute to obtaining high-resolution reconstructions.
Supplementary Material
Acknowledgements
This work was supported by a FP7 Marie Curie IOF fellowship (273427) to D.V. Part of this research was conducted at the National Resource for Automated Molecular Microscopy which is supported by the National Institutes of Health and the National Institute of General Medical Sciences (GM103310). We are grateful for computing resources and the assistance provided by the head of the high-performance computing facility (Dr. Jean-Christophe Ducom) at the Scripps Research Institute.
Footnotes
Publisher's Disclaimer: This is a PDF file of an unedited manuscript that has been accepted for publication. As a service to our customers we are providing this early version of the manuscript. The manuscript will undergo copyediting, typesetting, and review of the resulting proof before it is published in its final citable form. Please note that during the production process errors may be discovered which could affect the content, and all legal disclaimers that apply to the journal pertain.
Data deposition
The Sulfolobus turreted icosahedral virus cryoEM reconstruction obtained using the particle images extracted from the 16 aligned and averaged movie frames has been deposited to the EMDataBank with accession no. EMD-XXX. We are also making the data set collected on the FEI TF20 Twin electron microscope publicly available upon request due to the large size of the data set.
References
- Bai X-C, Fernandez IS, McMullan G, Scheres SH, Kühlbrandt W. Ribosome structures to near-atomic resolution from thirty thousand cryo-EM particles. 2013 doi: 10.7554/eLife.00461. eLife 2. [DOI] [PMC free article] [PubMed] [Google Scholar]
- Bi G, Zhang Q, Schein S, Zhou ZH. Cryo-EM structure of the mature dengue virus at 3.5-Å resolution. Nature structural &. 2012 doi: 10.1038/nsmb.2463. [DOI] [PMC free article] [PubMed] [Google Scholar]
- Campbell MG, Cheng A, Brilot AF, Moeller A, Lyumkis D, Veesler D, Pan J, Harrison SC, Potter CS, Carragher B, Grigorieff N. Movies of Ice-Embedded Particles Enhance Resolution in Electron Cryo-Microscopy. Structure (London, England. 2012:1993. doi: 10.1016/j.str.2012.08.026. [DOI] [PMC free article] [PubMed] [Google Scholar]
- Chen D-H, Baker ML, Hryc CF, DiMaio F, Jakana J, Wu W, Dougherty M, Haase-Pettingell C, Schmid MF, Jiang W, Baker D, King JA, Chiu W. Structural basis for scaffolding-mediated assembly and maturation of a dsDNA virus. Proc. Natl. Acad. Sci. U.S.A. 2011;108:1355–1360. doi: 10.1073/pnas.1015739108. [DOI] [PMC free article] [PubMed] [Google Scholar]
- Chen JZ, Settembre EC, Aoki ST, Zhang X, Bellamy AR, Dormitzer PR, Harrison SC, Grigorieff N. Molecular interactions in rotavirus assembly and uncoating seen by high-resolution cryo-EM. Proc. Natl. Acad. Sci. U.S.A. 2009;106:10644–10648. doi: 10.1073/pnas.0904024106. [DOI] [PMC free article] [PubMed] [Google Scholar]
- Glaeser RM, Hall RJ. Reaching the information limit in cryo-EM of biological macromolecules: experimental aspects. Biophys. J. 2011;100:2331–2337. doi: 10.1016/j.bpj.2011.04.018. [DOI] [PMC free article] [PubMed] [Google Scholar]
- Glaeser RM, Typke D, Tiemeijer PC, Pulokas J. Precise beam-tilt alignment and collimation are required to minimize the phase error associated with coma in high-resolution cryo-EM. Journal of structural. 2011 doi: 10.1016/j.jsb.2010.12.005. [DOI] [PMC free article] [PubMed] [Google Scholar]
- Grigorieff N. FREALIGN: high-resolution refinement of single particle structures. J. Struct. Biol. 2007;157:117–125. doi: 10.1016/j.jsb.2006.05.004. [DOI] [PubMed] [Google Scholar]
- Grigorieff N, Harrison SC. Near-atomic resolution reconstructions of icosahedral viruses from electron cryo-microscopy. Curr. Opin. Struct. Biol. 2011;21:265–273. doi: 10.1016/j.sbi.2011.01.008. [DOI] [PMC free article] [PubMed] [Google Scholar]
- Henderson R. Image contrast in high-resolution electron microscopy of biological macromolecules: TMV in ice. Ultramicroscopy. 1992;46:1–18. doi: 10.1016/0304-3991(92)90003-3. [DOI] [PubMed] [Google Scholar]
- Henderson R. The potential and limitations of neutrons, electrons and X-rays for atomic resolution microscopy of unstained biological molecules. Quarterly reviews of biophysics. 1995 doi: 10.1017/s003358350000305x. [DOI] [PubMed] [Google Scholar]
- Henderson R, McMullan G. Problems in obtaining perfect images by single-particle electron cryomicroscopy of biological structures in amorphous ice. J Electron Microsc (Tokyo) 2013;62:43–50. doi: 10.1093/jmicro/dfs094. [DOI] [PMC free article] [PubMed] [Google Scholar]
- Huang Z, Baldwin PR, Mullapudi S. Automated determination of parameters describing power spectra of micrograph images in electron microscopy. Journal of structural. 2003 doi: 10.1016/j.jsb.2003.10.011. [DOI] [PubMed] [Google Scholar]
- Jiang W, Baker ML, Jakana J, Weigele PR, King J, Chiu W. Backbone structure of the infectious epsilon15 virus capsid revealed by electron cryomicroscopy. Nature. 2008;451:1130–1134. doi: 10.1038/nature06665. [DOI] [PubMed] [Google Scholar]
- Khayat R, Fu C-Y, Ortmann AC, Young MJ, Johnson JE. The architecture and chemical stability of the archaeal Sulfolobus turreted icosahedral virus. J. Virol. 2010;84:9575–9583. doi: 10.1128/JVI.00708-10. [DOI] [PMC free article] [PubMed] [Google Scholar]
- Lander GC, Stagg SM, Voss NR, Cheng A, Fellmann D, Pulokas J, Yoshioka C, Irving C, Mulder A, Lau P-W, Lyumkis D, Potter CS, Carragher B. Appion: an integrated, database-driven pipeline to facilitate EM image processing. J. Struct. Biol. 2009;166:95–102. doi: 10.1016/j.jsb.2009.01.002. [DOI] [PMC free article] [PubMed] [Google Scholar]
- Lerch TF, O'Donnell JK, Meyer NL, Xie Q, Taylor KA, Stagg SM, Chapman MS. Structure of AAV-DJ, a retargeted gene therapy vector: cryo-electron microscopy at 4.5 Å resolution. Structure (London, England : 1993) 2012;20:1310–1320. doi: 10.1016/j.str.2012.05.004. [DOI] [PMC free article] [PubMed] [Google Scholar]
- Li X, Mooney P, Zheng S, Booth CR, Braunfeld MB, Gubbens S, Agard DA, Cheng Y. Electron counting and beam-induced motion correction enable near-atomic-resolution single-particle cryo-EM. Nat Meth. 2013 doi: 10.1038/nmeth.2472. [DOI] [PMC free article] [PubMed] [Google Scholar]
- Liu H, Jin L, Koh SBS, Atanasov I, Schein S, Wu L, Zhou ZH. Atomic structure of human adenovirus by cryo-EM reveals interactions among protein networks. Science. 2010;329:1038–1043. doi: 10.1126/science.1187433. [DOI] [PMC free article] [PubMed] [Google Scholar]
- Liu X, Zhang Q, Murata K, Baker ML, Sullivan MB, Fu C, Dougherty MT, Schmid MF, Osburne MS, Chisholm SW, Chiu W. Structural changes in a marine podovirus associated with release of its genome into Prochlorococcus. Nat. Struct. Mol. Biol. 2010;17:830–836. doi: 10.1038/nsmb.1823. [DOI] [PMC free article] [PubMed] [Google Scholar]
- Mindell JA, Grigorieff N. Accurate determination of local defocus and specimen tilt in electron microscopy. J. Struct. Biol. 2003;142:334–347. doi: 10.1016/s1047-8477(03)00069-8. [DOI] [PubMed] [Google Scholar]
- Roseman AM. FindEM--a fast, efficient program for automatic selection of particles from electron micrographs. J. Struct. Biol. 2004;145:91–99. doi: 10.1016/j.jsb.2003.11.007. [DOI] [PubMed] [Google Scholar]
- Rosenthal PB, Henderson R. Optimal determination of particle orientation, absolute hand, and contrast loss in single-particle electron cryomicroscopy. J. Mol. Biol. 2003;333:721–745. doi: 10.1016/j.jmb.2003.07.013. [DOI] [PubMed] [Google Scholar]
- Scheres SHW, Chen S. Prevention of overfitting in cryo-EM structure determination. Nat Meth. 2012;9:853–854. doi: 10.1038/nmeth.2115. [DOI] [PMC free article] [PubMed] [Google Scholar]
- Settembre EC, Chen JZ, Dormitzer PR, Grigorieff N, Harrison SC. Atomic model of an infectious rotavirus particle. EMBO J. 2011;30:408–416. doi: 10.1038/emboj.2010.322. [DOI] [PMC free article] [PubMed] [Google Scholar]
- Shigematsu H, Sigworth FJ. Noise models and cryo-EM drift correction with a direct-electron camera. Ultramicroscopy. 2013;131C:61–69. doi: 10.1016/j.ultramic.2013.04.001. [DOI] [PMC free article] [PubMed] [Google Scholar]
- Smith EA, Bueler SA, Rubinstein JL. The resolution dependence of optimal exposures in liquid nitrogen temperature electron cryomicroscopy of catalase crystals. Journal of structural. 2010 doi: 10.1016/j.jsb.2009.11.014. [DOI] [PubMed] [Google Scholar]
- Stewart A, Grigorieff N. Noise bias in the refinement of structures derived from single particles. Ultramicroscopy. 2004;102:67–84. doi: 10.1016/j.ultramic.2004.08.008. [DOI] [PubMed] [Google Scholar]
- Suloway C, Pulokas J, Fellmann D, Cheng A. Automated molecular microscopy: the new Leginon system. Journal of structural. 2005 doi: 10.1016/j.jsb.2005.03.010. [DOI] [PubMed] [Google Scholar]
- van Heel M, Gowen B, Matadeen R. Single-particle electron cryo-microscopy: towards atomic resolution. Quarterly reviews of. 2000 doi: 10.1017/s0033583500003644. [DOI] [PubMed] [Google Scholar]
- Veesler D, Ng TS, Sendamarai AK, Eilers BJ, Lawrence CM, Lok SM, Young MJ, Johnson JE, Fu CY. Atomic structure of the 75 MDa extremophile Sulfolobus turreted icosahedral virus determined by CryoEM and X-ray crystallography. Proc. Natl. Acad. Sci. U.S.A. 2013;110:5504–5509. doi: 10.1073/pnas.1300601110. [DOI] [PMC free article] [PubMed] [Google Scholar]
- Wolf M, Garcea RL, Grigorieff N, Harrison SC. Subunit interactions in bovine papillomavirus. Proc. Natl. Acad. Sci. U.S.A. 2010;107:6298–6303. doi: 10.1073/pnas.0914604107. [DOI] [PMC free article] [PubMed] [Google Scholar]
- Yang C, Ji G, Liu H, Zhang K, Liu G, Sun F, Zhu P, Cheng L. Cryo-EM structure of a transcribing cypovirus. Proc. Natl. Acad. Sci. U.S.A. 2012;109:6118–6123. doi: 10.1073/pnas.1200206109. [DOI] [PMC free article] [PubMed] [Google Scholar]
- Yu X, Jin L, Zhou ZH. 3.88 A structure of cytoplasmic polyhedrosis virus by cryo-electron microscopy. Nature. 2008;453:415–419. doi: 10.1038/nature06893. [DOI] [PMC free article] [PubMed] [Google Scholar]
- Zhang R, Hryc CF, Cong Y, Liu X, Jakana J. 4.4 Å cryo-EM structure of an enveloped alphavirus Venezuelan equine encephalitis virus. The EMBO. 2011 doi: 10.1038/emboj.2011.261. [DOI] [PMC free article] [PubMed] [Google Scholar]
- Zhang Xing, Jin L, Fang Q, Hui WH, Zhou ZH. 3.3 A cryo-EM structure of a nonenveloped virus reveals a priming mechanism for cell entry. Cell. 2010;141:472–482. doi: 10.1016/j.cell.2010.03.041. [DOI] [PMC free article] [PubMed] [Google Scholar]
- Zhang Xing, Settembre E, Xu C, Dormitzer PR, Bellamy R, Harrison SC, Grigorieff N. Near-atomic resolution using electron cryomicroscopy and single-particle reconstruction. Proc. Natl. Acad. Sci. U.S.A. 2008;105:1867–1872. doi: 10.1073/pnas.0711623105. [DOI] [PMC free article] [PubMed] [Google Scholar]
- Zhang Xing, Zhou ZH. Limiting factors in atomic resolution cryo electron microscopy: no simple tricks. J. Struct. Biol. 2011;175:253–263. doi: 10.1016/j.jsb.2011.05.004. [DOI] [PMC free article] [PubMed] [Google Scholar]
- Zhang Xinzheng, Sun S, Xiang Y, Wong J, Klose T, Raoult D, Rossmann MG. Structure of Sputnik, a virophage, at 3.5-A resolution. Proc. Natl. Acad. Sci. U.S.A. 2012;109:18431–18436. doi: 10.1073/pnas.1211702109. [DOI] [PMC free article] [PubMed] [Google Scholar]
Associated Data
This section collects any data citations, data availability statements, or supplementary materials included in this article.


