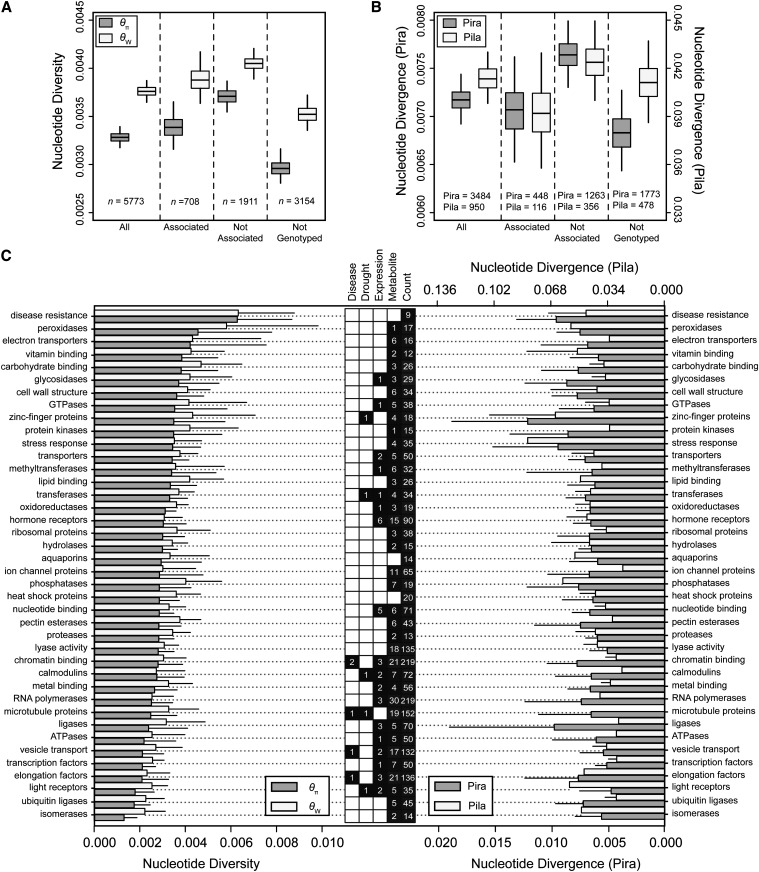
Figure 2.
Nucleotide diversity and divergence across categories of amplicons for loblolly pine. (A) Average levels of total nucleotide diversity by category of amplicons. Whiskers represent 95% confidence intervals generated via bootstrapping across amplicons. (B) Average levels of total nucleotide divergence by category of amplicons and outgroup (Pira, P. radiata; Pila, P. lambertiana). Whiskers represent 95% confidence intervals generated via bootstrapping across amplicons. (C) Average levels of total nucleotide diversity (left) and divergence (right) by functional categories in relation to categories of phenotypic associations (center). Numbers in the center box represent numbers of amplicons for each functional category (Count) and the number of phenotypic associations (solid, associated; open, no association). Error bars represent 95% confidence intervals generated via bootstrapping across amplicons.

