

Abstract
Public repositories for proteomics data have accelerated proteomics research by enabling more efficient cross-analyses of datasets, supporting the creation of protein and peptide compendia of experimental results, supporting the development and testing of new software tools, and facilitating the manuscript review process. The repositories available to date have been designed to accommodate either shotgun experiments or generic proteomic data files. Here, we describe a new kind of proteomic data repository for the collection and representation of data from selected reaction monitoring (SRM) measurements. The PeptideAtlas SRM Experiment Library (PASSEL) allows researchers to easily submit proteomic data sets generated by SRM. The raw data are automatically processed in a uniform manner and the results are stored in a database, where they may be downloaded or browsed via a web interface that includes a chromatogram viewer. PASSEL enables cross-analysis of SRM data, supports optimization of SRM data collection, and facilitates the review process of SRM data. Further, PASSEL will help in the assessment of proteotypic peptide performance in a wide array of samples containing the same peptide, as well as across multiple experimental protocols.
Keywords: data repository, MRM, software, SRM, targeted proteomics
Introduction
Shotgun proteomics is a technique that aims to identify as many proteins as possible in biological samples, without any prior proteomic knowledge of the sample [1]. This is achieved by the sequential selection of precursor ions and the recording of their fragment ion spectra in a mass spectrometer, followed by computational analysis of the acquired spectra. The PeptideAtlas project was initiated in 2002 to create a compendium of high quality peptide identifications and their associated fragment ion spectra from shotgun proteomics experiments submitted by laboratories around the world [2–3]. The PeptideAtlas project collects raw shotgun proteomics data files from the community and processes them via a uniform computational pipeline, the Trans-Proteomic Pipeline (TPP; [4–5]) to ensure a consistent, well understood and low false discovery rate. The identified peptides and proteins, along with supporting spectra and experimental metadata, are made available to the community via a web interface [6].
Since the creation of PeptideAtlas, selected reaction monitoring (SRM) has emerged as a powerful method for the targeted detection and quantification of specific, pre-determined peptides in biological samples, at high sensitivity, reproducibility and quantitative accuracy. The technique is therefore particularly suited for the consistent quantification of pre-determined protein sets as is the case in many clinical and systems biology studies [7]. A typical SRM workflow begins with the selection of a set of peptides that optimally and uniquely represents the set of target proteins, and the transitions that identify these peptides. A transition is a pair of m/z values, one for the precursor ion of the targeted peptide and one for one of its fragment ions. Typically, peptides are selected for detectability and uniqueness to a specific protein, and three to ten transitions are selected per peptide, forming a transition group that conclusively identifies the targeted peptide and by inference the protein. Known amounts of matching, isotopically-labeled peptides may be spiked into the sample to provide accurate quantification and aid the identification. The instrument is then programmed to monitor only the specified transitions, either over the entire time course, or restricted to specific elution time windows (scheduled SRM). See the SRM tutorial by Lange et al. [8] for more details.
The acquired time/intensity curve for a single transition, in the following referred to as a trace, is recorded and the traces for the transitions selected for each peptide are aligned to generate a trace group for each targeted peptide. A peak in a trace indicates measurable ion current for the transition at a given time; several coincident peaks whose apexes align at a common retention time form a peak group and thus comprise a body of evidence that the peptide of interest eluted at that time. Several peak groups may appear in a single trace group; part of the analysis is to determine which, if any, represents detection of the peptide of interest. See Figure 3 for an illustration of these concepts. Traces and trace groups can be visualized and analyzed using various software tools that assess the likelihood that the peptide was actually observed and calculate its relative or absolute abundance, such as ATAQS [9], AuDIT [10], mProphet [11], MRMaid [12], MRMer [13], Skyline [14], and TIQAM [15].
Figure 3. Chromavis side-by-side chromatogram viewer.

Trace groups for measurements targeting light (unlabeled) and heavy (isotopically labeled) versions of the same peptide in the same SRM run are displayed for comparison. X- and Y-axes are locked to same scales and ranges, and pointer hovers over large peak group at 24.89 minutes in the chromatogram on the right. Here, coinciding peaks in most of the ten traces almost certainly represent detection of the heavy-labeled standard. A similar looking, though less intense, peak group exists at the same time point in the left chromatogram and thus likely represents detection of the matching endogenous light peptide but at lower concentration. Also in the left chromatogram is a single peak at 24.7 minutes; this likely represents detection of one fragment of a different peptide. User may very rapidly zoom in and out by selecting a desired region in a complete chromatogram (bottom) or an upper zoom-in display.
Features have been added to PeptideAtlas to leverage shotgun data in support of SRM experiment design[16]. An SRM-specific section of PeptideAtlas, SRMAtlas [17], has been created as a combined catalog of best-available transitions selected from either PeptideAtlas shotgun data, data collected for whole proteome synthetic proteotypic peptide libraries [18], published validated transitions, and theoretical transition prediction approaches. Collectively, these data support the set up of generic SRM measurements. Most of the data in SRMAtlas are, however, not derived from measurements in biological samples and, therefore, do not account for sample-specific issues such as interfering signals, ion suppression or other chemical components that can confound an assay. Now that a substantial number of SRM data sets are being published, an SRM experimental data repository would be of great benefit to the community, by providing a centralized location where well-annotated SRM data and results, with all their sample and experiment specific issues and raw data files, can be permanently stored, explored, cross-compared, assessed by reviewers, and reused by other resources, all in a vendor independent manner.
Several resources serve specifically as SRM transition repositories, including MRMaid-DB [19] and the PeptideAtlas component PASTRAMI [17]. However, until now there has been no repository specifically designed to store and present SRM experimental data in a publically accessible manner. PRIDE [20], GPMdb [21], and the original shotgun portion of PeptideAtlas have all been designed around identifications based on shotgun proteomics. Tranche [22] can store any kind of proteomics file and enable download of exactly what was submitted, but provides no mechanism for users to explore the data.
Here we present PASSEL, the PeptideAtlas SRM Experiment Library, an active repository for SRM experimental data. In the following sections we present an overview of PASSEL, followed by details on how data are submitted, processed, and presented.
Overview
PASSEL allows the submission of SRM workflow experimental results to the repository, including the mass spectrometer output files and the interpreted results (Figure 1). The data files undergo automated processing by software tools such as mQuest [23], and the results are loaded into the database. The files and results are made available to the community in original form and in a browsable format. Additionally, the measured transitions are incorporated into the SRMAtlas catalogs of best-available transitions. Since the main purpose of the SRM technique is the reproducible and accurate measurement of specific protein sets in multiple samples, the availability of the prior data in PASSEL should greatly increase the quality of SRM data generated by the proteomics community and advance the use of SRM-based targeted proteomics in general.
Figure 1. Overview of the PASSEL process.

SRM experimental results submitted by the community are stored in a raw data repository that is accessible via a web user interface. These data are also processed through a software pipeline which extracts trace groups from the raw data and assigns various quality metrics using mQuest; the results of this processing are stored in a database which is also browsable via a web interface. The highest quality transitions serve as one of several sources for the SRMAtlas whole-proteome catalogs of best available peptides and transitions.
Data submission and repository
Data from an SRM experiment can be contributed to PASSEL by submitting three (optionally four) of the following data types: 1) study metadata, such as sample source, sample preparation, and instrument used, entered into a simple web form; 2) transition list, describing the targeted ions; 3) mass spectrometer output files, in mzML [24] or mzXML [25] format (or, if these are not available, in .wiff (ABI), .RAW (Thermo), or .d (Agilent) vendor formats); 4) optionally, the output of the data analysis tool used, such as a mProphet peak group output file. The transition list describes which transitions were measured for each peptide, along with optional supporting information such as the collision energy and declustering potential used, expected retention time, and expected relative intensities. Currently, the tab-separated-value (TSV) formats commonly uploaded to the instruments are supported, as well as the mQuest input format, Skyline .sky format, and the HUPO Proteomics Standards Initiative TraML format [26]. The data files are uploaded by the user to a specially created FTP account based on the metadata submitted. Contributed data are stored in the PASSEL data repository and may be browsed from the PASSEL Experiment Browser (Figure 2A), which allows filtering based on investigator, organism, sample, and instrument type. This interface also allows direct download of the original files as they were uploaded during submission. An alternate submission mechanism wherein the data files can be pulled from a user-supplied Tranche hash can be implemented.
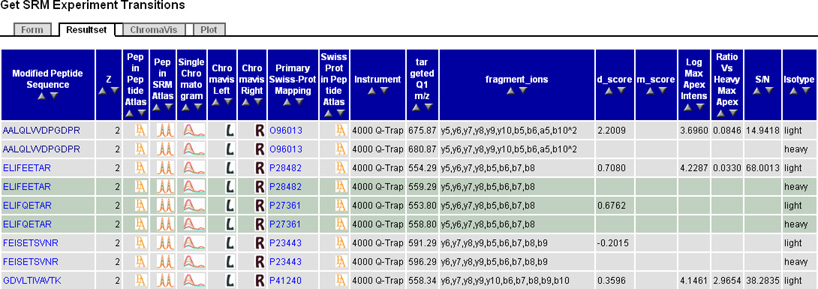
Figure 2.

(A) PASSEL experiment browser. Four publicly available experiments are shown, with the second entry expanded to show more details. Clicking the TxGrps hyperlink displays all of the transition groups for the experiment in the Transition Group Browser (Figure 2B).
(B) PASSEL transition group browser. Here, the user has selected to display all transition groups from a particular SRM run. Each row contains data for one measured transition group, including peptide sequence, charge, protein, instrument, m/z, fragment ions measured, quality scores, and quantitation metrics. Peptide sequences and protein names are hyperlinked so that one can obtain with a single click all results for a particular peptide or protein. Small icons provide links to PeptideAtlas, SRMAtlas best transitions, and the Chromavis chromatogram viewer. At the bottom of the page (not shown) are links for downloading the data into a spreadsheet.
Data Processing
All contributed data are first analyzed using mQuest, a component of the mProphet software suite[11]by the PeptideAtlas group. It is therefore not required that the submitted data are preprocessed. For each transition group, mQuest detects up to five of the strongest peak groups and calculates several different metrics for each, some of which rely on the measurement of heavy-labeled peptides. mQuest also computes a measure of signal-to-noise and the relative intensity for each peak group. Finally, mQuest calculates several metrics that may be used to estimate relative abundance among peptides, including total extracted ion current and maximum apex intensity.
Experiments which include measurements of decoy transitions may be processed by the investigator with the full mProphet pipeline, which models the mQuest metrics using the decoy peak groups as the negative distribution to derive the shape of the positive distribution. These models are used to assign a p-value to each peak group, providing a measure of the likelihood that a peak group was not generated by the intended target. If provided, mProphet output will be loaded into PASSEL and displayed.
Information about each trace group and the associated mQuest/mProphet metrics and statistics are loaded into the PASSEL database using a Perl script integrated into the PeptideAtlas code base. For the traces themselves, we store a pointer to the original mzML or mzXML file. The traces may be recalled using these pointers.
Accessing the Results
PASSEL includes two entry points for data browsing: the previously described Experiment Browser (Figure 2A), which provides links to all raw and processed data for a particular experiment, and a Transition Group Browser (Figure 2B) which allows filtering of the entire PASSEL database by organism, protein, peptide, Q1, Q3, fragment type, mQuest metrics, mProphet scores, and by experiment. The Transition Group Browser provides a description of each selected transition group and the data collected for it, a link to visualize the trace group using the Chromavis chromatogram viewer (Figure 3), and further links to information in SRMAtlas and PeptideAtlas to extract or compare spectral features of the targeted peptides. PASSEL provides data for every transition group measured for an experiment without regard to whether the peptide has actually been detected, so negative results are available as well. Quality filtering may be done using mQuest metrics or mProphet statistics.
The highly interactive Chromavis chromatogram viewer (Figure 3) is implemented in JavaScript and allows the visualization of a trace group with rapid zooming and panning, plus a graphical depiction of the quality of the match of any peak group to an idealized peak group. Chromavis is rendered as Scalable Vector Graphics (SVG), a component of the forthcoming HTML5 standard. SVG is created and manipulated in-browser using a JavaScript library called Protovis (vis.stanford.edu/protovis). The tool is instantiated programmatically with a single JSON (JavaScript Object Notation) object containing input data and configuration options. Options include settings for the display characteristics and the behavior of the display. Interactive behavior (hover, click, drag, etc) is supported on the tool to provide fine-grained navigation. The tool supports auto-scaling of the y-axis, display of predicted relative peak intensity when provided, and a “prediction match” gauge. Chromatograms may be displayed individually in separate browser tabs or windows, or two may be displayed side-by-side for easy comparison in a tabbed pane of the PASSEL window.
Uses of PASSEL
PASSEL provides a resource for optimizing SRM experiment design by allowing the investigator to select peptides and transitions based upon previous detections, either in the same or different sample types. The SRMAtlas build process [17] currently sources from submitted transitions lists via PASTRAMI, and now also sources from detected peak groups in PASSEL that have mProphet p-values below a set threshold, currently 0.01. PASSEL will help in the assessment of proteotypic peptide performance in a wide set of samples containing the same peptide as well as performance across multiple experimental protocols. For example, PASSEL will contain information on sample specific interfering transition signals on the chosen set of peptides per protein and the performance of stable isotope reference peptides for particular proteotypic peptides per target protein.
Furthermore, PASSEL supports the continuing development of SRM technology by providing a collection of varied SRM data that can be used for meta data analysis, such as discovering properties of successful transition lists, or for testing new data analysis software. Finally, PASSEL can provide a conveniently browsable means of sharing experimental data associated with a journal publication, including during the review process.
Conclusion
We have presented the new PASSEL proteomics repository specifically designed for collecting and representing SRM experimental data acquired in real world studies. Like the original shotgun section of PeptideAtlas, PASSEL facilitates the sharing of results among the proteomics community, thereby accelerating research. Additional features will be added to the system in the coming year. These enhancements include the storage of more detailed and structured sample information in accordance with forthcoming ProteomeXchange guidelines, user selectable search criteria for particular datasets, and the ability to incorporate data acquired using the SWATH-MS workflow (Gillet et al., submitted), a technique where all precursors and fragment ions are acquired in a multiplexed mode and the SRM-like targeting is performed subsequently in silico.
Currently, there are over a half dozen experiments loaded into PASSEL, four of which are publicly accessible, and these may be accessed by visiting http://www.peptideatlas.org/passel/. We encourage the submission of any published or otherwise public SRM data following the simple mechanism available at the same URL as above.
Acknowledgements
We thank Simon Letarte, Hamid Mirzaei, and Jeff Whiteaker for contributing SRM data to PASSEL. This work has been funded in part with federal funds from the National Institutes of Health-National Human Genome Research Institute (grant No. HG005805 to R.M.), the Duchy of Luxembourg Systems Biology initiative (to R.M.), the National Institute of General Medical Sciences, under grant No. R01 GM087221 (to E.W.D), the Swiss National Science Foundation (grant No. 31000-10767 to R.A.), and the European Research Council (grant #ERC-2008-AdG 233226 to RA).
Footnotes
The authors declare no financial or commercial conflicts of interest.
References
- 1.Aebersold R, Mann M. Mass spectrometry-based proteomics. Nature. 2003;422:198–207. doi: 10.1038/nature01511. [DOI] [PubMed] [Google Scholar]
- 2.Desiere F, Deutsch EW, Nesvizhskii AI, Mallick P, et al. Integration with the human genome of peptide sequences obtained by high-throughput mass spectrometry. Genome Biol. 2004;6:R9. doi: 10.1186/gb-2004-6-1-r9. [DOI] [PMC free article] [PubMed] [Google Scholar]
- 3.Desiere F, Deutsch EW, King NL, Nesvizhskii AI, et al. The PeptideAtlas project. Nucleic Acids Res. 2006;34:D655–D658. doi: 10.1093/nar/gkj040. [DOI] [PMC free article] [PubMed] [Google Scholar]
- 4.Keller A, Eng J, Zhang N, Li XJ, Aebersold R. A uniform proteomics MS/MS analysis platform utilizing open XML file formats. Mol Syst Biol. 2005;1 doi: 10.1038/msb4100024. 2005.0017. [DOI] [PMC free article] [PubMed] [Google Scholar]
- 5.Deutsch EW, Mendoza L, Shteynberg D, Farrah T, et al. A guided tour of the Trans-Proteomic Pipeline. Proteomics. 2010;10:1150–1159. doi: 10.1002/pmic.200900375. [DOI] [PMC free article] [PubMed] [Google Scholar]
- 6.Farrah T, Deutsch EW, Aebersold R. Using the Human Plasma PeptideAtlas to study human plasma proteins. Methods Mol Biol. 2011;728:349–374. doi: 10.1007/978-1-61779-068-3_23. [DOI] [PubMed] [Google Scholar]
- 7.Domon B, Aebersold R. Options and considerations when selecting a quantitative proteomics strategy. Nat Biotechnol. 2010;28:710–721. doi: 10.1038/nbt.1661. [DOI] [PubMed] [Google Scholar]
- 8.Lange V, Picotti P, Domon B, Aebersold R. Selected reaction monitoring for quantitative proteomics: a tutorial. Mol Syst Biol. 2008;4:222. doi: 10.1038/msb.2008.61. [DOI] [PMC free article] [PubMed] [Google Scholar]
- 9.Brusniak MY, Kwok ST, Christiansen M, Campbell D, et al. ATAQS: A computational software tool for high throughput transition optimization and validation for selected reaction monitoring mass spectrometry. BMC Bioinformatics. 2011;12:78. doi: 10.1186/1471-2105-12-78. [DOI] [PMC free article] [PubMed] [Google Scholar]
- 10.Abbatiello SE, Mani DR, Keshishian H, Carr SA. Automated detection of inaccurate and imprecise transitions in peptide quantification by multiple reaction monitoring mass spectrometry. Clin Chem. 2010;56:291–305. doi: 10.1373/clinchem.2009.138420. [DOI] [PMC free article] [PubMed] [Google Scholar]
- 11.Reiter L, Rinner O, Picotti P, Huttenhain R, et al. mProphet: automated data processing and statistical validation for large-scale SRM experiments. Nat Methods. 2011;8:430–435. doi: 10.1038/nmeth.1584. [DOI] [PubMed] [Google Scholar]
- 12.Mead JA, Bianco L, Ottone V, Barton C, et al. MRMaid, the web-based tool for designing multiple reaction monitoring (MRM) transitions. Mol Cell Proteomics. 2009;8:696–705. doi: 10.1074/mcp.M800192-MCP200. [DOI] [PMC free article] [PubMed] [Google Scholar]
- 13.Martin DB, Holzman T, May D, Peterson A, et al. MRMer, an interactive open source and cross-platform system for data extraction and visualization of multiple reaction monitoring experiments. Mol Cell Proteomics. 2008;7:2270–2278. doi: 10.1074/mcp.M700504-MCP200. [DOI] [PMC free article] [PubMed] [Google Scholar]
- 14.MacLean B, Tomazela DM, Shulman N, Chambers M, et al. Skyline: an open source document editor for creating and analyzing targeted proteomics experiments. Bioinformatics. 2010;26:966–968. doi: 10.1093/bioinformatics/btq054. [DOI] [PMC free article] [PubMed] [Google Scholar]
- 15.Lange V, Malmstrom JA, Didion J, King NL, et al. Targeted quantitative analysis of Streptococcus pyogenes virulence factors by multiple reaction monitoring. Mol Cell Proteomics. 2008;7:1489–1500. doi: 10.1074/mcp.M800032-MCP200. [DOI] [PMC free article] [PubMed] [Google Scholar]
- 16.Deutsch EW, Lam H, Aebersold R. PeptideAtlas: a resource for target selection for emerging targeted proteomics workflows. EMBO Rep. 2008;9:429–434. doi: 10.1038/embor.2008.56. [DOI] [PMC free article] [PubMed] [Google Scholar]
- 17.Deutsch EW, Campbell DS, Mendoza L, Sun Z, et al. SRMAtlas: Generating targeted proteomics transition atlases for complete proteomes. in preparation. [Google Scholar]
- 18.Picotti P, Rinner O, Stallmach R, Dautel F, et al. High-throughput generation of selected reaction-monitoring assays for proteins and proteomes. Nat Methods. 2010;7:43–46. doi: 10.1038/nmeth.1408. [DOI] [PubMed] [Google Scholar]
- 19.Cham JA, Bianco L, Barton C, Bessant C. MRMaid-DB: a repository of published SRM transitions. J Proteome Res. 2010;9:620–625. doi: 10.1021/pr900713u. [DOI] [PubMed] [Google Scholar]
- 20.Martens L, Hermjakob H, Jones P, Adamski M, et al. PRIDE: the proteomics identifications database. Proteomics. 2005;5:3537–3545. doi: 10.1002/pmic.200401303. [DOI] [PubMed] [Google Scholar]
- 21.Craig R, Cortens JP, Beavis RC. Open source system for analyzing, validating, and storing protein identification data. J Proteome Res. 2004;3:1234–1242. doi: 10.1021/pr049882h. [DOI] [PubMed] [Google Scholar]
- 22.Falkner JA, Andrews PC. Tranche: Secure Decentralized Data Storage for the Proteomics Community. Journal of Biomolecular Techniques. 2007;18:3. [Google Scholar]
- 23.Reiter L, Rinner O, Picotti P, Hüttenhain R, et al. mProphet: A general and flexible data model and algorithm for automated SRM data processing and statistical error estimation. MCP. submitted. [Google Scholar]
- 24.Martens L, Chambers M, Sturm M, Kessner D, et al. mzML--a community standard for mass spectrometry data. Mol Cell Proteomics. 2011;10 doi: 10.1074/mcp.R110.000133. R110 000133. [DOI] [PMC free article] [PubMed] [Google Scholar]
- 25.Pedrioli PG, Eng JK, Hubley R, Vogelzang M, et al. A common open representation of mass spectrometry data and its application to proteomics research. Nat Biotechnol. 2004;22:1459–1466. doi: 10.1038/nbt1031. [DOI] [PubMed] [Google Scholar]
- 26.Deutsch EW, Chambers M, Neumann S, Levander F, et al. TraML – a standard format for exchange of selected reaction monitoring transition lists. Molecular and Cellular Proteomics. doi: 10.1074/mcp.R111.015040. accepted. [DOI] [PMC free article] [PubMed] [Google Scholar]