

Abstract
In this manuscript, we discuss the development and clinical use of a thermoplastic modular microsystem for the high-throughput analysis of CTCs directly from whole blood. The modular system offers some innovative features that address challenges currently associated with many CTC platforms; it can exhaustively process 7.5 ml of blood in less than 45 min with recoveries >90%. In addition, the system automates the post-selection CTC processing steps and thus, significantly reduces assay turnaround time (from selection to enumeration <1.5 h as compared to >8 h for many reported CTC platforms). The system is comprised of 3 functional modules including; (i) a thermoplastic CTC selection module composed of high aspect ratio (30 μm × 150 μm) channels containing anti-EpCAM antibodies that is scalable in terms of throughput by employing channel numbers ranging from 50 to 320 – the channel number is user selected to accommodate the volume of blood that must be processed; (ii) an impedance sensor module for label-less CTC counting; and (iii) a staining and imaging module for the placement of released cells into a 2D array within a common imaging plane for phenotypic identification. To demonstrate the utility of this system, blood samples from patients with local resectable and metastatic pancreatic ductal adenocarcinoma (PDAC) were analyzed. We demonstrate the ability to select EpCAM positive CTCs from PDAC patients in high purity (>86%) and with excellent yields (mean = 53 CTCs per ml for metastatic PDAC patients) using our modular system. In addition, we demonstrate the ability to detect CTCs in PDAC patients with local resectable disease (mean = 11 CTCs per ml).
Introduction
The presence of circulating tumor cells (CTCs) in cancer patients was documented as early as 1869.1 CTCs are shed from many solid tumors and have been implicated as key participants in the metastatic process. As such, CTCs have attracted attention as a new class of biomarkers that can provide valuable clinical information for staging of patients, early diagnosis of relapse, guiding therapy, monitoring response to particular therapies and detection of disease recurrence.2–21 Another attribute of CTCs is that they can easily be obtained through a simple blood draw, potentially obviating the need for securing biopsies.
The main challenge associated with the analysis of CTCs is their low frequency; 1–100 CTCs per ml of blood. Thus, highly sensitive and specific enrichment techniques are required to enable effective CTC analysis. Three important metrics are considered when evaluating CTC enrichment techniques; (i) throughput, defined as the maximum sample processing rate (volume flow rate in ml/h); (ii) recovery, an indicator of the number of target cells selected from the input sample; and (iii) purity defined as the ratio of CTCs selected to the total number of cells enriched.
CellSearch™ (Veridex) is the only FDA-approved technology for CTC enrichment and utilizes functionalized magnetic beads that target tumor specific antigens associated with CTCs, which in most cases is the epithelial cell adhesion molecule, EpCAM. This system has been validated through many clinical reports, however, it suffers from low purity (0.01 – 0.1%) and poor clinical sensitivity.22–23 Thus, new technologies that can provide higher CTC sensitivity and specificity as well as automate the entire processing pipeline are needed.
Microfluidics has been demonstrated to be viable platforms for CTC analyses,24–30 and offer several compelling operational characteristics: (i) They can be configured to select CTCs based on several different selection modalities.31 (ii) Microfluidic chips operate in a closed architecture, minimizing the potential of sample contamination. (iii) Microfluidic devices can be produced in a high production mode and at low-cost using, for example, thermoplastics and micro-replication.28, 32–33 (iv) CTC selection devices can be integrated to other processing steps to fully automate sample processing.
Microfluidic devices using affinity selection typically demonstrate higher purities compared to size-based selection, but at the expense of throughput.28–29, 32–34 CTC microfluidic affinity beds have employed a variety of geometrical configurations and fluid dynamics to optimize recoveries.28–29, 32–33 Low throughput typically results from the necessity of using relatively low linear velocities to promote highly efficient antigen/antibody interactions.28–29 For example, a CTC chip utilizing a staggered arrangement of microposts produced a recovery of 65% with a throughput of 1 ml/h.29 Other geometries have employed herringbone channels to induce chaotic mixing leading to recoveries on the order of 91% and purities from 9% to 14%.35 Recently, a nanotextured herringbone device consisting of silicon nanopillars was reported.36 A flow rate of 1 ml/h was used for CTC selection from clinical samples. Adams and coworkers utilized high aspect ratio sinusoidal channels to reduce pressure drops and increased throughput (1.6 ml/h) with a recovery of ~97%.
Irrespective of the CTC selection modality employed, the enumeration process, which consists of staining the selected cells with DAPI, anti-CD45 antibodies and a cytokeratin cocktail, has been difficult and tedious to undertake requiring imaging of large areas and, in some cases, several imaging planes. For example, using a positive selection CTC microfluidic device developed by our group,28 6 h of imaging time was required to enumerate the cells. As another example, Stott et al. reported a total scan time of 8 h for a CTC microfluidic chip.35
Another challenge for CTC assays is that some epithelial cancers do not show high sensitivity to the CTC assay, for example pancreatic cancer. Pancreatic ductal adenocarcinoma, PDAC, is one of the deadliest forms of pancreatic cancer and the fourth-leading cause of cancer-related deaths worldwide. According to the National Cancer Institute, it is one of the most prognostically unfavorable human cancers with the rate of incidence nearly equal to the rate of mortality.37–40 Unfortunately, several CTC technologies provide low clinical yields for this disease. For example, the CellSearch system demonstrated clinical CTC yields for metastatic PDAC patients in the range of 0–1 per 7.5 ml of blood.41–42 Recently, a micro-pillar-based CTC fluidic device has generated fairly high yields of CTCs for PDAC patients using anti-EpCAM antibodies as the selection marker.29
Herein we present a novel system for the selection and subsequent analysis of CTCs directly from blood samples using a modular design approach to achieve high throughput, high recovery, high purity and full process automation with a short assay turnaround time. The three main components of the modular system included: (i) A high throughput (HT) CTC selection module used for the affinity enrichment of CTCs; (ii) an impedance sensor module for label-free counting; and (iii) a staining and imaging module for placing the CTCs in a small viewing area. The HT-CTC selection module consisted of a novel architecture with a parallel network of high aspect ratio curvilinear channels arranged in a z-configuration. This module could be scaled from 50 to 320 microchannels depending on the blood volume processing needs. As a prescreening tool, we included into the system an impedance sensor module that utilized Pt electrodes to count cells released from the selection module. The third module, referred to as the staining and imaging module, was used for collection, staining, and visualization of the selected cells for phenotype identification. This module eliminated the arduous task of scanning large area selection beds by placing CTCs within a small viewing area and a single imaging plane. The clinical utility of this modular microsystem was tested using blood samples from patients with local resectable and metastatic PDAC.
Experimental Section
Fabrication of microfluidic modules
The CTC processing system (see Figure 1) consisted of three separate, task-specific polymer modules: (1) HT-CTC selection module; (2) impedance sensing module; and (3) the staining and imaging module. Hot embossing and laser ablation were used as the primary tools for fabrication of the polymer fluidic modules as described previously (see Electronic Supplementary Information, ESI, for details).43
Figure 1.
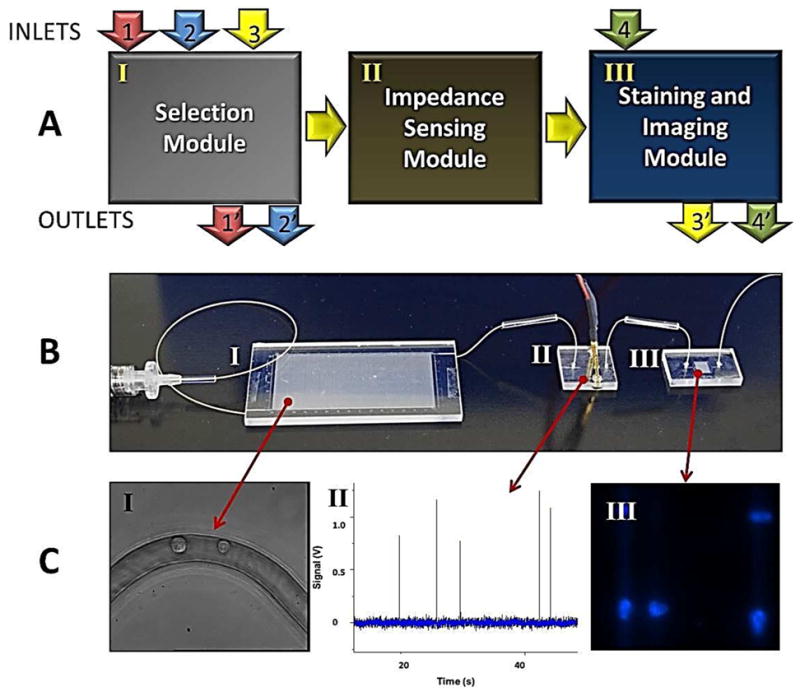
Modular microfluidic system for CTC analysis. (A) Schematic representation of the operation of the system and the three modules comprising the system including the HT-CTC module, the impedance sensing module and the staining and imaging module. Arrows indicate flow of sample (1 and 1′), wash buffer (2 and 2′), CTC release buffer (3 and 3′), and fixation and staining reagents (4 and 4′). For detailed operational procedures please refer to the Experimental section. (B) Picture of the assembled system. Roman numerals correspond to modules described in (A). (C) Micrographs and data plots showing various outputs of the three modules including: (I) HT-CTC selection module for the positive selection of CTCs; (II) electrical signatures of CTCs obtained using the impedance sensor module; and (III) images of CTCs stained with DAPI and collected at the staining and imaging module.
The HT-CTC module (see Figure 2) was made from the thermoplastic, cyclic olefin copolymer, COC. This module consisted of an array of high-aspect ratio sinusoidal microchannels with a nominal width of 30 μm and depth of 150 μm serving as the CTC selection bed. Selection beds were addressed using a single inlet and outlet channel arranged in a z-configuration. Selection channel numbers were user selectable and ranged from 50 – 320.
Figure 2.
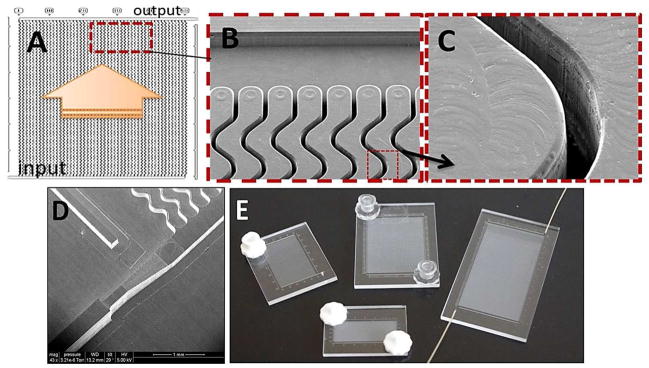
(A) Schematic operation of the HT-CTC module with 50 parallel, sinusoidal microchannels and inlet/outlet channels arranged in the z-configuration. The large arrow indicates sample flow direction through the selection channels. (B) SEM of the selection bed showing high-aspect ratio sinusoidal microchannels and the output channel (top). (C) SEM of one of the high-aspect ratio sinusoidal channels. (D) SEM image of a portion of the high-precision micromilled brass molding tool showing the sample inlet port with continuously changing width and height for minimizing unswept volumes during sample (i.e., blood) introduction. (E) Assembled HT-CTC modules with different numbers of microfluidic sinusoidal channels designed for efficient processing of various sample volumes.
After hot embossing, the HT-CTC module and cover plate were flood exposed to broad band UV light at ~22 mW/cm2 (254 nm) for 15 min using a low pressure Hg lamp (GLF-42, Jelight Company Inc., Irvine, CA). UV exposure produced carboxylic acid surfaces that were used for the covalent attachment of monoclonal anti-EpCAM antibodies for CTC selection.44–45 Following UV exposure, the substrate was enclosed with a cover plate by thermal fusion bonding at a temperature of 132°C and a bonding pressure of ~1 N/cm2.
After assembly, the surface of the microfluidic channels was modified using EDC-NHS chemistry. This consisted of 50 mg/ml EDC (1-Ethyl-3-[3-dimethylaminopropyl] carbodiimide hydrochloride), 5 mg/ml NHS (N-hydroxysuccinimide) in 100 mM MES (pH 6), followed by incubation with a solution of anti-EpCAM monoclonal antibodies (0.5 mg/ml; 150 mM PBS buffer, pH 7.4). The optimum concentration of the antibody was chosen based on studies to optimize CTC recovery (Figure S1 in the ESI).
For the fabrication and operation of the impedance sensing module, readers should refer to the ESI. Also provided in the ESI is the information on the processing electronics and data collection and analysis.
The design of the staining and imaging module, which was made from PMMA, is presented in Figure 3. It consisted of two independent microchannel networks, one consisting of an array of smaller microchannels laser machined (6 × 8 μm2) into the module cover plate and a second set of fluidic channels (50 μm depth; varying width) embossed into the substrate, which consisted of interleaving channels. Both parts were thermal fusion bonded at 106°C and a pressure of ~3 N/cm2 with the patterned surfaces facing each other. The staining and imaging module possessed 800 pores arranged in a 2D matrix spaced by 100 μm.
Figure 3.

Staining and imaging module. (A) Assembly process; (a) – cover plate with an array of 8 × 6 μm2 channels, which form pores for retaining cells between the interleaving inlet and outlet channels (b). (B) Schematic of an assembled module and its operation; Red – input channels; Blue – output channels; Yellow – interconnecting channels. (C) Image of the staining and imaging module filled with fluorescein. The lower fluorescence intensity in the interconnecting channels is due to the smaller cross-sectional area of these channels compared to the input/output channels. (D) Fluorescence image of CTCs retained by pores. The cells were stained with DAPI for visualization. (E) High magnification fluorescence image of Hs578T cells retained at the pore structures of the staining and imaging module. These cells were stained with PKH67 lipid membrane green fluorescent dye for visualization.
Connection between modules was accomplished using glass capillaries (Polymicro Technologies, Phoenix, AZ; id = 150 μm) compression fit to inlet and outlet ports of each module (see Figure S4C in the ESI). Capillaries were connected to each other using low dead volume interconnects secured from Polymicro.
Materials
Pt wires (75 μm diameter), which were used as the impedance microelectrodes, were purchased from Sigma-Aldrich (St. Louis, MO). COC (Topas 6013S-04) plates (1/8″ thick) and films (250 μm thick) were acquired from Topas Advanced Polymers, Florence KY. 1/8″ thick PMMA hot embossing stock was acquired from SABIC Polymershapes (Raleigh, NC). 250 μm thick PMMA films used as the imaging module cover plates were purchased from Goodfellow (Oakdale, PA). PEEK tubing and connectors were purchased from IDEX Health & Science (Oak Harbor, WA). Chemicals used for PMMA and COC surface cleaning and modification included reagent grade isopropyl alcohol, EDC, NHS, fetal bovine serum, and MES all of which were acquired from Sigma-Aldrich. Monoclonal anti-EpCAM antibody was obtained from R&D Systems (Minneapolis, MN). Tris-glycine buffer was obtained from Bio-Rad Laboratories (Hercules, CA). PBS buffer and trypsin were purchased from Sigma-Aldrich. For CTC immunostaining, the nuclear stain DAPI was obtained from Thermo Pierce Technologies (Rockford, IL). Anti-CD45-FITC antibody (HI30 clone) and anti-cytokeratin antibodies (8/19 conjugated to Texas Red) were purchased from eBiosciences (San Diego, CA). Bovine serum albumin (BSA) in PBS buffer (pH 7.4) was secured from Sigma.
Cell culture and patient samples
For a description of culturing the model cell lines used for these studies, please see the ESI. Also contained in the ESI is information on the accrual of patient samples used in these studies.
HT-CTC module operation
Blood specimens were collected into BD Vacutainer® tubes containing EDTA as anticoagulant (Becton-Dickinson, Franklin Lakes, NJ) and following homogenization, 3 ml of patient blood was transferred into a disposable Luer Lok™ syringe (BD Biosciences). Immediately after transfer, blood samples were processed through the HT-CTC selection module. A PHD2000 syringe pump (Harvard Apparatus, Holliston, MA) was used to drive the blood through the HT-CTC selection module at the appropriate volume flow rate.28 The HT-CTC selection bed was then flushed with 2.5 ml of PBS at a linear velocity of 4 mm/s to remove any nonspecifically bound cells.
Operation of the integrated system and data collection and analysis
Following CTC selection and bed washing, 200 μl of the CTC release buffer consisting of 0.25% w/v trypsin in 25 mM TRIS/192 mM glycine buffer (pH 7.4) was infused through the HT-CTC selection module to allow for the release of CTCs from the selection channels. The concentration of trypsin selected here was based upon similar conditions used for trypsinizing cells in culture and thus, minimize damage to membrane proteins used for characterization (i.e., immunostaining). Also, trypsinizing cells does affect viability, but it does not induce cell lysing (data not shown) making the cells available for impedance sensing and staining. Upon release, the CTCs traversed through the impedance sensor and an electrical signal was recorded using in-house designed electronics.28 Impedance responses generated from CTCs were counted when the signal-to-noise ratio exceeded 3:1. Cells counted were directed into the staining and imaging module for staining with fluorescently labeled markers.
The stained cells were imaged using an inverted Olympus 1×71 microscope (Center Valley, PA) equipped with a high resolution (1344 × 1024) CCD camera (Hamamatsu ORCA-03G) and a mercury arc lamp. Images were collected using 40x (0.6 NA) and 60x (0.7 NA) dry lens objectives and analyzed using Metamorph software (Olympus). Exposure times for the DAPI, FITC/CD45, and Texas Red/CK channels were 50 ms, 600 ms and 600 ms, respectively. See the ESI for the staining procedure of the cells. Statistical analysis was performed using the Kruskal-Wallis Test (p=0.05) for three sample groups of healthy donors, local resectable patients and metastatic PDAC patients. For pair wise test analysis, Wilcoxon Rank-Sum (p=0.05) was applied.
Results and Discussion
HT-CTC selection module
The HT-CTC module utilized COC as the substrate material. COC demonstrates higher UV transmissivity compared to PMMA, therefore generating a higher surface density of carboxylic acid groups on high aspect ratio channel walls. These surface-confined carboxyl groups serve as functional scaffolds for the attachment of CTC recognition elements.45–46 Higher UV transmission also resulted in a more uniform modification of the high-aspect ratio microchannel walls when made from COC. COC also demonstrated higher CTC purities compared to PMMA.46
Considering the requirements for the microfluidic channel geometry and linear velocity of the sample through the selection channels to maximize recovery,28 it was clear that higher throughput could be achieved by either increasing the number of parallel microchannels or increasing the depth of the microchannels without changing the width. For results reported herein, we used larger number of parallel channels as a method for increasing throughput. For example, the previously reported device used 51 parallel channels (cross-section 30 μm × 150 μm) and could process 1 ml of whole blood in 37 min. Thus, it would take nearly 4.7 h for this device to process 7.5 ml. By increasing the number of channels to 320, 7.5 ml input volumes could be processed in <45 min using an average linear velocity of 2 mm/s.
To address all parallel channels within the selection bed employing large numbers of parallel sinusoidal channels, we adopted a unique z-configuration (Figure 2). In this configuration, fluid enters the selection bed through a single inlet channel with a larger cross-sectional area and exits through a single outlet channel also possessing a larger cross-section compared to the sinusoidally-shaped selection channels (see ESI). Both inlet and outlet channels were perpendicular to the high aspect ratio selection channels (Figure 2A).
The z-configuration also provided the smallest possible footprint for addressing the isolation bed and allows for easy scaling of the CTC selection bed. For example, in a recently proposed fluidic design for neutrophil isolation,47 bifurcation was used for addressing parallel channels of the isolation bed, which nearly doubled the footprint of the device to allocate sufficient space for the fluid distribution network. Furthermore, compared to our previously reported design,28 the high linear fluid velocities in the inlet and outlet channels of the z-configuration allowed for more efficient removal of persistent air bubbles that were inevitably introduced into the device during operation, which may compromise recovery.
Uniformity of the fluid flow using the z-configuration is highly dependent on the flow resistance ratio between the inlet/outlet channels and the flow resistance in the parallel channels. In general, wider (lower fluidic resistance) inlet channels and longer and/or narrower (higher fluidic resistance) parallel channels show higher flow uniformity throughout the array. Inhomogeneity of the fluid flow rate is exacerbated by the number of parallel channels in the array. As seen in Figure 4A, a parabolic fill profile was observed over the entire selection bed during filling. Qualitatively, if each channel of the array was filling under a constant linear velocity, the filling profile of the array should show a linear gradient.
Figure 4.

(A) Various stages of filling a 320-channel HT-CTC module (20 mm length) with a dye solution. (B) Numerical simulation results showing the distribution of flow velocities for different configurations of the CTC selection beds arranged in a z-configuration. (C) Average linear velocity of fluid in 16 groups of 20 adjacent sinusoidal high aspect ratio microchannels based on the results depicted in Figure 4A (filled bars) and theoretical values obtained via numerical simulation (empty bars). (D) Distribution of MCF-7 cells selected in 20 mm long microchannels.
To evaluate flow uniformity in the CTC selection bed with various numbers of sinusoidal channels and for various lengths of the selection bed, we performed numerical simulations to establish average linear velocities of fluid in individual sinusoidal microchannels. Due to the numerical limits of simulating large geometries using computational fluid dynamics (CFD), we employed a method described by Zhang and coworkers.48 This method splits the selection bed into an interconnected system of individually defined parallel channels and the addressing inlet/outlet channels. Each channel segment was treated as a fluidic resistor, and the flow dynamics through the entire system was described by pressure and mass balance equations.48
Figure 4B presents solutions for microfluidic selection beds with 50, 250 and 320 channels possessing dimensions of 0.03 × 0.15 × 30 mm3 along with the results for 320 channels with varying lengths of 30, 20 and 8.4 mm. As can be seen from this data, for the 320 channel device with 8.4 mm selection channel lengths, the maximum and minimum flow velocities fall outside the range of 1 mm/s – 4 mm/s, a range that was determined to provide CTC recoveries >80%.28 However, when using 320 channels and incorporating a length of 30 mm, the average flow velocity remains within an acceptable range for maximum CTC recovery.
The simulated results were also confirmed experimentally (Figure 4C). The results indicated good agreement with the simulation results; the slowest flow rates were observed in the middle and fastest at the outer channels with an RSD of 16%. We also evaluated the distribution of selected MCF-7 cells inside a HT-CTC bed modified with anti-EpCAM antibodies. MCF-7 cells (~500) labeled with a PKH 67 fluorescent membrane dye were spiked into normal blood and processed using the selection bed comprised of 320 channels and the numbers of MCF-7 cells per channel were counted using a fluorescence microscope. Figure 4D shows the selected cell distribution within individual channels. A uniform distribution of cells across the entire series of microchannels occurred with most of the channels capturing 1 or 2 cells and only a few capturing 3 – 4 cells or no cells at all. The overall average CTC recovery for these experiments was 83.1% ±5.2% (n = 4). Selection beds with at least 30 mm channel lengths were necessary to achieve recoveries >90% (Figure S2 in the ESI).
Impedance sensor module
The impedance sensor adopted a geometry similar to that reported previously by our group.28 Using this sensor, we were interested in determining the ability to discriminate between leukocytes and CTCs based on size differences, which is the cell characteristic measured at the operating frequency (40 kHz). At this operating frequency, a misclassification rate of 15% was noted (see ESI, Figure S3), which was similar to results provided by optical imaging (Figure S3B, ESI). The impedance sensor in its current format can measure signatures from single cells that are unlabeled and thus, can serve as a prescreening tool for assessing the need to immunocytochemically stain for CTCs (see ESI).
Staining and imaging module
PMMA was selected as the substrate of choice for the staining and imaging module due to the high quality machining it generated using laser ablation as well as its favorable optical properties.49
The design and operation of this novel 2D imaging module are shown in Figure 3. It consisted of two independent networks of channels, an interleaving input/output channel network interconnected using an array of smaller channels positioned orthogonally to the input/output channels. The interconnecting/feed channel interface generated a pore structure, whose dimensions were determined by the size of the interconnecting channel (8 μm base and 6 μm height). During operation, CTCs released from the primary selection bed were transported through the impedance sensor to the staining and imaging module where they were retained due to their larger size as compared to the size of the pore. After collection at each pore, CTCs could be fixed, permeabilized, and immunostained directly within the staining and imaging module followed by fluorescence imaging. The unique geometry of the staining and imaging module offered important benefits: (i) A small footprint (0.16 cm2) as compared to the primary selection bed (4 cm2 for the 50-channel z-configuration module), which significantly reduced the time required for imaging; (ii) cells are brought to a single focal plane further reducing imaging time; and (iii) the highly ordered configuration of the pores allowed for indexing cell position, which also reduced imaging time.
To validate the performance of the staining and imaging module, we determined the collection efficiency of fixed and unfixed cells at a flow rate that was used to move the released CTCs from the selection channels to the staining and imaging module. We used Hs578ST cells seeded into PBS as a model for these studies. The collection efficiency was defined as the ratio of cells collected at the pores to the number of cells counted by the impedance sensor (see Figure S4, ESI). We determined that for fixed cells, the collection efficiency of the staining and imaging module was 96 ±6% (n=5) while for unfixed cells, the collection efficiency was 85 ±11% (n=5). The difference in the collection efficiency is indicative of the higher deformability of unfixed cells compared to those that are fixed (see Figure S5, ESI).50
We also found that the cells resident within a pore adhered to the pore structure even when the solution flow was terminated. Therefore, the cells could be trapped at the pore without requiring boundary conditions to contain the cells. Because of this adhesion, we could remove the staining and imaging module from the system and place it on a conventional microscope stage without losing cells from their respective pore location.
We next evaluated the collection efficiency of the staining and imaging module for patient samples (n = 4, PDAC, see ESI). For the PDAC samples analyzed, the collection efficiency of CTCs by the staining and imaging module was 72 ±13% (see Figure S4, ESI). While the staining and imaging module demonstrated higher collection efficiencies for the Hs578T cell line compared to the clinical samples, this difference could have arisen from impedance signals recorded for leukocytes as well as the CTCs, which were not present in the cell line studies. Also, most of the CTCs are in an apoptotic state and therefore, their cell membrane may not be rigid enough to withstand the pressure exerted on the cell by the pore structure (see Figure S5, ESI).51–53
CTCs in metastatic and local resectable PDAC patients
For metastatic PDAC patient blood samples, we isolated an average of 53 ±29 CTCs/ml, median = 51/ml with a range of 9 to 95 CTCs/ml. To establish assay reproducibility, we also processed three aliquots from the same patient sample. An RSD value of 14% (n=3) was obtained. CTCs were selected in all patients with metastatic PDAC. For the healthy blood donors, in most cases no CTCs were detected.
We also analyzed blood from patients who had been determined to have local resectable PDAC by CT scans. We found an average of 11 CTCs/ml for this group of patients. Based on the Kruskal-Wallis test (p = 0.002), there was a significant difference in the CTCs/ml between metastatic patients, local resectable patients, and healthy donors. Pairwise Wilcoxon Rank-Sum tests suggested that there was a significant difference between metastatic patients and healthy donors (p= 0.005). Between local resectable PDAC patients and healthy donors, there was also a statistically significant difference in terms of CTC numbers (p=0.011). Comparison between metastatic and local resectable patients also indicated a significant CTC number difference (p=0.023). These results remained significant when accounting for multiple testing using the Hochberg method (p-values of 0.016, 0.022, and 0.023). This data is summarized in Figure 5A.
Figure 5.

Selection and enumeration of CTCs via immunophenotyping. (A) Box plot from CTCs isolated from 7 metastatic PDAC patients, 5 healthy donors and 5 local resectable PDAC patients. (B) Fluorescence images of various selected cells from a metastatic PDAC patient: (i) CTC; (ii) two white blood cells; and (iii) cluster of CTCs. (b, f, j) CTC marker for Cytokeratin 8/19 (red) with b, j positive for this marker and f negative for this marker; and (c, g, k) leukocyte antigen marker CD45 (green) with c, k negative for this marker and g positive for this marker. Micrographs (i–l) are of an aggregate of 6 CTCs captured in the HT-CTC module. This aggregate showed positive for cytokeratins 8/19 (j) and negative for leukocyte marker CD45 (k). Bars are 10 μm.
The presence of CTCs from local resectable patients may be indicative of micrometastasis, which is undetectable by conventional diagnostic methods. CT scans, which are commonly used for tumor imaging, are less informative with regard to the micrometastatic nature of the tumor because they cannot detect tumors smaller than 1 cm and thus, may not be effective for assessing the micrometastatic nature of PDAC.37 Continuous monitoring of CTC counts from this group of patients may be important in predicting the disease recurrence after surgical resection.
The purity of the assay was determined as well. The purity was calculated using the ratio of the number of CTCs selected to the total number of cells selected and was found to be 86 ±12% for all samples analyzed (see ESI for further discussion of purity and Table S1). The high purity levels observed in our studies were mainly due to the relatively high shear forces applied to the selected cells during the post selection wash.46 While the CTCs selected on the channel walls remained unaffected by the high shear forces due to the high KD value (3 × 10⁻⁹ M) between EpCAM and anti-EpCAM antibodies and the multi-point contact,28 the non-specifically adsorbed leukocytes are more easily removed from the surface due to their apparent lower adhesion force to the surface.
We noticed microclusters of CTCs in 71% of the PDAC blood samples (Figure 5Ci–l). These clusters were predominantly found near the entrance to the sinusoidal microchannels of the HT-CTC selection module. Recent reports on CTC isolation have cited the presence of similar clusters. It is speculated that these clusters form in circulation or break off from the primary tumor as a cohort of cells.6, 54
We also noted the presence of DAPI(+) cells that stained positive for both cytokeratins and CD45. The frequency of these “double positive” cells was on the order of 1.6 ±2 cells/ml, which was lower than the CTC and/or leukocyte occurrence (see Table S1). This is contrary to other reports, which indicated a much higher frequency of such cells.35 Although at this point we do not understand the origin of these cells, they could be a sub-population of CTCs acquiring mesenchymal markers or leukocytes with an abnormally increased cytokeratin expression. In the current studies, these cells were not classified as CTCs, however, they were included in purity calculations as contaminating cells.
Conclusion
In this study we adopted a modular approach with 3 task-specific modules for processing CTCs in an automated fashion. The first module consisted of a HT-CTC selection module designed with a z-configuration that was scalable to allow processing of input volumes from 1 ml to 7.5 ml in <45 min. The selected cells could be released from the antibody-decorated selection surface and shuttled through an impedance sensor module. The inclusion of the impedance sensor module was useful as a prescreening tool to allow the user to make decisions based on the impedance response as to whether staining and imaging of selected CTC fractions was necessary, which can result in a significant reduction in assay cost and time.
We also described a unique staining and imaging module consisting of a high density array of pore structures made at the intersection of large input/output channels and smaller interconnecting channels. This module demonstrated a significant reduction in the analysis time for CTC imaging; 6 h processing time for analyzing cells in the selection module to 10 min when using the staining and imaging module. Although the collection efficiencies were slightly lower for CTCs generated from clinical samples compared to cell lines, this can be rectified by re-engineering the pore structures to possess smaller dimensions and at the same time increasing the number of pores.
Using this system, we have achieved some interesting clinical data for PDAC as well, both local resectable and metastatic PDAC. We have detected CTCs in all patients diagnosed with PDAC (see Table S1) and with high purity resulting from the high shear forces exerted on the cells following selection in the HT-CTC module. This high purity level should provide the ability to secure high quality molecular profiles of the CTCs that can be used to guide therapy by stratifying patients with PDAC and other solid tumors.
Using our integrated and modular system, CTC assay time was significantly reduced compared to the approach requiring manual processing. For the manual case, the assay time was found to be ~8 h (CTC selection, staining and imaging) with the majority of time relegated to imaging the relatively large selection bed. For the microsystem presented in this manuscript, the assay time was reduced to 1.5 h (45 min CTC selection time even for 7.5 ml of blood, 15 min release time, 20 min fixation, permeabilization and staining time and 10 min imaging time).
The modular approach presented herein provides multiple advantages toward constructing integrated fluidic systems for CTC analysis. These include: (i) Flexibility in the selection of materials used for construction of task-specific modules to optimize performance for each processing step; (ii) ease of reconfiguration of fluidic modules without re-engineering the entire system to accommodate alternative processing steps; (iii) the ability to use separate fabrication modalities optimized for each module; and (iv) high production yields of integrated systems. The main challenge when using a modular design approach is the proper interconnections between modules. Improper nterconnections can produce dead volumes, which can potentially result in CTC loss during processing. While interconnecting modules using capillaries as done here can produce some dead volumes and are somewhat cumbersome to assemble, our current efforts are directed toward integrating the modular system using interconnects that minimize unswept volumes and are easily manufactured and assembled.55
Supplementary Material
Acknowledgments
The authors would like to thank the NIH (R01-EB010087; N43CO-2010-00066; HHSN261201000066C (SBIR), and the Society of Surgical Oncology (JJY)), the University of North Carolina Cancer Research Fund (UCRF) and the World Class University Program in Korea for financial support of this work. The authors would also like to thank the UNC Olympus Imaging Research Center for providing the use of the microscope for CTC imaging.
Footnotes
Conflict of interest disclosure
MLH and SAS have financial interests in BioFluidica, LLC.
References
- 1.Paget S. Lancet. 1889;133:571–573. [Google Scholar]
- 2.Elshimali YI, Grody WW. Diagn Mol Pathol. 2006;15:187–194. doi: 10.1097/01.pdm.0000213463.98763.b9. [DOI] [PubMed] [Google Scholar]
- 3.Jacob K, Sollier C, Jobodo N. Expert Rev Proteomics. 2007;4:741–756. doi: 10.1586/14789450.4.6.741. [DOI] [PubMed] [Google Scholar]
- 4.Loberg RD, Fridman Y, Pienta BA, Keller ET, McCauley LK, Taichman RS, Pienta KJ. Neoplasia. 2004;6:302–309. doi: 10.1593/neo.03484. [DOI] [PMC free article] [PubMed] [Google Scholar]
- 5.Mocellin S, Hoon D, Ambrosi A, Nitti D, Rossi CR. Clin Cancer Res. 2006;12:4605–4613. doi: 10.1158/1078-0432.CCR-06-0823. [DOI] [PubMed] [Google Scholar]
- 6.Paterlini-Brechot P, Benali NL. Cancer Lett. 2007;253:180–204. doi: 10.1016/j.canlet.2006.12.014. [DOI] [PubMed] [Google Scholar]
- 7.Pelkey TJ, Frierson HF, Bruns DE. Clin Chem. 1996;42:1369–1381. [PubMed] [Google Scholar]
- 8.Tsouma A, Aggeli C, Pissimissis N, Lembessis P, Zografos GN, Koutsilieris M. Anticancer Res. 2008;28:3945–3960. [PubMed] [Google Scholar]
- 9.Wong IHN. Oncol Rep. 2003;10:229–235. [PubMed] [Google Scholar]
- 10.Arrazubi V, Uriz M, Antelo M, Herrera J, Tarifa A, Zazpe C, Gomez M, Illarramendi J, Lainez N, Vera R. Ann Oncol. 2010;21:80–80. [Google Scholar]
- 11.Cristofanilli M, Braun S. JAMA, J Am Med Assoc. 2010;303:1092–1093. doi: 10.1001/jama.2010.292. [DOI] [PubMed] [Google Scholar]
- 12.Jiao LR, Szydlo R, Habib NA, Coombes RC, Stebbing J. J Clin Oncol. 2010;28:E290–E290. doi: 10.1200/JCO.2009.24.5837. [DOI] [PubMed] [Google Scholar]
- 13.Konigsberg R, Gneist M, Jahn-Kuch D, Pfeiler G, Hager G, Hudec M, Dittrich C, Zeillinger R. Cancer Lett. 2010;293:117–123. doi: 10.1016/j.canlet.2010.01.003. [DOI] [PubMed] [Google Scholar]
- 14.Lalmahomed ZS, Kraan J, Gratama JW, Mostert B, Sleijfer S, Verhoef C. J Clin Oncol. 2010;28:E288–E289. doi: 10.1200/JCO.2010.28.2764. [DOI] [PubMed] [Google Scholar]
- 15.Li Q. Cytometry Part A. 2010;77A:211–212. doi: 10.1002/cyto.a.20842. [DOI] [PubMed] [Google Scholar]
- 16.Maheswaran S, Haber DA. Curr Opin Genet Dev. 2010;20:96–99. doi: 10.1016/j.gde.2009.12.002. [DOI] [PMC free article] [PubMed] [Google Scholar]
- 17.Negin BP, Cohen SJ. Curr Treat Options Oncol. 2010;11:1–13. doi: 10.1007/s11864-010-0115-3. [DOI] [PubMed] [Google Scholar]
- 18.Nelson NJ. J Natl Cancer Inst. 2010;102:146–U11. doi: 10.1093/jnci/djq016. [DOI] [PubMed] [Google Scholar]
- 19.Punnoose EA, Atwal SK, Spoerke JM, Savage H, Pandita A, Yeh RF, Pirzkall A, Fine BM, Amler LC, Chen DS, Lackner MR. PLoS ONE. 2010;5(9) doi: 10.1371/journal.pone.0012517. [DOI] [PMC free article] [PubMed] [Google Scholar]
- 20.Rahbari NN, Aigner M, Thorlund K, Mollberg N, Motschall E, Jensen K, Diener MK, Buchler MW, Koch M, Weitz J. Gastroenterology. 2010;138:1714–U20. doi: 10.1053/j.gastro.2010.01.008. [DOI] [PubMed] [Google Scholar]
- 21.Raimondi C, Naso G, Gradilone A, Gianni W, Cortesi E, Gazzaniga P. Curr Cancer Drug Targets. 2010;10:509–518. doi: 10.2174/156800910791517163. [DOI] [PubMed] [Google Scholar]
- 22.Sieuwerts AM, Kraan J, Bolt J, van der Spoel P, Elstrodt F, Schutte M, Martens JWM, Gratama JW, Sleijfer S, Foekens JA. J Natl Cancer Inst. 2009;101:61–66. doi: 10.1093/jnci/djn419. [DOI] [PMC free article] [PubMed] [Google Scholar]
- 23.Mostert B, Kraan J, de Vries JB, van der Spoel P, Sieuwerts AM, Schutte M, Timmermans AM, Foekens R, Martens JWM, Gratama JW, Foekens JA, Sleijfer S. Breast Cancer Res Treat. 2011;127:33–41. doi: 10.1007/s10549-010-0879-y. [DOI] [PubMed] [Google Scholar]
- 24.Kuo JS, Zhao Y, Schiro PG, Ng L, Lim DSW, Shelby JP, Chiu DT. Lab Chip. 2010;10:837–842. doi: 10.1039/b922301k. [DOI] [PubMed] [Google Scholar]
- 25.Lin YG, Merritt WM, Spannuth WA, Nick AM, Stone RL, Tsinberg P, Coleman RL, Birrer MJ, Bischoff F, Sood AK. Gynecol Oncol. 2009;112:230. [Google Scholar]
- 26.Maheswaran S, Sequist LV, Nagrath S, Ulkus L, Brannigan B, Collura CV, Inserra E, Diederichs S, Lafrate AJ, Bell DW, Digumarthy S, Muzikansky A, Irimia D, Settleman J, Tompkins RG, Lynch TJ, Toner M, Haber DA. N Engl J Med. 2008;359:366–377. doi: 10.1056/NEJMoa0800668. [DOI] [PMC free article] [PubMed] [Google Scholar]
- 27.Xu Y, Phillips JA, Yan JL, Li QG, Fan ZH, Tan WH. Anal Chem. 2009;81:7436–7442. doi: 10.1021/ac9012072. [DOI] [PMC free article] [PubMed] [Google Scholar]
- 28.Adams AA, Okagbare PI, Feng J, Hupert ML, Patterson D, Goettert J, McCarley RL, Nikitopoulos D, Murphy MC, Soper SA. J Am Chem Soc. 2008;130:8633–8641. doi: 10.1021/ja8015022. [DOI] [PMC free article] [PubMed] [Google Scholar]
- 29.Nagrath S, Sequist LV, Maheswaran S, Bell DW, Irimia D, Ulkus L, Smith MR, Kwak EL, Digumarthy S, Muzikansky A, Ryan P, Balis UJ, Tompkins RG, Haber DA, Toner M. Nature. 2007;450:1235–1239. doi: 10.1038/nature06385. [DOI] [PMC free article] [PubMed] [Google Scholar]
- 30.Tan SJ, Yobas L, Lee GYH, Ong CN, Lim CT. Biomed Microdevices. 2009;11:883–892. doi: 10.1007/s10544-009-9305-9. [DOI] [PubMed] [Google Scholar]
- 31.Williams A, Balic M, Datar R, Cote R. Size-Based Enrichment Technologies for CTC Detection and Characterization. In: Ignatiadis M, Sotiriou C, Pantel K, editors. Minimal Residual Disease and Circulating Tumor Cells in Breast Cancer. Vol. 195. Springer; Berlin Heidelberg: 2012. pp. 87–95. [DOI] [PubMed] [Google Scholar]
- 32.Dharmasiri U, Balamurugan S, Adams AA, Okagbare PI, Obubuafo A, Soper SA. Electrophoresis. 2009;30:3289–3300. doi: 10.1002/elps.200900141. [DOI] [PMC free article] [PubMed] [Google Scholar]
- 33.Dharmasiri U, Njoroge SK, Witek MA, Adebiyi MG, Kamande JW, Hupert ML, Barany F, Soper SA. Anal Chem. 2011;83:2301–2309. doi: 10.1021/ac103172y. [DOI] [PMC free article] [PubMed] [Google Scholar]
- 34.Saliba AE, Saias L, Psychari E, Minc N, Simon D, Bidard FC, Mathiot C, Pierga JY, Fraisier V, Salamero J, Saada V, Farace F, Vielh P, Malaquin L, Viovy JL. Proc Natl Acad Sci U S A. 2010;107:14524–14529. doi: 10.1073/pnas.1001515107. [DOI] [PMC free article] [PubMed] [Google Scholar]
- 35.Stott SL, Hsu CH, Tsukrov DI, Yu M, Miyamoto DT, Waltman BA, Rothenberg SM, Shah AM, Smas ME, Korir GK, Floyd FP, Gilman AJ, Lord JB, Winokur D, Springer S, Irimia D, Nagrath S, Sequist LV, Lee RJ, Isselbacher KJ, Maheswaran S, Haber DA, Toner M. Proc Natl Acad Sci U S A. 2010;107:18392–18397. doi: 10.1073/pnas.1012539107. [DOI] [PMC free article] [PubMed] [Google Scholar]
- 36.Wang S, Liu K, Liu J, Yu ZTF, Xu X, Zhao L, Lee T, Lee EK, Reiss J, Lee YK, Chung LWK, Huang J, Rettig M, Seligson D, Duraiswamy KN, Shen CKF, Tseng HR. Angew Chem, Int Ed. 2011;50:3084–3088. doi: 10.1002/anie.201005853. [DOI] [PMC free article] [PubMed] [Google Scholar]
- 37.Riker A, Libutti SK, Bartlett DL. Surg Oncol. 1997;6:157–169. doi: 10.1016/s0960-7404(97)00025-x. [DOI] [PubMed] [Google Scholar]
- 38.Hariharan D, Saied A, Kocher HM. HPB. 2008;10:58–62. doi: 10.1080/13651820701883148. [DOI] [PMC free article] [PubMed] [Google Scholar]
- 39.Hezel AF, Kimmelman AC, Stanger BZ, Bardeesy N, DePinho RA. Genes Dev. 2006;20:1218–1249. doi: 10.1101/gad.1415606. [DOI] [PubMed] [Google Scholar]
- 40.Grasso D, Garcia MN, Iovanna JL. Int J Cell Biol. 2012;2012:760498. doi: 10.1155/2012/760498. [DOI] [PMC free article] [PubMed] [Google Scholar]
- 41.Cristofanilli M, Budd GT, Ellis MJ. N Engl J Med. 2004;351:781–791. doi: 10.1056/NEJMoa040766. [DOI] [PubMed] [Google Scholar]
- 42.Hayes DF, Smerage J. Clin Cancer Res. 2008;14:3646–3650. doi: 10.1158/1078-0432.CCR-07-4481. [DOI] [PubMed] [Google Scholar]
- 43.Hupert M, Guy WJ, Llopis S, Shadpour H, Rani S, Nikitopoulos D, Soper S. Microfluid Nanofluid. 2007;3:1–11. [Google Scholar]
- 44.Wei SY, Vaidya B, Patel AB, Soper SA, McCarley RL. J Phys Chem B. 2005;109:16988–16996. doi: 10.1021/jp051550s. [DOI] [PubMed] [Google Scholar]
- 45.McCarley RL, Vaidya B, Wei S, Smith AF, Patel AB, Feng J, Murphy MC, Soper SA. J Am Chem Soc. 2004;127:842–843. doi: 10.1021/ja0454135. [DOI] [PubMed] [Google Scholar]
- 46.Jackson JM, Witek MA, Hupert ML, Brady C, Yeh JJ, Soper SA. Lab Chip. 2013 doi: 10.1039/C3LC50618E. [DOI] [Google Scholar]
- 47.Kotz KT, Xiao W, Miller-Graziano C, Qian WJ, Russom A, Warner EA, Moldawer LL, De A, Bankey PE, Petritis BO, Camp DG, Rosenbach AE, Goverman J, Fagan SP, Brownstein BH, Irimia D, Xu W, Wilhelmy J, Mindrinos MN, Smith RD, Davis RW, Tompkins RG, Toner M. Nat Med. 2010;16:1042–1047. doi: 10.1038/nm.2205. [DOI] [PMC free article] [PubMed] [Google Scholar]
- 48.Zhang W, Hu P, Lai X, Peng L. J Power Sources. 2009;194:931–940. [Google Scholar]
- 49.Shadpour H, Musyimi H, Chen JF, Soper SA. J Chromatogr A. 2006;1111:238–251. doi: 10.1016/j.chroma.2005.08.083. [DOI] [PubMed] [Google Scholar]
- 50.Kuo JS, Zhao Y, Schiro PG, Ng L, Lim DSW, Shelby JP, Chiu DT. Lab Chip. 2010;10:837–842. doi: 10.1039/b922301k. [DOI] [PubMed] [Google Scholar]
- 51.Méhes G, Witt A, Kubista E, Ambros PF. Am J Path. 2001;159:17–20. doi: 10.1016/S0002-9440(10)61667-7. [DOI] [PMC free article] [PubMed] [Google Scholar]
- 52.Glinsky GV. Crit Rev Oncol Hematol. 1997;25:175–186. doi: 10.1016/s1040-8428(97)00234-5. [DOI] [PubMed] [Google Scholar]
- 53.Larson CJ, Moreno JG, Pienta KJ, Gross S, Repollet M, O’Hara SM, Russell T, Terstappen LWMM. Cytometry Part A. 2004;62A:46–53. doi: 10.1002/cyto.a.20073. [DOI] [PubMed] [Google Scholar]
- 54.Christiansen JJ, Rajasekaran AK. Cancer Res. 2006;66:8319–8326. doi: 10.1158/0008-5472.CAN-06-0410. [DOI] [PubMed] [Google Scholar]
- 55.Wang H, Chen HW, Hupert ML, Chen PC, Datta P, Pittman TL, Goettert J, Murphy MC, Williams D, Barany F, Soper SA. Angew Chem Int Ed. 2012;51:4349–4353. doi: 10.1002/anie.201200732. [DOI] [PMC free article] [PubMed] [Google Scholar]
Associated Data
This section collects any data citations, data availability statements, or supplementary materials included in this article.