

Abstract
The lysine acetyltransferase (KAT) Rtt109 forms a complex with Vps75 and catalyzes the acetylation of histone H3 lysine 56 (H3K56ac) in the Asf1-H3-H4 complex. Rtt109 and H3K56ac are vital for replication-coupled nucleosome assembly and genotoxic resistance in yeast and pathogenic fungal species such as Candida albicans. Remarkably, sequence homologs of Rtt109 are absent in humans. Therefore, inhibitors of Rtt109 are hypothesized as potential and minimally toxic antifungal agents. Herein, we report the development and optimization of a cell-free fluorometric high-throughput screen (HTS) for small-molecule inhibitors of Rtt109-catalyzed histone acetylation. The KAT component of the assay consists of the yeast Rtt109-Vps75 complex, while the histone substrate complex consists of full-length Drosophila histone H3-H4 bound to yeast Asf1. Duplicated assay runs of the LOPAC demonstrated day-to-day and plate-to-plate reproducibility. Approximately 225,000 compounds were assayed in a 384-well plate format with an average Z' factor of 0.71. Based on a 3σ cut-off criterion, 1,587 actives (0.7%) were identified in the primary screen. The assay method is capable of identifying previously reported KAT inhibitors such as garcinol. We also observed several prominent active classes of pan-assay interference compounds such as Mannich bases, catechols and p-hydroxyarylsulfonamides. The majority of the primary active compounds showed assay signal interference, though most assay artifacts can be efficiently removed by a series of straightforward counter-screens and orthogonal assays. Post-HTS triage demonstrated a comparatively small number of confirmed actives with IC50 values in the low micromolar range. This assay, which utilizes five label-free proteins involved in H3K56 acetylation in vivo, can in principle identify compounds that inhibit Rtt109-catalyzed H3K56 acetylation via different mechanisms. Compounds discovered via this assay or adaptations thereof could serve as chemical probes or leads for a new class of antifungals targeting an epigenetic enzyme.
Introduction
Eukaryotic DNA is assembled into chromatin, the repeating structure of which is known as the nucleosome. Chromatin encodes epigenetic information and is important in regulating gene transcription, DNA repair and replication. Chromatin is subject to regulation by post-translational modifications such as methylation, acetylation, phosphorylation and ubiquitylation of histones, which are the protein structural component of the nucleosome. Histone acetylation can alter chromatin structure and also recruit additional protein machinery involved in chromatin regulation [1], [2]. Histone acetylation is catalyzed by lysine acetyltransferases (KATs), which catalyze the transfer of an acetyl group from acetyl-CoA to ε-amino groups on specific histone lysine residues. One specific and atypical modification first discovered in Saccharomyces cerevisiae, histone H3 lysine 56 acetylation (H3K56ac), occurs during the S phase of the cell cycle and is catalyzed by the KAT protein Rtt109 [3]–[6]. Rtt109-catalyzed H3 acetylation promotes genotoxin survival due in part to its role in DNA synthesis-dependent nucleosome assembly associated with DNA replication and DNA repair [5]–[8]. In humans, H3K56ac is catalyzed by p300/CBP or GCN5 [9], [10], of which the catalytic motif of p300 shares tertiary structural similarity with Rtt109 despite possessing little primary sequence homology [11], [12].
The catalytic activity of Rtt109 is subject to complex regulation. In the absence of autoacetylation [13], [14] or the chaperone proteins Asf1 or Vps75, S. cerevisiae Rtt109 (scRtt109) has lower KAT activity [4], [6], [15], [16]. Vps75 is a member of the NAP1 histone chaperone family and forms a stable complex with Rtt109 in vivo and in vitro. While the Rtt109-Vps75 complex is capable of acetylating H3K56, Vps75 is not essential for H3K56 acetylation in vivo [4], [17]–[20]. Vps75 also enhances Rtt109-catalyzed acetylation of H3K4, H3K9, H3K14, H3K18, H3K23 and H3K27 in vitro [20]–[23]. In vivo, the histone chaperone Asf1 is also essential for H3K56ac, and it dramatically enhances the activity of the Rtt109-Vps75 complex towards H3K56ac. However, it remains to be determined whether Asf1 is also required for Rtt109-catalyzed acetylation of lysine residues at the H3 N-terminus in vivo. Nonetheless, it is likely that Rtt109-Vps75 utilizes Asf1-H3-H4 as the substrate in vivo for at least H3K56 acetylation.
Opportunistic fungal infections can severely compromise the therapeutic outcome of cancer patients, organ transplant patients and other immunocompromised patients. The crude mortality rate from opportunistic fungal infection exceeds 50% in many human studies [24]–[26]. Fungi are difficult to treat therapeutically because of several factors. First, fungi are eukaryotes, and many of their biologically crucial genes are also conserved in humans. Therefore, it has proven difficult to find fungi-specific therapeutic targets that minimize toxicity to humans [27]. Second, fungi can develop resistance to most drugs currently used to treat patients [28]. Third, early detection and diagnosis of fungal infections can be difficult in clinical settings [29], [30]. Finally, fungal pathogenesis is governed by complicated host-pathogen interactions [31], [32]. Therefore, there is a clinical need for novel and efficacious antifungal treatments.
Inhibiting Rtt109-catalyzed histone acetylation may be clinically relevant for antifungal purposes. While Rtt109 is highly conserved in fungal species, it exhibits no obvious sequence homology to mammalian KATs. Additionally, it appears that Rtt109 utilizes a different catalytic mechanism than p300/CBP [33], the potential functional homolog of Rtt109. Inhibitors of p300 such as Lys-CoA have not shown activity versus Rtt109 [11]. Furthermore, others have shown that deletion of rtt109 in Candida albicans reduces fungal virulence in mouse models [34], [35]. Our group has also shown Pneumocystis carinii expresses an active Rtt109 KAT [36], [37]. These results support the idea that Rtt109 is an attractive antifungal therapeutic target and that compounds that inhibit Rtt109-catalyzed histone acetylation may serve as potential antifungal agents. To date, only one small-molecule has been reported to inhibit Rtt109-catalyzed histone acetylation but not other KATs like GCN5 and p300. This particular molecule did not affect cellular levels of H3K56ac or sensitivity to a genotoxic agent in either C. albicans or S. cerevisiae [38], but this lack of observed in vivo activity could be due to a variety of factors such as drug metabolism, cell permeability or degradation. Therefore, methods must still be developed and optimized to identify compounds capable of inhibiting Rtt109-catalyzed histone acetylation, both in vitro and in vivo.
In this work, we report the development and optimization of a high-throughput screen (HTS) for small-molecule inhibitors of Rtt109-catalyzed histone acetylation using the well-characterized S. cerevisiae Rtt109–Vps75-Asf1 proteins. The assay quantifies the amount of free coenzyme A (CoA), a by-product of the Rtt109-catalyzed KAT reaction, by use of the thiol-sensitive probe 7-diethylamino-3-(4′-maleimidyl-phenyl)-4-methylcoumarin (CPM) [39], and is an adaption of previous CPM-based assays [40]–[43]. Importantly, our assays take into account the complex regulation of Rtt109 in vitro and in vivo by using purified Rtt109-Vps75 as the enzyme and Asf1 bound to full-length H3-H4 as the substrate. Given the susceptibility of this assay format to false-positives, appropriate follow-up assays and consideration of assay-specific artifacts and promiscuous inhibitors are also discussed herein.
Materials and Methods
Molecular libraries, compounds and reagents
The chemical library consisted of a 100,000-compound library (ChemBridge), the 1,280-member Library of Pharmacologically Active Compounds (LOPAC; Sigma-Aldrich), 100,000 compounds acquired from the University of Kansas High-Throughput Screening Laboratory [44], focused natural product libraries and also 6,700 peptide and peptidomimetic compounds. Additional compounds were obtained from the MicroSource Spectrum Collection (Discovery Systems), the Prestwick Chemical collection, the NIH Clinical Collection, Tocris chemical standard libraries (Tocris Bioscience), in-house and miscellaneous commercial compounds.
The following chemicals and reagents were obtained from Sigma: DMSO, CPM, coenzyme A (sodium salt hydrate), acetyl-CoA (sodium salt), aurintricarboxylic acid (ATA), Triton X-100, L-glutathione, fluconazole, lidocaine, rottlerin, NSC-663284, Horseradish peroxidase and phenol red. The following compounds were also obtained commercially: 4-amino-1-naphthol (TCI America) and nitrocefin (TOKU-E). Garcinol (Enzo Life Sciences) was purchased and used without additional purification. Compound 1 and the compounds evaluated for IC50 values were obtained from commercial sources and tested without additional purification. Garcinol and compound 1 showed greater than 98% purity by UPLC/MS analyses. The 1H and 13C NMR spectra for garcinol and compound 1 were consistent with their reported chemical structures. The 1H NMR (400 MHz) and 13C NMR (100 MHz) spectra were recorded on a Bruker Avance spectrometer, while the UPLC/MS analyses were performed using a Waters Acquity UPLC with ZQ mass spectrometer.
Protein production and purification
Drosophila H3-H4 (dH3-H4) was obtained as previously described [45]. Purified S. cerevisiae Asf1 was incubated with approximately equal molar amounts of purified dH3-H4 overnight at 4°C, and the resulting Asf1-dH3-H4 complex was then purified by gel filtration chromatography in the absence of dithiothreitol (DTT) [16], as DTT interferes with the CPM thiol probe. The S. cerevisiae Rtt109-Vps75 complex was prepared as previously described, except that residual DTT was removed through gel filtration in the final purification step [46]. Protein concentrations were determined by the Bradford method [47]. Purified protein complexes were stored at −80°C in their appropriate buffered solutions plus 10% glycerol (v/v) until the day of use.
High-throughput screen in 384-well plate format
A standardized description of each assay step is provided (Tables 1 and 2) [48]. Briefly, test compounds and the control inhibitor ATA were first added to the appropriate wells using an Echo 550 contactless liquid handler (Labcyte). Test compounds were prepared as 10 mM stock solutions dissolved in DMSO, stored at −20°C under vacuum seals and screened at 10 µM final compound concentrations. Buffer, purified Rtt109-Vps75 and purified Asf1-dH3-H4 substrate were added in sequential dispensing steps. Compounds and proteins were then allowed to incubate for 15 min at 30°C to allow for equilibration. The KAT reaction was then initiated by dispensing 10 µL acetyl-CoA to appropriate wells to yield a final reaction concentration of 10 µM acetyl-CoA and 15 µL total solution volume per well. Each tested microplate had negative control wells (acetyl-CoA+DMSO) and positive control wells (Rtt109-Vps75+Asf1-dH3-H4+acetyl-CoA+DMSO), as well as compound control wells (Rtt109-Vps75+Asf1-dH3-H4+acetyl-CoA+10 µM ATA). Plates were sealed using a PlateLoc apparatus (Agilent). The reactions were allowed to proceed for up to 45 min at 30°C. The extent of CoA production was then assessed by dispensing 5 µL of an 80 µM CPM solution to each well, yielding a final CPM concentration of 20 µM. After a short incubation period, microplates were read on a fluorescent plate reader. For the second HTS production run (HTS2), the buffers also contained freshly prepared 0.01% Triton X-100 (v/v) [49].
Table 1. Rtt109-Vps75 HTS protocol steps.
| Step | Parameter | Value | Description |
| 1 | Compound controls, DMSO | 15 nL | ATA to wells A1-H1 and I23-P23; DMSO to wells I1-P1, A23-H23 and columns 2 and 24 |
| 2 | Test compounds | 15 nL | Compounds to wells A3-P22 |
| 3 | Buffer | 5 µL | KAT buffer to columns 2 and 24 |
| 4 | Enzyme complex | 2.5 µL | Rtt109-Vps75 to columns 1 and 3–23 |
| 5 | Protein substrate | 2.5 µL | Asf1-dH3-H4 to columns 1 and 3–23 |
| 6 | Incubation time | 15 min | 30°C |
| 7 | Acetyl-CoA | 10 µL | Acetyl-CoA to all wells; final well volume = 15 µL |
| 8 | Plate shake time | 5 min | Mix well contents |
| 9 | Incubation time | 45 min | 30°C |
| 10 | CPM probe | 5 µL | CPM to all wells; final well volume = 20 µL |
| 11 | Plate shake time | 1 min | Mix plate contents |
| 12 | Assay readout | 405 and 530 nm | Measure fluorescence intensity (λex, λem, respectively) |
Table 2. Rtt109-Vps75 HTS protocol notes.
| Step | Notes |
| 1 | ATA (10 mM DMSO stock solution, freshly prepared), 10 µM final reaction concentration; transfer to assay plates with Echo 550 contactless liquid handler |
| 2 | Compounds (10 mM DMSO stock solutions), 10 µM final reaction concentration; transfer to plates with Echo 550 |
| 3 | KAT buffer (50 mM Tris-HCl, pH 8.0, 50 mM KCl, 0.1 mM EDTA, ±0.01% Triton X-100 (v/v)); transfer to plates using Thermo MultiDrop; Corning 384-well black polystyrene, low-volume, non-treated microplates (model #3677) |
| 4 | 200 ng Rtt109-Vps75 complex per well (80 ng/µL dispensing solution, dissolved in KAT buffer); transfer to plates with MultiDrop |
| 5 | 800 ng Asf1-dH3-H4 complex per well (320 ng/µL dispensing solution, dissolved in KAT buffer); transfer to plates with MultiDrop |
| 7 | Acetyl-CoA (freshly prepared; 10 mM H2O stock solution dissolved in KAT buffer to make 15 µM dispensing solution); 10 µM final reaction concentration; transfer to plates with MultiDrop |
| 8 | DPC micromix shaker |
| 9 | Seal plate with PlateLoc |
| 10 | Briefly centrifuge and then unseal plates; CPM (freshly prepared 50 mM DMSO stock solution, then diluted with 1∶1 EtOH∶H2O (v/v) to make 80 µM dispensing solution); final concentration will be 20 µM; transfer to plates with MultiDrop |
| 11 | Micromix shaker; then allow 10 min at room temperature for reaction to complete |
| 12 | SpectraMax M2E plate reader (Molecular Devices) |
Dose-response and IC50 experiments
Compounds selected for dose-response analyses were tested in duplicate at eight compound concentrations, ranging from 40 nM to 125 µM final compound concentrations. Plate controls, dispensing steps and general assay procedures were unchanged from the aforementioned HTS procedures. Slot blots were performed using standard techniques with a Bio-Rad Bio-Dot SF microfiltration apparatus. Membranes were imaged with a LI-COR Odyssey and analyzed using Image Studio (LI-COR Biosciences). For the slot blot experiments, the assay plates included an additional plate control consisting of the Rtt109-Vps75 and Asf1-dH3-H4 complexes and no acetyl-CoA. Dose-response and slot blot experiments were replicated at least three times by independent experiments. IC50 values on purchased samples were determined as described above, except compounds were tested in triplicate at twelve compound concentrations, ranging from 40 nM to 250 µM final compound concentrations.
Data analysis
Z' factors for each plate were calculated in ActivityBase (IDBS) using Equation (1) [50]:
| (1) |
where σ and μ represent the standard deviation and mean of the positive (c+) and negative (c−) -plate controls, respectively. Plates with Z' factors below 0.4 were re-screened. The percent inhibitions of test compounds were calculated based on the positive and negative controls on each plate using ActivityBase. Dose-response curves were generated in GraphPad Prism 6.0 using the sigmoidal dose-response variable slope four-parameter Equation (2):
| (2) |
Lines of best fit were determined by linear regression in Prism. Unless noted otherwise, standard deviations are indicated after mean values and depicted as error bars.
Cheminformatics
Pan-assay interference compounds (PAINS) were identified by substructure query [51] using SYBYL-X (Tripos) on a Linux workstation. The computational triage of primary HTS active compounds was also performed in the SYBYL-X workspace using the built-in HTS filter and custom substructure filters.
Fluorescence quenching counter-screen
CPM and CoA (20 and 5 µM final concentrations, respectively) were allowed to react to completion in HTS buffer, as assessed by reading the fluorescence intensity at 5 min intervals until a stable signal plateau was observed. The resulting CPM-CoA adduct solutions were then spiked with either DMSO or test compounds using a contactless liquid dispenser. The microplates were shaken for 5 min and allowed to equilibrate for another 5 min at room temperature. The fluorescence intensity was then measured, and the data was analyzed as percent signal reduction compared to DMSO controls.
Assay interference counter-screen
Compounds interfering with the CPM-based assay readout were identified using an adaption of published procedures [41], [52]. Selected compounds were tested in duplicate at 10 and 20 µM final concentrations using the HTS assay format, except proteins were absent and the acetyl-CoA substrate was replaced with the CoA by-product in concentrations that were titred to the fluorescence intensity observed at approximately zero and 50% inhibition. Compounds were incubated with CoA under conditions identical to the HTS, after which CPM was added as described previously. Assay interference was quantified by comparing the (compound+CoA+CPM) fluorescence intensities to the (DMSO+CoA+CPM) controls. All plates contained background controls (DMSO+CoA) and (DMSO+CPM). Triage criteria included a combination of significant signal interference (generally greater than 50% control) in at least one tested condition, interference reproducibility, and evidence of CoA- and/or compound-dependent interference.
Compound-thiol adduct assay
High micromolar concentrations of selected compounds (1 equiv) and either CoA or L-glutathione (1–4 equiv) were incubated under HTS-like conditions. Detergent was excluded from the sample buffers. CPM was used as a positive adduct control, as well as several in-house compounds that form known thiol adducts by several different chemical mechanisms under the HTS conditions. The samples were analyzed on a Waters UPLC system using a BEH C18 2.1×50 mm column. The flow rate was 0.25 mL/min with a standard gradient starting at 95% Solution A (950 mL H2O, 50 mL MeCN, 1 mL formic acid) and ending with 100% Solution B (1000 mL MeCN, 1 mL formic acid) over 6.5 min. The samples were monitored simultaneously using an ELS detector, a diode array detector (214, 220, 244 and 254 nm) and a ZQ mass spectrometer (ESI positive and negative modes).
Redox-activity and aggregation triage
Selected compounds were de-risked for redox-activity using a published protocol [53] except that the published assay buffer was swapped for the Rtt109 HTS assay buffer. 100 µM H2O2 was used as a positive plate control, while NSC-663284 and 4-amino-1-naphthol were used as positive redox-active controls for DTT and DTT-free assay conditions, respectively [53], [54]. Fluconazole and DMSO were used as negative compound and plate controls, respectively. Compounds were tested in duplicate at eight final concentrations (1.25 to 160 µM via two-fold dilutions) in either the presence or absence of 1 mM DTT final concentration. Selected compounds were also de-risked for aggregation behavior using published procedures [55], except that the published assay buffer was again swapped for the HTS buffer. Rotterlin and lidocaine were used as a positive and negative compound controls, respectively [56]. Compounds were tested at 10 µM final concentrations in either the presence or absence of 0.01% Triton X-100.
[3H]-acetyl CoA orthogonal assay
Selected compounds were tested for inhibition of KAT activity using an alternative in vitro orthogonal assay employing [3H]-acetyl-CoA. Inhibition of KAT activity was measured at up to ten compound concentrations (40 nM to 250 µM final compound concentrations) as previously reported [57], with some minor modifications. Briefly, reactions were performed in 60 µL volumes containing the following in final concentrations: 50 mM Tris HCl, pH 8.0, 50 mM KCl, 0.1 mM EDTA, 1 mM DTT, 0.01% Triton X-100 (v/v) and 2.5 µM [3H]-acetyl-CoA (Perkin Elmer). Purified Rtt109-Vps75 was tested at approximately 5 nM final concentrations, while purified Asf1-dH3-H4 (approximately 250 nM) was used as acetylation substrate. Test compounds were allowed to pre-equilibrate with enzyme and histone substrate for 10 min at 30°C before initiating the KAT reaction with the addition of [3H]-acetyl-CoA. DMSO content was kept constant at 3% (v/v). The KAT reactions were allowed to proceed for 5 min, after which aliquots (20 µL) were immediately spotted onto Whatman phosphocellulose paper filters (GE Healthcare) and air-dried. Filter papers were washed five times for 5 min per cycle with 50 mM NaHCO3, pH 9.0, and rinsed with acetone and then allowed to air-dry for 30 min. [3H]-acetate incorporation was then measured by an LS6500 liquid scintillation counter (Beckman-Coulter). Percent inhibition was calculated as a percentage of DMSO control.
Results
HTS development and optimization
We developed a cell-free 384-well plate assay for Rtt109-catalyzed histone acetylation based on previously reported assays probing for the presence of CoA [40], [41]. The purified Rtt109-Vps75 complex catalyzes the transfer of an acetyl group from acetyl-CoA to the ε-amino group on specific lysine residues on histone H3, which is part of the substrate complex consisting of purified full-length histone H3-H4 tetramers bound to the chaperone protein Asf1. The byproduct of this reaction, free coenzyme A (represented as either CoA or CoA-SH to denote the free thiol group), accumulates with increasing KAT activity. At the assay endpoint, CoA is quantified by the addition of CPM, which readily reacts with available CoA-SH to produce a fluorescent thioester adduct through a Michael addition with the maleimide moiety on CPM (Figure 1).
Figure 1. Fluorometric Rtt109-Vps75 HTS schematic.
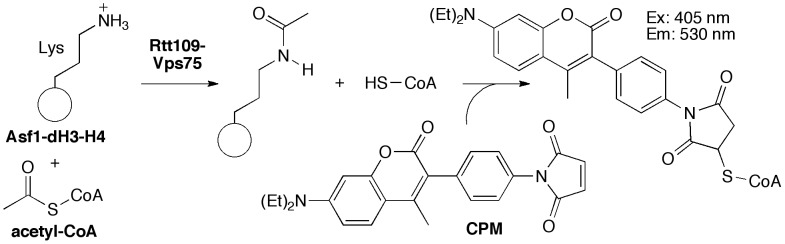
The Rtt109-Vps75 KAT complex catalyzes the transfer of an acetyl group from acetyl-CoA to specific histone lysine residues within the Asf1-dH3-H4 substrate complex. The resulting CoA contains a free thiol group (-SH), which can react with the sulfhydryl-sensitive probe CPM to form a fluorescent adduct, thereby permitting the quantification of free CoA as a measure of KAT activity.
Several experiments were performed to optimize the reaction conditions for an HTS-compatible format. Rtt109 is a complicated bi-substrate enzymatic system [33], which inevitably poses more challenges with regards to assay optimization than a mono-substrate system [58]. As was done in a previous screen for histone acetyltransferases [59], we chose 10 µM as the amount of acetyl-CoA, which is close to a previous report of the apparent Michaelis-Menten constant for Rtt109-Vps75 (8 µM) [11]. Titrations of the Rtt109-Vps75 and Asf1-dH3-H4 complexes were performed to determine the optimal amounts of each protein complex per well. To maximize signal intensity and yet minimize the amount of protein complexes needed for a large-scale HTS, 200 ng Rtt109-Vps75 (approximately 120 nM) and 800 ng Asf1-dH3-H4 (approximately 920 nM) per well were chosen as protein concentrations (data not shown). Next, the optimal balance of CPM and acetyl-CoA were determined in order to achieve a sufficient signal∶background ratio. Based on this titration matrix, subsequent experiments used CPM and acetyl-CoA in final concentrations of 20 and 10 µM, respectively (Figure 2A). We also confirmed that acetyl-CoA did not produce appreciable fluorescent signals in the presence of CPM in our assay conditions (Figure 2B). The reaction between 20 µM CPM and CoA titrations was relatively rapid, as indicated by the signal plateau by 10 min reaction time (Figure 2C). This finding is consistent with a recent report on the reaction kinetics of CPM [60] and therefore subsequent experiments allowed CPM to react for up to 10 min before data acquisition. A low-volume microplate allowed a more intense signal and a moderately improved signal∶background ratio compared to a standard-volume microplate using identical reaction volumes and components (data not shown). We also verified by time-course monitoring that the KAT reaction was not complete at the assay endpoint (data not shown) [58]. The 384-well plate layout includes positive control wells with no compounds present, negative control wells with no proteins present and also compound control wells with ATA (corresponding to 50% signal reduction at 10 µM final concentration) on the plate edges (Figure 2D). For each 384-well plate, 320 compounds were tested at a single concentration.
Figure 2. Assay design and optimization.

(A) Titration matrix of CoA and CPM in buffer-only conditions to determine the optimal assay levels of acetyl-CoA and CPM. (B) Titration matrix of CPM and acetyl-CoA in buffer-only conditions to verify acetyl-CoA and CPM do not form fluorescent adducts under HTS conditions. (C) Time-course study of CoA titrations with 20 µM CPM in buffer-only conditions to determine the optimal time for the reaction involving CoA and CPM. (D) HTS plate template. Arrows denote chosen HTS conditions.
Division of HTS into two production runs
The optimized assay screened 225,703 compounds in two separate, non-overlapping production runs, hereby referred to as HTS1 and HTS2. The first production run (HTS1) was performed with a detergent-free buffer. After screening approximately one-third of the chemical library, the number of compounds showing apparent inhibition combined with a preliminary analysis of the chemical nature of the active compounds suggested some chemical aggregators were also being identified as actives in the primary assay [61], [62]. Based on these observations, the second production run (HTS2) included 0.01% Triton X-100 to reduce the odds of identifying additional non-specific chemical aggregators [56], [62]–[64]. Inclusion of the detergent did not adversely affect enzyme performance (data not shown). The 82,861 compounds screened in HTS1 under detergent-free conditions were not re-screened in the presence of detergent, as we opted instead to analyze the two production runs separately and perform future follow-up experiments of HTS1 compounds in the presence of detergent-containing buffers.
Assay evaluation using the LOPAC
Assay quality was evaluated using the LOPAC prior to initiating both HTS1 and HTS2. For both the first and second production runs, the LOPAC plate Z' factors were consistently above the standard cut-off value of 0.5 (Figure 3A). Duplicate runs of the LOPAC on separate days gave reproducible results for both HTS production runs (Figures 3B and 3C and Figure S1). However, the averaged LOPAC results between the first and second production runs showed less than expected correlation (Figure 3D). We suspect this may be due to the addition of the detergent in HTS2, which may alter the inhibitory behavior of compounds based on their natural propensities to aggregate. Interestingly, there was a general decrease in the percent inhibition for the most active compounds when detergent was added. Both production runs had Gaussian-like distributions centering on zero percent inhibition (Figure 3E). Likewise, there were no prohibitive row or column effects during either LOPAC experiment (Figure S2). Heat maps of each LOPAC plate from HTS1 did not reveal any prohibitive systematic errors due to well position (Figure S2). The general reproducibility of independent LOPAC experiments and their lack of any egregious systematic errors therefore suggested a full-scale HTS could be performed with similar quality.
Figure 3. Assay validation using the LOPAC ± detergent.

(A) Z' factors for replicate LOPAC experiments ± detergent. (B–C) Comparison of duplicate runs of the LOPAC ± detergent. Each point represents the activity of a discrete compound from the LOPAC. (D) Comparison of the LOPAC results ± detergent. Percent inhibitions represent the means of the replicate LOPAC experiments. Trend line (solid, red), ideal correlation line (dashed, blue). (E) Percent inhibition distribution of the averaged LOPAC results ± detergent, binned in 5% intervals.
HTS of compound library
A total of 82,861 and 142,842 compounds were screened at 10 µM final concentrations for inhibition of Rtt109-catalyzed histone acetylation in two separate production runs, respectively. The average Z' factors for HTS1 and HTS2 were 0.65 and 0.73, respectively, demonstrating that by this metric, the assay had acceptable signal dynamic range, data variation and overall quality (Figure 4A and Table 3). Only ten plates (<2%) had to be re-screened because of unacceptably low Z' factors, but these plates yielded acceptable Z' factors upon rescreening. The inhibition distributions for the HTS1 and HTS2 compounds were both normal and were both centered about zero percent inhibition (Figure 4B and Table 3). HTS2, which contained detergent in the assay buffer, had a smaller standard deviation than HTS1 (Table 3). Despite having fewer compounds screened, HTS1 contained approximately twice the number of compounds showing inhibition at several arbitrary cut-offs (Table 4). The active compounds from the primary screen - defined as those compounds having greater than three standard deviations (3σ) above the mean percent inhibition - were relatively evenly distributed in HTS1 when analyzed by screening order (Figure 4C). HTS2, on the other hand, had several prominent active clusters, such as those at approximately the 200,000th and 220,000th compounds screened (Figure 4C). Based on the chemotypes of the compounds in these clusters and the excellent corresponding Z' factors, we attribute this observation to the library organization rather than systematic errors.
Figure 4. Rtt109-Vps75 HTS results.

(A) Z' factors for each HTS plate, arranged in order screened. (B) Percent inhibition distribution pattern of compounds screened, binned in 1% intervals (outliers not shown). Cumulative results are pooled from HTS1 and HTS2. (C) Percent inhibition of each compound arranged in order screened. (D) Heat map of each assayed compound, arranged by well position and assay plate in order screened. HTS1 spans plates 1–259 while HTS2 spans plates 260–715. Active compounds were calculated separately for HTS1 and HTS2. HTS1 = no detergent; HTS2 = detergent.
Table 3. Rtt109-Vps75 HTS summary.
| Assay | Compounds screened | Plates screened | Mean percent inhibition (%) | Mean Z' factor |
| HTS1 (no detergent) | 82,861 | 259 | 0.00±14 | 0.65±0.09 |
| HTS2 (detergent) | 142,842 | 456 | 0.03±9 | 0.73±0.09 |
| Cumulative (HTS1+HTS2) | 225,703 | 715 | 0.02±11 | 0.71±0.10 |
Table 4. Activity breakdown of Rtt109-Vps75 HTS.
| Number of compounds | |||
| Percent inhibition (%)a | HTS1 (no detergent) | HTS2 (detergent) | Cumulative |
| >95 | 113 | 46 | 159 |
| 90–95 | 24 | 17 | 41 |
| 75–90 | 89 | 39 | 128 |
| 50–75 | 287 | 149 | 436 |
| 40–50 | 238 | 148 | 386 |
| 30–40 | 575 | 302 | 877 |
| 3σb | 667 (0.80%) | 920 (0.64%) | 1587c (0.70%) |
= compounds tested at 10 µM final reaction concentrations;
= 3σ corresponds to 42.9 and 26.4 percent inhibition for HTS1 and HTS2, respectively;
= combined from the separate HTS1 and HTS2 analyses.
The HTS was also analyzed for plate position effects as part of standard quality controls. An assay heat map depicting the inhibition of each compound as a function of well position and plate order revealed a noticeable row effect for both HTS1 and HTS2, as percent inhibition generally decreased as a function of plate row (Figure 4D and Figure S3). This effect was consistent throughout most of the assay plates for both HTS1 and HTS2. Whole-HTS analysis of the mean percent inhibition as a function of well position showed a clear row effect. In general, the mean percent inhibition decreases from the top (row A) to the bottom (row P) of the plates, whereas no such effect was discernible for the plate columns (Figure S4). We speculate this effect may be due to the orientation of the plates in the oven during the reaction. The magnitude of this row effect is approximately one standard deviation of the mean HTS inhibition. Therefore, one of our rationales for choosing a 3σ activity cut-off was to attenuate the influence of this row effect when selecting active compounds. Indeed, the row effect was less apparent when analyzing for the position of active compounds (Figure S4). Generally speaking, the above observations held true when HTS1 and HTS2 were analyzed separately (Figures S5 and S6). We also observed a checkerboard pattern in the average percent inhibition as a function of well position, though this effect was most pronounced for HTS1 (Figures S4 and S5B). We speculate the observed checkerboard pattern is due to a combination of plate orientation and our instrumentation, specifically the microplate liquid dispensing system and the microplate reader. While not performed in this study, in the interests of improving potential adaptations of our screening method, we point out that alternative statistical options are available to account for systematic trends [65], [66], [67], [68]. This may be important, for instance, when mining the primary screening data for less efficacious but potentially potent inhibitors may require additional corrections for the row effect.
Dose-response of selected compounds
To further demonstrate that this HTS can identify compounds capable of inhibiting KAT activity in vitro, we first present garcinol as an active compound and a previously reported KAT inhibitor that can be identified our HTS assay methods and subjected it to additional dose-response testing in the presence of detergent. Garcinol is a reported inhibitor of p300 and PCAF with IC50 values of 7 and 5 µM, respectively [69], [70]. The exact mechanism of inhibition by garcinol is still unclear, and it is worth pointing out that garcinol contains an ortho-catechol group, which flags it as a PAINS because of its potential for assay interference, potentially via an ortho-quinone [51], [71], [72], redox-activity [73], [74] or an oxidative product [75]. Despite these liabilities for non-specific or therapeutically uninteresting inhibition, this compound was still chosen as proof-of-concept because other reported histone acetyltransferase inhibitors were either inactive against Rtt109 by multiple assay methods or displayed prohibitive levels of assay interference (data not shown). As a negative compound control, we included fluconazole, an antifungal that inhibits the fungal cytochrome P450 enzyme 14α-demethylase with no reported activity against KATs. Garcinol, but not fluconazole, showed modest activity against Rtt109-catalyzed histone acetylation in the CPM-based assay (IC50 = 13 µM, Figure 5A). To confirm that garcinol decreased Rtt109-catalyzed histone acetylation, reaction aliquots were analyzed for H3K56, H3K27 and H3K9 acetylation using an orthogonal antibody-based slot blot method. This method utilizes modification-specific antibodies to detect changes in the actual histone acetylation, rather than the CoA by-product. Consistent with the CPM-based assay, garcinol showed dose-dependent decreases in H3K56ac, H3K27ac and H3K9ac when analyzed via slot blots, while fluconazole did not show any measureable decrease in histone acetylation. Equal protein content was verified by Ponceau S staining (Figure 5B).
Figure 5. Example dose-response and orthogonal assays using garcinol, a previously reported KAT inhibitor.

(A) CPM-based assay dose-response experiments with garcinol. Fluconazole = negative control. (B) Orthogonal slot blot assay to detect the presence of H3K56ac, H3K27ac and H3K9ac by Western blot. Equal protein content was verified for each membrane by Ponceau S staining. (C) Dose-response experiments with garcinol using a secondary [3H]-acetyl-CoA-based orthogonal assay.
Additional studies were performed to link the HTS assay readout to the status of acetylated histones. Garcinol showed only modest fluorescence quenching at concentrations greater than its IC50 value (Figure S7). Second, garcinol did not show prohibitive levels of assay interference near its IC50 in a CoA-based counter-screen where the acetyl-CoA substrate is replaced with CoA (Figure S8). Additionally, no adducts between garcinol and either CoA or glutathione were detected by UPLC/MS analyses of reaction aliquots under HTS-like conditions. By contrast, this assay detected several known in-house compound-CoA and compound-glutathione adducts under identical conditions (data not shown). Garcinol also did not show detectable levels of H2O2 production in HTS-like conditions in either the presence or absence of DTT (Figure S9). Garcinol showed only modest inhibition of β-lactamase activity in detergent-free, HTS-like conditions, but no such inhibition was observed when detergent was present (Figure S9). These two results strongly suggest inhibition by garcinol in our assay setup is not through redox-activity or aggregation. We further confirmed the inhibition seen in the CPM-based method by a secondary orthogonal assay that measures the amount of [3H]-acetate incorporated onto histones from an [3H]-acetyl-CoA substrate (IC50 = 5 µM, Figure 5C).
Active pan-assay interference compounds
A growing concern in academic drug discovery and high-throughput screening is the proliferation of PAINS in the literature and patent applications [76]. Based on a series of published substructures of promiscuous compounds [51], we analyzed the active compounds from the primary screen for the presence and enrichment of PAINS using cheminformatics methods (Figure 6). For HTS1, the substructure filters flagged 3,319 out of the 82,861 tested compounds as PAINS (4%), while 9,568 out of 142,842 tested compounds were flagged for HTS2 (7%). Cumulatively, the HTS library for this screen consisted of 12,887 compounds flagged as PAINS by substructure queries (6%). The frequency of each PAINS substructure in the tested compound library were in general agreement with a previous report (data not shown) [51]. For HTS1 and HTS2, the 667 and 920 active compounds contained 171 (26%) and 214 (23%) compounds that were flagged as PAINS, respectively. Both the HTS1 and HTS2 actives were especially enriched with Mannich bases, catechols and p-hydroxyarylsulfonamides. We also observed several thiophene derivatives and quinones among the actives (Figure 6).
Figure 6. Noteworthy PAINS substructures in the primary Rtt109-Vps75 HTS.

Italics denote the original names of published PAINS substructures [51]. For individual substructures, the ratios denote the number of primary active compounds divided by the number of compounds tested for each HTS production run.
Post-HTS triage
Given the nature of this HTS method (e.g. fluorescence-based, thiol-reactive probe, thiol-containing reaction product), we speculated a significant portion of the primary active compounds were assay artifacts. Therefore, active compounds were subjected to a series of filters, counter-screens and orthogonal assays to identify compounds that truly inhibited histone acetylation (Figure 7A). First, primary actives were computationally filtered for PAINS and other undesirable structural components such as maleimides, thiols and certain functional groups with terminal sulfur atoms. This step effectively triaged one-half of the primary screen actives. Compounds were then subjected to a counter-screen that mimicked the HTS assay conditions, except that proteins were omitted and the acetyl-CoA substrate was replaced with the CoA reaction product [41]. Given the possibility that compounds could both interfere and still inhibit enzyme-catalyzed histone acetylation, we chose to triage most compounds with greater than 50% interference. Compounds with intermediate interference levels were triaged and passed depending on several factors, including chemical diversity, the potential for compound-thiol reactivity and the interference patterns observed for each compound. Next, library compounds were assessed for their ability to generate a dose-response curve. Compounds were scored according to curve shape (Figure 7B). The overall paucity of bona fide HAT inhibitors reported in the literature coupled with the observation that a recent, well-designed screen versus a human HAT discovered only one true hit [59] suggested the number of true-positives in our HTS may also be relatively low. Therefore, only compounds with no observable dose-response were triaged, which eliminated more than one-half of the remaining compounds. We obtained solid powder samples for all the remaining compounds and tested them for IC50 confirmation. Approximately one-half of the purchased solid samples had measureable IC50 values, typically in the 5–25 µM range (Figure 7C). IC50 values were determined in two separate experiments with similar values and curve shapes, further demonstrating the assay output is reproducible (data not shown). Nearly all of these samples did not show interference in a repeat of the CoA-based counter-screen (data not shown).
Figure 7. Post-HTS triage.

(A) Post-HTS triage schematic. Italics = HTS library samples. (B) Summary of confirmatory dose-responses, as classified by shape. Full response: >95% percent inhibition span and two horizontal asymptotes; partial response: >30% span; marginal response: >15% span. (C) IC50 profile of purchased solid samples. (D) Chemical structures of representative artifact compounds identified by the orthogonal slot blot assay.
Orthogonal assays were performed next to verify if the test compounds inhibited the actual enzyme-catalyzed acetylation of histones. Based on the shape of the dose-response curves, the chemotype clusters in the confirmed actives, and other medicinal chemistry considerations, 54 compounds were tested using the orthogonal slot blot assay to probe for decreases in the actual histone acetylation. Remarkably, only six compounds tested showed definitive inhibition of histone acetylation by this method. As there is a growing interest in the chemotypes of assay artifacts, we report representative compounds that showed low micromolar IC50 values but were inactive in the slot blot orthogonal assay (Figure 7D). Many of these confirmed inactive compounds contained 2-amino-3-carbonyl-thiophene, 1,3,4-thiadiazole or [1,2,4]triazolo[3,4-b][1,3,4]thiadiazole cores. A secondary orthogonal assay that utilizes [3H]-acetyl-CoA confirmed only three of these remaining compounds as inhibitors of Rtt109-catalyzed histone acetylation in the low micromolar range, consistent with their CPM-based IC50 values (data not shown, see Figure 8).
Figure 8. Example active compound discovered with the Rtt109 HTS and post-HTS triage.
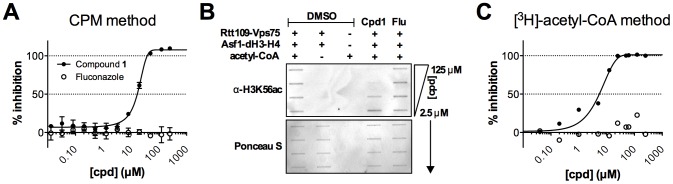
(A) CPM-based assay dose-response with compound 1. Fluconazole = negative control compound. (B) Orthogonal slot blot assay to detect the presence of H3K56ac by Western blot. Equal protein content was verified for each membrane by Ponceau S staining. (C) Dose-response of compound 1 using a [3H]-acetyl-CoA orthogonal assay.
Identification of novel active compounds by HTS method
The CPM-based HTS method and post-HTS triage steps identified novel active compounds from a screening library that inhibit Rtt109-catalyzed histone acetylation in vitro. As evidence, we present compound 1, which was identified in HTS2 as a primary active and successfully navigated the aforementioned triage process. Compound 1 showed dose-response activity when tested from library samples and re-purchased powder samples (IC50 = 19 µM; Figure 8A). For this compound, the orthogonal slot blot assay showed a dose-dependent decrease in H3K56ac consistent with the CPM-based HTS assay readout (Figure 8B). Compound 1 also showed activity when tested by the second, [3H]-acetyl-CoA orthogonal assay (IC50 = 4 µM, Figure 8C). Like garcinol, compound 1 showed only modest signs of fluorescence quenching at high concentrations (Figure S7). This compound did not show significant assay interference until compound concentrations above its IC50 value (Figure S8). However, no adducts of compound 1 with CoA or glutathione were detected by UPLC/MS analyses of aliquots reacted in HTS-like conditions. Compound 1 did not show detectable levels of H2O2 under HTS-like conditions in the presence or absence of DTT (Figure S9), strongly suggesting it is not inhibiting histone acetylation through redox activity. Similarly, compound 1 only modestly inhibited β-lactamase in the absence of detergent (Figure S9), reducing the likelihood the enzymatic inhibition is due to chemical aggregation. Neither compound 1 nor its chemical analogs have shown bioassay promiscuity according to PubChem queries (accessed 01 August 2013; data not shown). The data for compound 1 demonstrates that novel compounds identified by our method are capable inhibiting histone acetylation.
Discussion
We have adapted previously reported CPM-based assays of CoA levels to screen 225,703 compounds for small-molecule inhibitors of the yeast KAT Rtt109. Several aspects of this cell-free assay were designed to model the Rtt109-catalyzed histone acetylation in a physiologically relevant fashion, including the use of two chaperones present in vivo, Asf1 and Vps75, as well as full-length histone proteins. The assay was completed in two separate, non-overlapping production runs, HTS1 and HTS2, which were performed in the absence and presence of detergent, respectively. Cumulatively, the assay had acceptable Z' factors of 0.71±0.10. Multiple independent LOPAC screens demonstrated the day-to-day reproducibility of the assay for both production runs. The cumulative primary screen hit rate was 0.70% when using a 3σ percent inhibition criterion as an activity cut-off for each production run. As proof of concept, the assay method is capable of identifying garcinol, a previously reported inhibitor of KAT activity. Follow-up studies showed garcinol causes dose-dependent inhibition of Rtt109-catalyzed histone acetylation consistent with the CPM-based assay results, though the exact mechanism of this inhibition is unclear. We also confirmed that the HTS signal readout for garcinol was not due to assay interference such as fluorescence quenching, redox-activity, or compound-thiol adducts.
Several features in our assay were meant to model potentially important protein-protein interactions involved in Rtt109-catalyzed histone acetylation in an HTS-compatible format. Specifically, we emphasize the inclusion of two purified protein complexes, the Rtt109-Vps75 enzyme complex and the Asf1-dH3-H4 substrate complex. Screening Rtt109 in the absence of Vps75 and Asf1 could presumably identify inhibitors of the Rtt109 active site. However, Rtt109 activity is significantly attenuated in the absence of its known chaperones Asf1 and Vps75 in vitro [4], [6], [15], [17], [33]. In contrast to most KATs that utilize free histones or nucleosomal histones as substrates, the ideal substrate for Rtt109 is the heterotrimeric complex of Asf1-dH3-H4 in vitro and most likely in cells, as Asf1 is essential for H3K56ac in vivo [4], [16]. Vps75 and Asf1 also direct the substrate specificity of Rtt109 differently [77]. Vps75 forms a complex with Rtt109 in vivo, and in the absence of Vps75, Rtt109 is sensitive to proteolysis [13], [19]. The choice of substrate is also a nontrivial matter. Histone substrates can vary considerably across KAT assays, including histone peptides [78], biotinylated histone peptides [59] and full-length histones. Histone precipitation can be problematic, and one solution is to use histone peptides in place of full-length histone proteins [33]. In an effort to make the assay more physiologically relevant [79], we were able to successfully incorporate full-length histone proteins complexed with the histone chaperone Asf1 into this assay. This is in contrast to the method used to identify a reported Rtt109 inhibitor, which utilized histone peptides in the primary HTS [38]. In principle, the use of both chaperones and full-length histones could allow the identification of multiple classes of inhibitors. This includes compounds that can directly target Rtt109, or disrupt the interactions between Rtt109 and Vps75, Rtt109-Vps75 and its substrate Asf1-dH3-H4, as well as those disrupting interactions between Asf1 and dH3-H4.
While this assay used the yeast Rtt109-Vps75-Asf1 system, in principle the HTS could be adapted to screen clinically relevant pathogenic fungal species such as C. albicans or P. carinii. A potential advantage of using yeast Rtt109 and its chaperones is the abundance of structural information already available (e.g. PDB IDs 2HUE, 2ZFN, 3CZ7, 3C9B, 3QM0, 3Q35, 3Q66). Additionally, inhibitors of the scRtt109 system may also inhibit Rtt109 from other fungal species, as scRtt109 can complement the function of Rtt109 from several opportunistic fungal species. For instance, it is known that S. cerevisiae or C. albicans cells lacking Rtt109 are sensitive to the chemotherapeutic agent camptothecin (CPT) [5], [34]. Importantly, expression of scRtt109 in rtt109 −/− C. albicans cells renders the mutant cells resistant to CPT to a similar degree as expression of caRtt109 (data not shown). Moreover, expression of pcRtt109 in S. cerevisiae cells lacking scRtt109 also leads to CPT resistance and restoration of H3K56ac (data not shown). This suggests that Rtt109 from these fungal species have similar functions and that small-molecule scRtt109 inhibitors (or chemical adaptations thereof) could inhibit Rtt109 from other species, depending on the nature of the binding site(s) (i.e. the degree of sequence and structural homology) and potentially other species-specific factors.
Our assay production is also notable because of the decision to include detergent mid-assay. We decided not to re-screen the compounds assayed under non-detergent conditions based on two primary factors: resource conservation and the availability of several available follow-up assays to identify promiscuous aggregators [55], [80]. Interestingly, the mean percent inhibition, the standard deviation and the percentages of primary screen hits were lower for the detergent-containing production run (HTS2) compared to the detergent-free run (HTS1). Also, the mean Z' factor was higher for HTS2 compared to HTS1. In the absence of re-testing the same compounds under detergent and detergent-free conditions, one can only speculate these observations are related to the presence of detergent in the HTS. Other factors such as protein batches and the chemical library compositions could also account for the observed differences between HTS1 and HTS2. Based on our experience with this assay, we echo previous reports recommending the inclusion of detergents in cell-free enzymatic screens when experimentally feasible [63].
There are many reported methods for assaying acetyltransferase activities, with some being more amenable to HTS than others [81]. Radioactive filter binding assays using either [3H]- or [14C]-acetyl-CoA can be very sensitive and straightforward [82], [83], although the use of these radionucleotides on a high-throughput scale may be prohibitive. Other methods such as AlphaScreen [59] and scintillation proximity assays (SPA) have been reported for KATs [84]. These methods require specialized equipment and reagents, and in the case of SPA, special safety and waste-disposal procedures as well. Antibody-based approaches can be very specific and sensitive; however, antibodies may also bind non-specifically to undesired epitopes or possibly interfere with small-molecules resembling acetylated lysine residues, such as acetamide motifs [59]. Electrophoretic mobility shift assays have also been applied to KATs [85], but this also requires specialized instrumentation and oftentimes truncated histone substrates. CoA formation can also be assessed with a coupled enzymatic assay [57], [86], but these assays can require significant product formation for signal changes and add additional components that may be susceptible to assay interference. Advantages of our reported assay include its use of relatively standard HTS equipment, consumables and reagents. It also requires non-burdensome safety and waste-disposal procedures. Clearly, there are advantages and disadvantages to each assay method, and investigators should carefully consider the particular research question when selecting an assay.
There are also limitations to our HTS method, including the need for careful follow-up mechanism of action studies to determine the exact protein(s) inhibited in our assay. As with any HTS, we re-emphasize the need for rigorous follow-up studies to triage false-positives, assay artifacts and intractable leads [87]–[89]. Reported sources of drug discovery artifacts such as compound aggregation [56], [61]–[64], redox-active compounds [53], [54], [90], [91], non-specific protein reactivity [71], [92] and impurities [93]–[95] should be excluded by standard follow-up experiments. Compound promiscuity should also be considered [96], and compounds flagged as PAINS should be pursued with strong skepticism [76].
Our triage experience reinforces several important caveats to this CPM-based method, namely the number of apparent assay artifacts. Several aspects of the detection method make it susceptible to artifacts. First, assaying for reduction in fluorescence intensity raises the possibility for selecting compounds that are fluorescence quenchers. Second, the generation of the assay signal requires a covalent bond formation between CoA and CPM, which raises the possibility of selecting for reactive chemotypes that interfere with either reagent. Screening a large number of diverse compounds, as is routinely done in HTS, means encountering these types of artifacts is all but inevitable. However, these compounds can be triaged with appropriate control experiments [41], [52] and orthogonal assays.
The prevalence of assay artifacts therefore necessitates a rigorous post-HTS triage. Although PAINS have not been culled out from screening libraries, they can still be efficiently removed post-HTS with computational filters. Filtering specific chemotypes with well-characterized interference should also significantly enhance the triage process for thiol probe-based screens. Based on preliminary experiments, we were able to include some chemotypes like thiols and terminal sulfur atoms (e.g. certain types of thiones) in our substructure filters. Additional interfering chemotypes and the chemical nature of their interference will be reported in due course. For our particular triage, we found the slot blot format to be a convenient method to identify compounds that inhibit actual histone acetylation. In retrospect, it may be more economical to perform the slot blot or similar antibody-based histone modification assays at earlier stages of the triage process, as it may mitigate the need for interference counter-screens. Future follow-up studies on the remaining active compounds will include mechanistic and selectivity experiments. Based on the high prevalence of artifacts encountered in our primary screen actives, we highly recommend having an orthogonal assay established prior to initiating a CPM-based HTS.
Overall, the number of confirmed active compounds was relatively few. There are several non-exclusive explanations for these findings. First, this could be due to the compound library composition, as the discovery of a lead compound is predicated on the chemical matter screened. For instance, identifying a protein-protein interaction inhibitor may be difficult with traditional libraries [97]. Second, histone acetyltransferases may be inherently difficult to target with small-molecules. Several reported screens versus histone acetyltransferases have turned up few confirmed actives [38], [59]. Third, our triage process may have been overly rigorous at certain stages. Computational filtering may have removed potential actives, though many of the filtered primary actives were PAINS or thiols. It is also possible that assay interference compounds may still inhibit enzymatic activity. However, such compounds may be thiol reactive, a property that is conventionally avoided in lead discovery [71], [92]. Finally, another explanation for the low active rate observed is the HTS method employed, which may have led to false-negatives. This is difficult to assess in the absence of re-screening our library or employing an alternate screening method. However, two observations downplay this last possibility. First, our method can identify garcinol as well as novel active compounds that were confirmed by two orthogonal assays. Second, we purposefully chose a low activity threshold for IC50 confirmation to minimize the chance of bypassing low potency inhibitors.
To summarize, we successfully developed a CPM-based HTS to screen for inhibitors of Rtt109-catalyzed histone acetylation using two full-length physiologically relevant protein complexes. The assay is robust and straightforward, but it is susceptible to many sources of signal artifacts that fortunately can be triaged with appropriate experiments. This assay method can identify garcinol, a reported inhibitor of other KATs, though its mechanism of inhibition is unclear. Since garcinol contains a catechol, it is flagged by PAINS filters. Its activity using our HTS method confirms that active compounds identified by HTS should always be investigated with appropriate orthogonal assays, counter-screens and other follow-up experiments. This HTS identified three confirmed actives following an extensive post-HTS triage. This particular screen, or adaptations thereof, can identify compounds that inhibit Rtt109-catalyzed histone acetylation. These types of inhibitors have potential utility as chemical probes for epigenetic studies [98] as well as minimally toxic antifungals.
Supporting Information
Reproducibility of independent LOPAC experiments under detergent-free conditions (HTS1). Shown are the comparisons of four independent LOPAC runs.
(TIFF)
Plate positional effects during LOPAC experiments. (A) Mean percent inhibition of the LOPAC ± detergent, sorted by either plate row or column. Boxes represent one standard deviation from the mean, whiskers span the 10 to 90 percentiles and dots represent outliers. (B) Heat maps of the percent inhibition results from the LOPAC plates. Each position represents the mean of the replicate LOPAC experiments ± detergent. HTS1 = no detergent; HTS2 = detergent.
(TIFF)
Trellis plot of individual plate heat maps. Plates are arranged by order screened. HTS1 spans plates 1–259, HTS2 spans plates 260–715.
(TIFF)
Whole-HTS plate positional effects. (A) Cumulative heat map showing the mean percent inhibition for each well position. (B) Cumulative mean percent inhibition and the number of actives, sorted by either row or column. Boxes represent one standard deviation from the mean, whiskers span the 10 to 90 percentiles. (C) Heat map showing the number of active compounds for each well position (greater than three standard deviations above the mean percent inhibition).
(TIFF)
Analysis of HTS results in the absence of detergent (HTS1). (A) Mean percent inhibition (top panels) and the number of actives (bottom panels; compounds with greater than three standard deviations above the mean percent inhibition for HTS1), sorted by either plate row or column. Boxes represent one standard deviation from the HTS1 mean, whiskers span the 10 to 90 percentiles. (B) Heat map showing the mean percent inhibition for each well position in HTS1. (C) Heat map showing the number of active compounds for each well position in HTS1.
(TIFF)
Analysis of HTS results in the presence of detergent (HTS2). (A) Mean percent inhibition (top panels) and the number of actives (bottom panels; compounds with greater than three standard deviations above the mean percent inhibition for HTS2), sorted by either plate row or column. Boxes represent one standard deviation from the HTS2 mean, whiskers span the 10 to 90 percentiles. (B) Heat map showing the mean percent inhibition for each well position in HTS2. (C) Heat map showing the number of active compounds for each well position in HTS2.
(TIFF)
Fluorescence quenching counter-screen. Pre-formed CPM-CoA solutions were spiked with either DMSO or test compounds. Data is expressed as the fluorescence intensity of spiked solutions relative to DMSO controls. Fluconazole = negative control compound; BHQ-1 = positive control compound.
(TIFF)
Assay interference counter-screen. Select compounds were incubated with CoA and then CPM under HTS-like conditions, minus proteins and acetyl-CoA. Fluconazole = negative control compound.
(TIFF)
Redox-activity and aggregation counter-screens. (A) Redox-activity of selected compounds using a surrogate HRP-phenol red assay. Fluconazole = negative compound control; NSC-663284 and 4-amino-1-naphthol = positive compound controls. Neither positive compound control showed detectable absorbance at 610 nm in assay buffer (data not shown). (B) Aggregation tendencies of selected compounds using a surrogate β-lactamase-nitrocefin assay. Compounds were tested at 10 µM final concentrations. Lidocaine = negative aggregation control; rottlerin = positive aggregation control. Percent inhibitions calculated based on DMSO controls.
(TIFF)
Acknowledgments
JLD acknowledges Drs. Rebecca J. Burgess, Barry Finzel and Jon Hawkinson and for helpful discussions.
Funding Statement
This work was supported by the Minnesota Partnership for Biotechnology and Medical Genomics (#73-01), the National Institutes of Health (NIH GM72719 and GM81838), the Mayo Foundation for Medical Education and Research and the Minnesota Supercomputing Institute. JLD was supported by the NIH Medical Scientist Training Program (T32 GM065841), an NIH Predoctoral Fellowship (F30 DK092026-01) and a Pharmaceutical Research and Manufacturers of America Foundation predoctoral pharmacology/toxicology fellowship. The funders had no role in study design, data collection and analysis, decision to publish, or preparation of the manuscript.
References
- 1. Kouzarides T (2007) Chromatin modifications and their function. Cell 128: 693–705. [DOI] [PubMed] [Google Scholar]
- 2. Li B, Carey M, Workman JL (2007) The role of chromatin during transcription. Cell 128: 707–719. [DOI] [PubMed] [Google Scholar]
- 3. Masumoto H, Hawke D, Kobayashi R, Verreault A (2005) A role for cell-cycle-regulated histone H3 lysine 56 acetylation in the DNA damage response. Nature 436: 294–298. [DOI] [PubMed] [Google Scholar]
- 4. Tsubota T, Berndsen CE, Erkmann JA, Smith CL, Yang L, et al. (2007) Histone H3-K56 acetylation is catalyzed by histone chaperone-dependent complexes. Mol Cell 25: 703–712. [DOI] [PMC free article] [PubMed] [Google Scholar]
- 5. Han J, Zhou H, Horazdovsky B, Zhang K, Xu R, et al. (2007) Rtt109 acetylates histone H3 lysine 56 and functions in DNA replication. Science 315: 653–655. [DOI] [PubMed] [Google Scholar]
- 6. Driscoll R, Hudson A, Jackson SP (2007) Yeast Rtt109 promotes genome stability by acetylating histone H3 on lysine 56. Science 315: 649–652. [DOI] [PMC free article] [PubMed] [Google Scholar]
- 7. Chen CC, Carson JJ, Feser J, Tamburini B, Zabaronick S, et al. (2008) Acetylated lysine 56 on histone H3 drives chromatin assembly after repair and signals for the completion of repair. Cell 134: 231–243. [DOI] [PMC free article] [PubMed] [Google Scholar]
- 8. Li Q, Zhou H, Wurtele H, Davies B, Horazdovsky B, et al. (2008) Acetylation of histone H3 lysine 56 regulates replication-coupled nucleosome assembly. Cell 134: 244–255. [DOI] [PMC free article] [PubMed] [Google Scholar]
- 9. Das C, Lucia M, Hansen K, Tyler J (2009) CBP/p300-mediated acetylation of histone H3 on lysine 56. Nature 459: 113–117. [DOI] [PMC free article] [PubMed] [Google Scholar]
- 10. Tjeertes J, Miller K, Jackson S (2009) Screen for DNA-damage-responsive histone modifications identifies H3K9Ac and H3K56Ac in human cells. EMBO J 28: 1878–1889. [DOI] [PMC free article] [PubMed] [Google Scholar]
- 11. Tang Y, Holbert M, Wurtele H, Meeth K, Rocha W, et al. (2008) Fungal Rtt109 histone acetyltransferase is an unexpected structural homolog of metazoan p300/CBP. Nat Struct Mol Biol 15: 738–745. [DOI] [PMC free article] [PubMed] [Google Scholar]
- 12. Wang L, Tang Y, Cole PA, Marmorstein R (2008) Structure and chemistry of the p300/CBP and Rtt109 histone acetyltransferases: implications for histone acetyltransferase evolution and function. Curr Opin Struct Biol 18: 741–747. [DOI] [PMC free article] [PubMed] [Google Scholar]
- 13. Stavropoulos P, Nagy V, Blobel G, Hoelz A (2008) Molecular basis for the autoregulation of the protein acetyl transferase Rtt109. P Natl Acad Sci USA 105: 12236–12241. [DOI] [PMC free article] [PubMed] [Google Scholar]
- 14. Albaugh BN, Arnold KM, Lee S, Denu JM (2011) Autoacetylation of the histone acetyltransferase Rtt109. J Biol Chem 286: 24694–24701. [DOI] [PMC free article] [PubMed] [Google Scholar]
- 15. Berndsen CE, Tsubota T, Lindner SE, Lee S, Holton JM, et al. (2008) Molecular functions of the histone acetyltransferase chaperone complex Rtt109-Vps75. Nat Struct Mol Biol 15: 948–956. [DOI] [PMC free article] [PubMed] [Google Scholar]
- 16. Han J, Zhou H, Li Z, Xu R, Zhang Z (2007) Acetylation of lysine 56 of histone H3 catalyzed by Rtt109 and regulated by Asf1 is required for replisome integrity. J Biol Chem 282: 28587–28596. [DOI] [PubMed] [Google Scholar]
- 17. Han J, Zhou H, Li Z, Xu RM, Zhang Z (2007) The Rtt109-Vps75 histone acetyltransferase complex acetylates non-nucleosomal histone H3. J Biol Chem 282: 14158–14164. [DOI] [PubMed] [Google Scholar]
- 18. Lin C, Yuan YA (2008) Structural insights into histone H3 lysine 56 acetylation by Rtt109. Structure 16: 1503–1510. [DOI] [PubMed] [Google Scholar]
- 19. Tang Y, Holbert MA, Delgoshaie N, Wurtele H, Guillemette B, et al. (2011) Structure of the Rtt109-AcCoA/Vps75 complex and implications for chaperone-mediated histone acetylation. Structure 19: 221–231. [DOI] [PMC free article] [PubMed] [Google Scholar]
- 20. Guillemette B, Drogaris P, Lin H-HS, Armstrong H, Hiragami-Hamada K, et al. (2011) H3 lysine 4 is acetylated at active gene promoters and is regulated by H3 lysine 4 methylation. PLoS Genet 7: e1001354. [DOI] [PMC free article] [PubMed] [Google Scholar]
- 21. Fillingham J, Recht J, Silva A, Suter B, Emili A, et al. (2008) Chaperone control of the activity and specificity of the histone H3 acetyltransferase Rtt109. Mol Cell Biol 28: 4342–4353. [DOI] [PMC free article] [PubMed] [Google Scholar]
- 22. Burgess RJ, Zhou H, Han J, Zhang Z (2010) A role for Gcn5 in replication-coupled nucleosome assembly. Mol Cell 37: 469–480. [DOI] [PMC free article] [PubMed] [Google Scholar]
- 23. Abshiru N, Ippersiel K, Tang Y, Yuan H, Marmorstein R, et al. (2012) Chaperone-mediated acetylation of histones by Rtt109 identified by quantitative proteomics. J Proteomics 81: 80–90. [DOI] [PMC free article] [PubMed] [Google Scholar]
- 24. Marr KA, Carter RA, Boeckh M, Martin P, Corey L (2002) Invasive aspergillosis in allogeneic stem cell transplant recipients: changes in epidemiology and risk factors. Blood 100: 4358–4366. [DOI] [PubMed] [Google Scholar]
- 25. Marr KA, Carter RA, Crippa F, Wald A, Corey L (2002) Epidemiology and outcome of mould infections in hematopoietic stem cell transplant recipients. Clin Infect Dis 34: 909–917. [DOI] [PubMed] [Google Scholar]
- 26. Cornely OA, Ullmann AJ, Karthaus M (2003) Evidence-based assessment of primary antifungal prophylaxis in patients with hematologic malignancies. Blood 101: 3365–3372. [DOI] [PubMed] [Google Scholar]
- 27. Odds FC, Brown AJ, Gow NA (2003) Antifungal agents: mechanisms of action. Trends Microbiol 11: 272–279. [DOI] [PubMed] [Google Scholar]
- 28. Kontoyiannis D, Lewis R (2002) Antifungal drug resistance of pathogenic fungi. Lancet 359: 1135–1144. [DOI] [PubMed] [Google Scholar]
- 29. Einsele H, Loeffler J (2008) Contribution of new diagnostic approaches to antifungal treatment plans in high-risk haematology patients. Clin Microbiol Infect 14: 37–45. [DOI] [PubMed] [Google Scholar]
- 30. Jones B, McLinktock L (2003) Impact of diagnostic markers on early antifungal therapy. Curr Opin Infect Dis 16: 521–526. [DOI] [PubMed] [Google Scholar]
- 31. Cottier F, Pavelka N (2012) Complexity and dynamics of host-fungal interactions. Immunol Res 53: 127–135. [DOI] [PubMed] [Google Scholar]
- 32. Collette J, Lorenz M (2011) Mechanisms of immune evasion in fungal pathogens. Curr Opin Microbiol 14: 668–675. [DOI] [PubMed] [Google Scholar]
- 33. Albaugh BN, Kolonko EM, Denu JM (2010) Kinetic mechanism of the Rtt109-Vps75 histone acetyltransferase-chaperone complex. Biochemistry 49: 6375–6385. [DOI] [PMC free article] [PubMed] [Google Scholar]
- 34. Wurtele H, Tsao S, Lépine G, Mullick A, Tremblay J, et al. (2010) Modulation of histone H3 lysine 56 acetylation as an antifungal therapeutic strategy. Nat Med 16: 774–780. [DOI] [PMC free article] [PubMed] [Google Scholar]
- 35. Rosa JLd, Boyartchuk VL, Zhu LJ, Kaufman PD (2010) Histone acetyltransferase Rtt109 is required for Candida albicans pathogenesis. P Natl Acad Sci USA 107: 1594–1599. [DOI] [PMC free article] [PubMed] [Google Scholar]
- 36. Kottom TJ, Han J, Zhang Z, Limper AH (2011) Pneumocystis carinii expresses an active Rtt109 histone acetyltransferase. Am J Resp Cell Mol Biol 44: 768–776. [DOI] [PMC free article] [PubMed] [Google Scholar]
- 37. Pupaibool J, Kottom TJ, Bouchonville K, Limper AH (2013) Characterization of the Pneumocystis carinii histone acetyltranferase chaperone proteins PcAsf1 and PcVps75. Infect Immun 81: 2268–2275. [DOI] [PMC free article] [PubMed] [Google Scholar]
- 38. Rosa JLd, Bajaj V, Spoonamore J, Kaufman PD (2013) A small molecule inhibitor of fungal histone acetyltransferase Rtt109. Bioorg Med Chem Lett 23: 2853–2859. [DOI] [PMC free article] [PubMed] [Google Scholar]
- 39. Sippel TO (1981) New fluorochromes for thiols: maleimide and iodoacetamide derivatives of a 3-phenylcoumarin fluorophore. J Histochem Cytochem 29: 314–316. [DOI] [PubMed] [Google Scholar]
- 40. Trievel RC, Li FY, Marmorstein R (2000) Application of a fluorescent histone acetyltransferase assay to probe the substrate specificity of the human p300/CBP-associated factor. Anal Biochem 287: 319–328. [DOI] [PubMed] [Google Scholar]
- 41. Chung CC, Ohwaki K, Schneeweis JE, Stec E, Varnerin JP, et al. (2008) A fluorescence-based thiol quantification assay for ultra-high-throughput screening for inhibitors of coenzyme A production. Assay Drug Dev Technol 6: 361–374. [DOI] [PubMed] [Google Scholar]
- 42. Wang R, Ibáñez G, Islam K, Zheng W, Blum G, et al. (2011) Formulating a fluorogenic assay to evaluate S-adenosyl-L-methionine analogues as protein methyltransferase cofactors. Mol Biosyst 7: 2970–2981. [DOI] [PMC free article] [PubMed] [Google Scholar]
- 43. Linsky T, Fast W (2011) A continuous, fluorescent, high-throughput assay for human dimethylarginine dimethylaminohydrolase-1. J Biomol Screen 16: 1089–1097. [DOI] [PMC free article] [PubMed] [Google Scholar]
- 44. McDonald PR, Roy A, Chaguturu R (2011) The University of Kansas High-Throughput Screening Laboratory. Part II: enabling collaborative drug-discovery partnerships through cutting-edge screening technology. Future Med Chem 3: 1101–1110. [DOI] [PMC free article] [PubMed] [Google Scholar]
- 45. Levenstein M, Kadonaga J (2002) Biochemical analysis of chromatin containing recombinant Drosophila core histones. J Biol Chem 277: 8749–8754. [DOI] [PubMed] [Google Scholar]
- 46. Su D, Hu Q, Zhou H, Thompson JR, Xu RM, et al. (2011) Structure and histone binding properties of the Vps75-Rtt109 chaperone-lysine acetyltransferase complex. J Biol Chem 286: 15625–15629. [DOI] [PMC free article] [PubMed] [Google Scholar]
- 47. Bradford M (1976) Rapid and sensitive method for the quantitation of microgram quantities of protein utilizing the principle of protein-dye binding. Anal Biochem 72: 248–254. [DOI] [PubMed] [Google Scholar]
- 48. Inglese J, Shamu CE, Guy RK (2007) Reporting data from high-throughput screening of small-molecule libraries. Nat Chem Biol 3: 438–441. [DOI] [PubMed] [Google Scholar]
- 49. Miki T, Orii Y (1985) The reaction of horseradish peroxidase with hydroperoxides derived from Triton X-100. Anal Biochem 146: 28–34. [DOI] [PubMed] [Google Scholar]
- 50. Zhang J, Chung T, Oldenburg K (1999) A simple statistical parameter for use in evaluation and validation of high throughput screening assays. J Biomol Screen 4: 67–73. [DOI] [PubMed] [Google Scholar]
- 51. Baell JB, Holloway GA (2010) New substructure filters for removal of pan assay interference compounds (PAINS) from screening libraries and for their exclusion in bioassays. J Med Chem 53: 2719–2740. [DOI] [PubMed] [Google Scholar]
- 52. Bulfer S, McQuade T, Larsen M (2011) Application of a high-throughput fluorescent acetyltransferase assay to identify inhibitors of homocitrate synthase. Anal Biochem 410: 133–140. [DOI] [PMC free article] [PubMed] [Google Scholar]
- 53. Soares KM, Blackmon N, Shun TY, Shinde SN, Takyi HK, et al. (2010) Profiling the NIH Small Molecule Repository for compounds that generate H2O2 by redox cycling in reducing environments. Assay Drug Dev Technol 8: 152–174. [DOI] [PMC free article] [PubMed] [Google Scholar]
- 54. Mirković B, Sosič I, Gobec S, Kos J (2011) Redox-based inactivation of cysteine cathepsins by compounds containing the 4-aminophenol moiety. PLoS ONE 6: e27197. [DOI] [PMC free article] [PubMed] [Google Scholar]
- 55. Feng BY, Shoichet BK (2006) A detergent-based assay for the detection of promiscuous inhibitors. Nat Protoc 1: 550–553. [DOI] [PMC free article] [PubMed] [Google Scholar]
- 56. McGovern S, Helfand B, Feng B (2003) A specific mechanism of nonspecific inhibition. J Med Chem 46: 4265–4272. [DOI] [PubMed] [Google Scholar]
- 57. Berndsen CE, Denu JM (2005) Assays for mechanistic investigations of protein/histone acetyltransferases. Methods 36: 321–331. [DOI] [PubMed] [Google Scholar]
- 58. Yang J, Copeland RA, Lai Z (2009) Defining balanced conditions for inhibitor screening assays that target bisubstrate enzymes. J Biomol Screen 14: 111–120. [DOI] [PubMed] [Google Scholar]
- 59. Falk H, Connor T, Yang H, Loft KJ, Alcindor JL, et al. (2011) An efficient high-throughput screening method for MYST family acetyltransferases, a new class of epigenetic drug targets. J Biomol Screen 16: 1196–1205. [DOI] [PubMed] [Google Scholar]
- 60. Gao T, Yang C, Zheng YG (2012) Comparative studies of thiol-sensitive fluorogenic probes for HAT assays. Anal Bioanal Chem 421: 1–11. [DOI] [PMC free article] [PubMed] [Google Scholar]
- 61. Seidler J, McGovern SL, Doman TN, Shoichet BK (2003) Identification and prediction of promiscuous aggregating inhibitors among known drugs. J Med Chem 46: 4477–4486. [DOI] [PubMed] [Google Scholar]
- 62. Feng BY, Simeonov A, Jadhav A, Babaoglu K, Inglese J, et al. (2007) A high-throughput screen for aggregation-based inhibition in a large compound library. J Med Chem 50: 2385–2390. [DOI] [PubMed] [Google Scholar]
- 63. Ryan AJ, Gray NM, Lowe PN, Chung C-w (2003) Effect of detergent on “promiscuous” inhibitors. J Med Chem 46: 3448–3451. [DOI] [PubMed] [Google Scholar]
- 64. McGovern SL, Caselli E, Grigorieff N, Shoichet BK (2002) A common mechanism underlying promiscuous inhibitors from virtual and high-throughput screening. J Med Chem 45: 1712–1722. [DOI] [PubMed] [Google Scholar]
- 65. Malo N, Hanley JA, Cerquozzi S, Pelletier J, Nadon R (2006) Statistical practice in high-throughput screening data analysis. Nat Biotech 24: 167–175. [DOI] [PubMed] [Google Scholar]
- 66.Gubler H (2006) Methods for statistical analysis, quality assurance and management of primary high-throughput screening data. In: Hüser J, editor. High-Throughput Screening in Drug Discovery. KGaA, Weinheim, FRG: Wiley-VCH Verlag GmbH & Co. [Google Scholar]
- 67. Kevorkov D, Makarenkov V (2005) Statistical analysis of systematic errors in high-throughput screening. J Biomol Screen 10: 557–567. [DOI] [PubMed] [Google Scholar]
- 68. Brideau C, Gunter B, Pikounis B, Liaw A (2003) Improved statistical methods for hit selection in high-throughput screening. J Biomol Screen 8: 634–647. [DOI] [PubMed] [Google Scholar]
- 69. Balasubramanyam K, Altaf M, Varier R, Swaminathan V, Ravindran A, et al. (2004) Polyisoprenylated benzophenone, garcinol, a natural histone acetyltransferase inhibitor, represses chromatin transcription and alters global gene expression. J Biol Chem 279: 33716–33726. [DOI] [PubMed] [Google Scholar]
- 70. Arif M, Pradhan SK, Thanuja GR, Vedamurthy BM, Agrawal S, et al. (2009) Mechanism of p300 specific histone acetyltransferase inhibition by small molecules. J Med Chem 52: 267–277. [DOI] [PubMed] [Google Scholar]
- 71. Huth JR, Mendoza R, Olejniczak ET, Johnson RW, Cothron DA, et al. (2005) ALARM NMR: a rapid and robust experimental method to detect reactive false positives in biochemical screens. J Am Chem Soc 127: 217–224. [DOI] [PubMed] [Google Scholar]
- 72. Sleno L, Staack RF, Varesio E, Hopfgartner G (2007) Investigating the in vitro metabolism of fipexide: characterization of reactive metabolites using liquid chromatography/mass spectrometry. Rapid Commun Mass Spectrom 21: 2301–2311. [DOI] [PubMed] [Google Scholar]
- 73. Dietrich LEP, Teal TK, Price-Whelan A, Newman DK (2008) Redox-active antibiotics control gene expression and community behavior in divergent bacteria. Science 321: 1203–1206. [DOI] [PMC free article] [PubMed] [Google Scholar]
- 74. Bova MP, Mattson MN, Vasile S, Tam D, Holsinger L, et al. (2004) The oxidative mechanism of action of ortho-quinone inhibitors of protein-tyrosine phosphatase alpha is mediated by hydrogen peroxide. Arch Biochem Biophys 429: 30–41. [DOI] [PubMed] [Google Scholar]
- 75. Sang S, Liao C-H, Pan M-H, Rosen RT, Lin-Shiau S-Y, et al. (2002) Chemical studies on antioxidant mechanism of garcinol: analysis of radical reaction products of garcinol with peroxyl radicals and their antitumor activities. Tetrahedron 58: 10095–10102. [Google Scholar]
- 76. Baell JB (2010) Observations on screening-based research and some concerning trends in the literature. Future Med Chem 2: 1529–1546. [DOI] [PubMed] [Google Scholar]
- 77. D'Arcy S, Luger K (2011) Understanding histone acetyltransferase Rtt109 structure and function: how many chaperones does it take? Curr Opin Struc Biol 21: 1–7. [DOI] [PMC free article] [PubMed] [Google Scholar]
- 78. Zhen Z, Tang L-J, Long H, Jiang J-H (2012) Enzymatic immuno-assembly of gold nanoparticles for visualized activity screening of histone-modifying enzymes. Anal Chem 84: 3614–3620. [DOI] [PubMed] [Google Scholar]
- 79. Copeland RA (2003) Mechanistic considerations in high-throughput screening. Anal Biochem 320: 1–12. [DOI] [PubMed] [Google Scholar]
- 80. Shoichet BK (2006) Interpreting steep dose-response curves in early inhibitor discovery. J Med Chem 49: 7274–7277. [DOI] [PubMed] [Google Scholar]
- 81. Aherne GW, Rowlands MG, Stimson L, Workman P (2002) Assays for the identification and evaluation of histone acetyltransferase inhibitors. Methods 26: 245–253. [DOI] [PubMed] [Google Scholar]
- 82. Ait-Si-Ali S, Ramirez S, Robin P, Trouche D, Harel-Bellan A (1998) A rapid and sensitive assay for histone acetyl-transferase activity. Nucleic Acids Res 26: 3869–3870. [DOI] [PMC free article] [PubMed] [Google Scholar]
- 83. Tanner KG, Tievel RC, Kuo MH, Howard RM, Berger SL, et al. (1999) Catalytic mechanism and function of invariant glutamic acid 173 from the histone acetyltransferase Gcn5 transcriptional coactivator. J Biol Chem 274: 18157–18160. [DOI] [PubMed] [Google Scholar]
- 84. Turlais F, Hardcastle A, Rowlands M, Newbatt Y, Bannister A, et al. (2001) High-throughput screening for identification of small molecule inhibitors of histone acetyltransferases using scintillating microplates (FlashPlate). Anal Biochem 298: 62–68. [DOI] [PubMed] [Google Scholar]
- 85. Fanslau C, Pedicord D, Nagulapalli S, Gray H, Pang S, et al. (2010) An electrophoretic mobility shift assay for the identification and kinetic analysis of acetyl transferase inhibitors. Anal Biochem 402: 65–68. [DOI] [PubMed] [Google Scholar]
- 86. Kim Y, Tanner KG, Denu JM (2000) A continuous, nonradioactive assay for histone acetyltransferases. Anal Biochem 280: 308–314. [DOI] [PubMed] [Google Scholar]
- 87. Davis BJ, Erlanson DA (2013) Learning from our mistakes: The ‘unknown knowns’ in fragment screening. Bioorg Med Chem Lett: In press. [DOI] [PubMed] [Google Scholar]
- 88. Šink R, Gobec S, Pecar S (2010) False positives in the early stages of drug discovery. Curr Med Chem 17: 4231–4255. [DOI] [PubMed] [Google Scholar]
- 89. Jadhav A, Ferreira RS, Klumpp C, Mott BT, Austin CP, et al. (2010) Quantitative analyses of aggregation, autofluorescence, and reactivity artifacts in a screen for inhibitors of a thiol protease. J Med Chem 53: 37–51. [DOI] [PMC free article] [PubMed] [Google Scholar]
- 90. Johnston PA (2011) Redox cycling compounds generate H2O2 in HTS buffers containing strong reducing reagents-real hits or promiscuous artifacts? Curr Opin Chem Biol 15: 174–182. [DOI] [PMC free article] [PubMed] [Google Scholar]
- 91. Lor LA, Schneck J, McNulty DE, Diaz E, Brandt M, et al. (2007) A simple assay for detection of small-molecule redox activity. J Biomol Screen 12: 881–890. [DOI] [PubMed] [Google Scholar]
- 92. Metz JT, Huth JR, Hajduk PJ (2007) Enhancement of chemical rules for predicting compound reactivity towards protein thiol groups. J Comput Aid Mol Des 21: 139–144. [DOI] [PubMed] [Google Scholar]
- 93. Huang Z (2011) Impact of impurities on IC50 values of P450 inhibitors. Drug Metab Lett 5: 156–162. [DOI] [PubMed] [Google Scholar]
- 94. Jaki BU, Frazblau SG, Chadwick LR, Lankin DC, Zhang F, et al. (2008) Purity-activity relationships of natural products: the case of anti-TB active ursolic acid. J Nat Prod 71: 1742–1748. [DOI] [PubMed] [Google Scholar]
- 95. Hermann JC, Chen Y, Wartchow C, Menke J, Gao L, et al. (2013) Metal impurities cause false positives in high-throughput screening campaigns. ACS Med Chem Lett 4: 197–200. [DOI] [PMC free article] [PubMed] [Google Scholar]
- 96. Canny SA, Cruz Y, Southern MR, Griffin PR (2009) PubChem promiscuity: a web resource for gathering compound promiscuity data from PubChem. Bioinformatics 28: 140–141. [DOI] [PMC free article] [PubMed] [Google Scholar]
- 97. Wells JA, McClendon CL (2007) Reaching for high-hanging fruit in drug discovery at protein-protein interfaces. Nature 450: 1001–1009. [DOI] [PubMed] [Google Scholar]
- 98. Cole PA (2008) Chemical probes for histone-modifying enzymes. Nat Chem Biol 4: 590–597. [DOI] [PMC free article] [PubMed] [Google Scholar]
Associated Data
This section collects any data citations, data availability statements, or supplementary materials included in this article.
Supplementary Materials
Reproducibility of independent LOPAC experiments under detergent-free conditions (HTS1). Shown are the comparisons of four independent LOPAC runs.
(TIFF)
Plate positional effects during LOPAC experiments. (A) Mean percent inhibition of the LOPAC ± detergent, sorted by either plate row or column. Boxes represent one standard deviation from the mean, whiskers span the 10 to 90 percentiles and dots represent outliers. (B) Heat maps of the percent inhibition results from the LOPAC plates. Each position represents the mean of the replicate LOPAC experiments ± detergent. HTS1 = no detergent; HTS2 = detergent.
(TIFF)
Trellis plot of individual plate heat maps. Plates are arranged by order screened. HTS1 spans plates 1–259, HTS2 spans plates 260–715.
(TIFF)
Whole-HTS plate positional effects. (A) Cumulative heat map showing the mean percent inhibition for each well position. (B) Cumulative mean percent inhibition and the number of actives, sorted by either row or column. Boxes represent one standard deviation from the mean, whiskers span the 10 to 90 percentiles. (C) Heat map showing the number of active compounds for each well position (greater than three standard deviations above the mean percent inhibition).
(TIFF)
Analysis of HTS results in the absence of detergent (HTS1). (A) Mean percent inhibition (top panels) and the number of actives (bottom panels; compounds with greater than three standard deviations above the mean percent inhibition for HTS1), sorted by either plate row or column. Boxes represent one standard deviation from the HTS1 mean, whiskers span the 10 to 90 percentiles. (B) Heat map showing the mean percent inhibition for each well position in HTS1. (C) Heat map showing the number of active compounds for each well position in HTS1.
(TIFF)
Analysis of HTS results in the presence of detergent (HTS2). (A) Mean percent inhibition (top panels) and the number of actives (bottom panels; compounds with greater than three standard deviations above the mean percent inhibition for HTS2), sorted by either plate row or column. Boxes represent one standard deviation from the HTS2 mean, whiskers span the 10 to 90 percentiles. (B) Heat map showing the mean percent inhibition for each well position in HTS2. (C) Heat map showing the number of active compounds for each well position in HTS2.
(TIFF)
Fluorescence quenching counter-screen. Pre-formed CPM-CoA solutions were spiked with either DMSO or test compounds. Data is expressed as the fluorescence intensity of spiked solutions relative to DMSO controls. Fluconazole = negative control compound; BHQ-1 = positive control compound.
(TIFF)
Assay interference counter-screen. Select compounds were incubated with CoA and then CPM under HTS-like conditions, minus proteins and acetyl-CoA. Fluconazole = negative control compound.
(TIFF)
Redox-activity and aggregation counter-screens. (A) Redox-activity of selected compounds using a surrogate HRP-phenol red assay. Fluconazole = negative compound control; NSC-663284 and 4-amino-1-naphthol = positive compound controls. Neither positive compound control showed detectable absorbance at 610 nm in assay buffer (data not shown). (B) Aggregation tendencies of selected compounds using a surrogate β-lactamase-nitrocefin assay. Compounds were tested at 10 µM final concentrations. Lidocaine = negative aggregation control; rottlerin = positive aggregation control. Percent inhibitions calculated based on DMSO controls.
(TIFF)