

Abstract
Using the ImmunoChip custom genotyping array, we analysed 14,498 multiple sclerosis subjects and 24,091 healthy controls for 161,311 autosomal variants and identified 135 potentially associated regions (p-value < 1.0 × 10⁻⁴). In a replication phase, we combined these data with previous genome-wide association study (GWAS) data from an independent 14,802 multiple sclerosis subjects and 26,703 healthy controls. In these 80,094 individuals of European ancestry we identified 48 new susceptibility variants (p-value < 5.0 × 10⁻⁸); three found after conditioning on previously identified variants. Thus, there are now 110 established multiple sclerosis risk variants in 103 discrete loci outside of the Major Histocompatibility Complex. With high resolution Bayesian fine-mapping, we identified five regions where one variant accounted for more than 50% of the posterior probability of association. This study enhances the catalogue of multiple sclerosis risk variants and illustrates the value of fine-mapping in the resolution of GWAS signals.
Multiple sclerosis (OMIM 126200) is an inflammatory demyelinating disorder of the central nervous system that is a common cause of chronic neurological disability.1,2 It has its greatest prevalence amongst individuals of Northern European ancestry3 and is moderately heritable,4 with a sibling relative recurrence risk (λs) of ~ 6.3.5 Aside from the early success in demonstrating the important effects exerted by variants in the Human Leukocyte Antigen (HLA) genes from the Major Histocompatibility Complex (MHC),6 there was little progress in unravelling the genetic architecture underlying multiple sclerosis susceptibility prior to the advent of genome-wide association studies (GWAS). Over the last decade, our Consortium has performed several GWAS and meta-analyses in large cohorts, 7-10 cumulatively identifying more than 50 non-MHC susceptibility alleles. As in other complex diseases, available data suggest that many additional susceptibility alleles remain to be identified.11
The striking overlap in the genetic architecture underlying susceptibility to autoimmune diseases9,10,12,13 prompted the collaborative construction of the “ImmunoChip” (see Supplementary Note and Supplementary Figs. 1 and 2 for details of IMSGC nominated content), an efficient genotyping platform designed to deeply interrogate 184 non-MHC loci with genome-wide significant associations to at least one autoimmune disease and provide lighter coverage of other genomic regions with suggestive evidence of association.14 Here, we report a large-scale effort that leverages the ImmunoChip to detect association with multiple sclerosis susceptibility and refine these associations via Bayesian fine-mapping.
After stringent quality control (QC), we report genotypes on 28,487 individuals of European ancestry (14,498 multiple sclerosis subjects, 13,989 healthy controls) that are independent of previous GWAS efforts. We supplemented these data with 10,102 independent control subjects provided by the International Inflammatory Bowel Disease Genetics Consortium (IIBDGC)15 bringing the total to 38,589 individuals (14,498 multiple sclerosis subjects and 24,091 healthy controls). We performed variant level QC, population outlier identification, and subsequent case-control analysis in 11 country-organized strata. To account for within-stratum population stratification we used the first five principal components as covariates in the association analysis. Per stratum odds ratios (OR) and respective standard errors (SE) were then combined with an inverse variance meta-analysis under a fixed effects model. In total we tested 161,311 autosomal variants that passed QC in at least two of the 11 strata (Online Methods). A circos plot16 summarising the results from this discovery phase analysis is shown in Figure 1.
Figure 1. Discovery phase results.
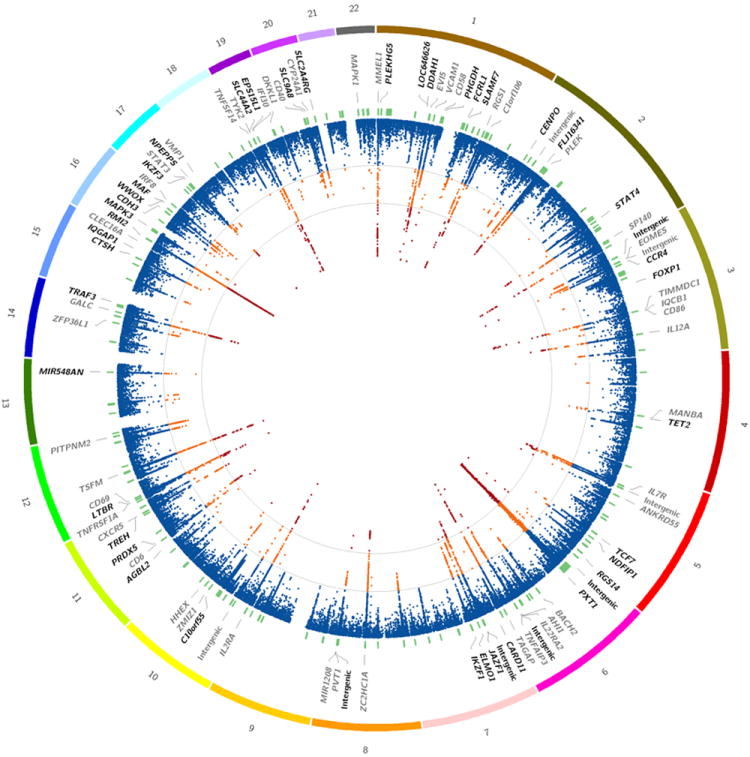
Primary association analysis of 161,311 autosomal variants in the discovery phase (based on 14,498 cases and 24,091 healthy controls). The outer most track shows the numbered autosomal chromosomes. The second track indicates the gene closest to the most associated SNP meeting all replication criteria. Previously identified associations are indicated in grey. The third track indicates the physical position of the 184 fine-mapping intervals (green). The inner most track indicates −log(p) (two-sided) for each SNP (scaled from 0-12 which truncates the signal in several regions, see Supplementary Table 1). Additionally, contour lines are given at the a priori discovery(−log(p) = 4) and genome-wide significance (-log(p) = 7.3) thresholds. Orange indicates -log(p) ≥ 4 and < 7.3, while red indicates −log(p) ≥ 7.3. Details of the full discovery phase results can be found in ImmunoBase.
We defined an a priori discovery threshold of p-value <1 × 10⁻⁴ and identified 135 primary statistically independent association signals; 67 in the designated fine-mapping regions and 68 in less densely covered regions selected for deep replication of earlier GWAS. Another 13 secondary and 2 tertiary statistically independent signals were identified by forward stepwise logistic regression. A total of 48 of the 150 statistically independent association signals (Supplementary Table 1) reached a genome-wide significance p-value <5 × 10⁻⁸ at the discovery phase alone. Next, we replicated our findings in 14,802 multiple sclerosis subjects and 26,703 healthy controls with available GWAS data imputed to the 1000 Genomes European phase I (a) panel (Online Methods). Finally, we performed a joint analysis of the discovery and replication phases.
We identified 97 statistically independent SNPs meeting replication criteria (preplication < 0.05, pjoint < 5 × 10⁻⁸, and pjoint < pdiscovery); 93 primary signals (Supplementary Figs. 3-95) and four secondary signals. Of these, 48 are novel to multiple sclerosis (Table 1) and 49 correspond to previously identified multiple sclerosis effects (Table 2). An additional 11 independent SNPs showed suggestive evidence of association (pjoint < 1 × 10⁻⁶) (Supplementary Table 2).
Table 1.
48 Novel non-MHC susceptibility loci associated with multiple sclerosis at a genome-wide significance level
| Discovery | Replication | Joint | |||||||||||
|---|---|---|---|---|---|---|---|---|---|---|---|---|---|
|
| |||||||||||||
| SNP | Chr | Positiona | RA | RAF | P-value | OR | RAF | P-value | OR | P-value | OR | Geneb | Function |
| rs3007421 | 1 | 6530189 | A | 0.12 | 9.6 × 10⁻⁷ | 1.12 | 0.13 | 8.8 × 10⁻⁵ | 1.10 | 4.7 × 10⁻¹⁰ | 1.11 | PLEKHG5 | intronic |
| rs12087340 | 1 | 85746993 | A | 0.09 | 5.1 × 10⁻¹² | 1.22 | 0.09 | 2.9 × 10⁻¹⁰ | 1.20 | 1.1 × 10⁻²⁰ | 1.21 | BCL10 | intergenic |
| rs11587876 | 1 | 85915183 | A | 0.79 | 8.4 × 10⁻⁸ | 1.12 | 0.81 | 2.9 × 10⁻³ | 1.06 | 4.4 × 10⁻⁹ | 1.09 | DDAH1 | intronic |
| rs666930 | 1 | 120258970 | G | 0.53 | 7.5 × 10⁻⁸ | 1.09 | 0.53 | 1.3 × 10⁻⁵ | 1.07 | 6.0 × 10⁻¹² | 1.08 | PHGDH | intronic |
| rs2050568 | 1 | 157770241 | G | 0.53 | 1.3 × 10⁻⁶ | 1.08 | 0.54 | 2.3 × 10⁻⁵ | 1.07 | 1.5 × 10⁻¹⁰ | 1.08 | FCRL1 | intronic |
| rs35967351 | 1 | 160711804 | A | 0.67 | 1.7 × 10⁻⁶ | 1.09 | 0.68 | 5.9 × 10⁻⁶ | 1.09 | 4.4 × 10⁻¹¹ | 1.09 | SLAMF7 | intronic |
| rs4665719 | 2 | 25017860 | G | 0.25 | 6.8 × 10⁻⁶ | 1.09 | 0.25 | 1.1 × 10⁻⁴ | 1.08 | 3.1 × 10⁻⁹ | 1.08 | CENPO | intronic |
| rs842639 | 2 | 61095245 | A | 0.65 | 1.7 × 10⁻⁹ | 1.11 | 0.67 | 1.4 × 10⁻⁶ | 1.09 | 2.0 × 10⁻¹⁴ | 1.10 | FLJ16341 | ncRNA |
| rs9967792 | 2 | 191974435 | G | 0.62 | 1.8 × 10⁻⁹ | 1.11 | 0.64 | 1.2 × 10⁻⁴ | 1.07 | 3.5 × 10⁻¹² | 1.09 | STAT4 | intronic |
| rs11719975 | 3 | 18785585 | C | 0.27 | 5.4 × 10⁻⁶ | 1.09 | 0.28 | 4.1 × 10⁻⁴ | 1.07 | 1.1 × 10⁻⁸ | 1.08 | intergenic | |
| rs4679081 | 3 | 33013483 | G | 0.52 | 1.2 × 10⁻⁵ | 1.08 | 0.55 | 3.7 × 10⁻⁴ | 1.07 | 2.2 × 10⁻⁹ | 1.07 | CCR4 | intergenic |
| rs9828629 | 3 | 71530346 | G | 0.62 | 5.5 × 10⁻⁶ | 1.08 | 0.64 | 8.5 × 10⁻⁶ | 1.08 | 1.9 × 10⁻¹⁰ | 1.08 | FOXP1 | intronic |
| rs2726518 | 4 | 106173199 | C | 0.55 | 1.2 × 10⁻⁵ | 1.09 | 0.58 | 4.7 × 10⁻⁴ | 1.06 | 3.9 × 10⁻⁸ | 1.07 | TET2 | intronic |
| rs756699 | 5 | 133446575 | A | 0.87 | 3.0 × 10⁻⁶ | 1.12 | 0.88 | 6.5 × 10⁻⁶ | 1.11 | 8.8 × 10⁻¹¹ | 1.12 | TCF7 | intergenic |
| nonec | 5 | 141506564 | C | 0.61 | 6.0 × 10⁻⁵ | 1.07 | 0.62 | 1.5 × 10⁻⁵ | 1.08 | 3.6 × 10⁻⁹ | 1.07 | NDFIP1 | intronic |
| rs4976646 | 5 | 176788570 | G | 0.34 | 1.0 × 10⁻¹² | 1.13 | 0.36 | 5.0 × 10⁻⁷ | 1.10 | 4.4 × 10⁻¹⁸ | 1.12 | RGS14 | intronic |
| rs17119 | 6 | 14719496 | A | 0.81 | 1.9 × 10⁻⁶ | 1.11 | 0.80 | 1.2 × 10⁻⁵ | 1.10 | 1.0 × 10⁻¹⁰ | 1.10 | intergenic | |
| rs941816 | 6 | 36375304 | G | 0.18 | 4.5 × 10⁻⁹ | 1.13 | 0.20 | 8.3 × 10⁻⁵ | 1.08 | 3.9 × 10⁻¹² | 1.11 | PXT1 | intronic |
| rs1843938 | 7 | 3113034 | A | 0.44 | 2.2 × 10⁻⁶ | 1.08 | 0.44 | 1.1 × 10⁻⁵ | 1.08 | 1.2 × 10⁻¹⁰ | 1.08 | CARD11 | intergenic |
| rs706015 | 7 | 27014988 | C | 0.18 | 1.3 × 10⁻⁹ | 1.14 | 0.18 | 9.9 × 10⁻³ | 1.06 | 1.1 × 10⁻⁹ | 1.10 | intergenic | |
| rs917116 | 7 | 28172739 | C | 0.20 | 2.1 × 10⁻⁸ | 1.12 | 0.21 | 5.8 × 10⁻³ | 1.06 | 3.3 × 10⁻⁹ | 1.09 | JAZF1 | intronic |
| rs60600003 | 7 | 37382465 | C | 0.10 | 2.5 × 10⁻⁸ | 1.16 | 0.10 | 4.2 × 10⁻⁷ | 1.14 | 6.0 × 10⁻¹⁴ | 1.15 | ELMO1 | intronic |
| rs201847125d | 7 | 50325567 | G | 0.70 | 2.9 × 10⁻⁸ | 1.11 | 0.70 | 6.7 × 10⁻⁵ | 1.09 | 1.2 × 10⁻¹¹ | 1.10 | IKZF1 | intergenic |
| rs2456449 | 8 | 128192981 | G | 0.36 | 2.2 × 10⁻⁸ | 1.10 | 0.37 | 3.8 × 10⁻³ | 1.05 | 1.8 × 10⁻⁹ | 1.08 | intergenic | |
| rs793108 | 10 | 31415106 | A | 0.50 | 5.6 × 10⁻⁸ | 1.09 | 0.51 | 1.8 × 10⁻⁵ | 1.07 | 6.1 × 10⁻¹² | 1.08 | intergenic | |
| rs2688608 | 10 | 75658349 | A | 0.55 | 6.4 × 10⁻⁵ | 1.07 | 0.56 | 2.0 × 10⁻⁴ | 1.06 | 4.6 × 10⁻⁸ | 1.07 | C10orf55 | intergenic |
| rs7120737 | 11 | 47702395 | G | 0.15 | 7.6 × 10⁻⁸ | 1.13 | 0.15 | 1.0 × 10⁻³ | 1.08 | 1.0 × 10⁻⁹ | 1.10 | AGBL2 | intronic |
| rs694739 | 11 | 64097233 | A | 0.62 | 1.3 × 10⁻⁵ | 1.08 | 0.62 | 3.8 × 10⁻⁵ | 1.07 | 2.0 × 10⁻⁹ | 1.07 | PRDX5 | intergenic |
| rs9736016 | 11 | 118724894 | T | 0.63 | 2.2 × 10⁻⁸ | 1.10 | 0.63 | 2.6 × 10⁻⁸ | 1.10 | 3.0 × 10⁻¹⁵ | 1.10 | CXCR5 | intergenic |
| rs12296430 | 12 | 6503500 | C | 0.19 | 3.6 × 10⁻¹⁰ | 1.14 | 0.21 | 1.7 × 10⁻⁵ | 1.09 | 7.2 × 10⁻¹⁴ | 1.12 | LTBR | intergenic |
| rs4772201 | 13 | 100086259 | A | 0.82 | 1.7 × 10⁻⁷ | 1.12 | 0.83 | 1.1 × 10⁻⁴ | 1.09 | 1.3 × 10⁻¹⁰ | 1.10 | MIR548AN | intergenic |
| rs12148050 | 14 | 103263788 | A | 0.35 | 1.5 × 10⁻⁵ | 1.08 | 0.36 | 4.3 × 10⁻⁹ | 1.10 | 5.1 × 10⁻¹³ | 1.09 | TRAF3 | intronic |
| rs59772922 | 15 | 79207466 | A | 0.83 | 4.0 × 10⁻⁶ | 1.11 | 0.83 | 5.4 × 10⁻⁴ | 1.08 | 1.2 × 10⁻⁸ | 1.09 | CTSH | intergenic |
| rs8042861 | 15 | 90977333 | A | 0.44 | 9.8 × 10⁻⁷ | 1.08 | 0.45 | 3.4 × 10⁻⁴ | 1.06 | 2.2 × 10⁻⁹ | 1.07 | IQGAP1 | intronic |
| rs6498184 | 16 | 11435990 | G | 0.81 | 2.1 × 10⁻¹⁰ | 1.15 | 0.82 | 6.5 × 10⁻⁹ | 1.14 | 7.4 × 10⁻¹⁸ | 1.15 | RMI2 | intergenic |
| rs7204270* | 16 | 30156963 | G | 0.50 | 9.3 × 10⁻⁸ | 1.09 | 0.49 | 3.7 × 10⁻⁵ | 1.08 | 1.6 × 10⁻¹¹ | 1.09 | MAPK3 | intergenic |
| rs1886700 | 16 | 68685905 | A | 0.14 | 8.8 × 10⁻⁶ | 1.11 | 0.14 | 3.2 × 10⁻⁴ | 1.08 | 1.3 × 10⁻⁸ | 1.10 | CDH3 | intronic |
| rs12149527 | 16 | 79110596 | A | 0.47 | 1.7 × 10⁻⁶ | 1.08 | 0.47 | 4.3 × 10⁻⁶ | 1.08 | 3.3 × 10⁻¹¹ | 1.08 | WWOX | intronic |
| rs7196953 | 16 | 79649394 | A | 0.29 | 2.6 × 10⁻⁵ | 1.08 | 0.30 | 7.9 × 10⁻⁷ | 1.09 | 1.0 × 10⁻¹⁰ | 1.09 | MAF | intergenic |
| rs12946510 | 17 | 37912377 | A | 0.47 | 8.5 × 10⁻⁶ | 1.08 | 0.48 | 8.0 × 10⁻⁵ | 1.07 | 2.9 × 10⁻⁹ | 1.07 | IKZF3 | intergenic |
| rs4794058 | 17 | 45597098 | A | 0.50 | 1.6 × 10⁻⁵ | 1.07 | 0.52 | 3.5 × 10⁻¹⁰ | 1.11 | 1.0 × 10⁻¹³ | 1.09 | NPEPPS | intergenic |
| rs2288904 | 19 | 10742170 | G | 0.77 | 9.6 × 10⁻¹⁰ | 1.14 | 0.78 | 5.4 × 10⁻⁴ | 1.07 | 1.6 × 10⁻¹¹ | 1.10 | SLC44A2 | exonic |
| rs1870071 | 19 | 16505106 | G | 0.29 | 5.7 × 10⁻¹⁰ | 1.12 | 0.30 | 4.6 × 10⁻⁷ | 1.09 | 2.0 × 10⁻¹⁵ | 1.10 | EPS15L1 | intronic |
| rs17785991 | 20 | 48438761 | A | 0.35 | 6.4 × 10⁻⁷ | 1.09 | 0.34 | 5.9 × 10⁻³ | 1.05 | 4.2 × 10⁻⁸ | 1.07 | SLC9A8 | intronic |
| rs2256814 | 20 | 62373983 | A | 0.19 | 8.3 × 10⁻⁷ | 1.11 | 0.21 | 6.4 × 10⁻⁴ | 1.08 | 3.5 × 10⁻⁹ | 1.09 | SLC2A4RG | intronic |
| Secondary | |||||||||||||
| rs7769192e | 6 | 137962655 | G | 0.55 | 1.3 × 10⁻⁵ | 1.08 | 0.54 | 5.1 × 10⁻⁵ | 1.07 | 3.3 × 10⁻⁹ | 1.08 | intergenic | |
| rs533646f | 11 | 118566746 | G | 0.68 | 3.6 × 10⁻⁷ | 1.10 | 0.68 | 3.9 × 10⁻⁵ | 1.08 | 7.6 × 10⁻¹¹ | 1.09 | TREH | intergenic |
| rs4780346g | 16 | 11288806 | A | 0.23 | 6.8 × 10⁻⁶ | 1.09 | 0.25 | 1.5 × 10⁻⁵ | 1.09 | 4.4 × 10⁻¹⁰ | 1.09 | CLEC16A | intergenic |
All listed signals had a discovery P-value ≤ 1.0 × 10⁻⁴, a replication P-value ≤ 5.0 × 10⁻², and a joint P-value ≤ 5.0 × 10⁻⁸
All P-values are two-sided
RA= Risk Allele, RAF = Risk Allele Frequency
Position is based on human genome 19 and dbSNP 137.
Nearest gene listed if within 50Kb. Bold indicates Gene Ontology Immune System Process.
A proxy SNP (rs1036207, r2 = 0.99) and
(rs716719, r2=1.00) was used in replication.
The P-value and OR values provided are after conditioning on rs67297943 (Known – see Table 2),
rs9736016, and
rs12927355 (Known – see Table 2).
Note primary was rs11865086 (P-value = 1.77 × 10⁻⁸) in Discovery but not available in Replication so the best proxy was used.
Table 2.
49 Known non-MHC susceptibility loci associated with multiple sclerosis at a genome-wide significance level
| Discovery | Replication | Joint | |||||||||||
|---|---|---|---|---|---|---|---|---|---|---|---|---|---|
|
| |||||||||||||
| SNP | Chr | Positiona | RA | RAF | P-value | OR | RAF | P-value | OR | P-value | OR | Geneb | Function |
| rs3748817 | 1 | 2525665 | A | 0.64 | 1.3 × 10⁻¹² | 1.14 | 0.65 | 1.2 × 10⁻¹⁵ | 1.15 | 1.3 × 10⁻²⁶ | 1.14 | MMEL1 | intronic |
| rs41286801 | 1 | 92975464 | A | 0.14 | 7.9 × 10⁻¹⁶ | 1.20 | 0.16 | 2.1 × 10⁻¹² | 1.17 | 1.4 × 10⁻²⁶ | 1.19 | EVI5 | UTR3 |
| rs7552544* | 1 | 101240893 | A | 0.56 | 3.7 × 10⁻⁶ | 1.08 | 0.43 | 3.3 × 10⁻¹² | 1.12 | 1.9 × 10⁻¹⁶ | 1.10 | VCAM1 | intergenic |
| rs6677309 | 1 | 117080166 | A | 0.88 | 1.5 × 10⁻²⁸ | 1.34 | 0.88 | 4.1 × 10⁻¹⁶ | 1.24 | 5.4 × 10-42 | 1.29 | CD58 | intronic |
| rs1359062 | 1 | 192541472 | C | 0.82 | 1.8 × 10⁻¹³ | 1.18 | 0.83 | 2.1 × 10⁻⁸ | 1.13 | 4.8 × 10⁻²⁰ | 1.15 | RGS1 | intergenic |
| rs55838263 | 1 | 200874728 | A | 0.71 | 1.4 × 10⁻⁹ | 1.12 | 0.71 | 3.9 × 10⁻¹¹ | 1.13 | 4.0 × 10⁻¹⁹ | 1.13 | C1orf106 | intronic |
| rs2163226 | 2 | 43361256 | A | 0.71 | 7.0 × 10⁻⁸ | 1.10 | 0.73 | 3.8 × 10⁻¹⁰ | 1.14 | 2.1 × 10⁻¹⁶ | 1.12 | intergenic | |
| rs7595717 | 2 | 68587477 | A | 0.26 | 3.3 × 10⁻⁷ | 1.10 | 0.27 | 6.8 × 10⁻⁸ | 1.10 | 1.2 × 10⁻¹³ | 1.10 | PLEK | intergenic |
| rs9989735 | 2 | 231115454 | C | 0.18 | 7.8 × 10⁻¹⁴ | 1.17 | 0.19 | 6.8 × 10⁻¹¹ | 1.14 | 4.2 × 10⁻²³ | 1.16 | SP140 | intronic |
| rs2371108 | 3 | 27757018 | A | 0.38 | 2.1 × 10⁻⁶ | 1.08 | 0.39 | 5.8 × 10⁻¹¹ | 1.12 | 1.5 × 10⁻¹⁵ | 1.10 | EOMES | downstream |
| rs1813375 | 3 | 28078571 | A | 0.47 | 5.7 × 10⁻¹⁸ | 1.15 | 0.49 | 4.4 × 10⁻¹⁶ | 1.15 | 1.9 × 10⁻³² | 1.15 | intergenic | |
| rs1131265 | 3 | 119222456 | C | 0.80 | 2.0 × 10⁻¹⁵ | 1.19 | 0.81 | 4.8 × 10⁻¹⁰ | 1.14 | 1.4 × 10⁻²³ | 1.17 | TIMMDC1 | exonic |
| rs1920296* | 3 | 121543577 | C | 0.64 | 6.8 × 10⁻¹⁵ | 1.14 | 0.64 | 5.5 × 10⁻⁹ | 1.10 | 6.5 × 10⁻²² | 1.12 | IQCB1 | intronic |
| rs2255214* | 3 | 121770539 | C | 0.52 | 5.3 × 10⁻¹³ | 1.13 | 0.52 | 3.3 × 10⁻¹³ | 1.13 | 1.2 × 10⁻²⁴ | 1.13 | CD86 | intergenic |
| rs1014486 | 3 | 159691112 | G | 0.43 | 1.2 × 10⁻⁹ | 1.11 | 0.44 | 1.4 × 10⁻¹⁰ | 1.11 | 1.1 × 10⁻¹⁸ | 1.11 | IL12A | intergenic |
| rs7665090 | 4 | 103551603 | G | 0.52 | 2.4 × 10⁻⁶ | 1.08 | 0.53 | 5.0 × 10⁻⁴ | 1.13 | 1.0 × 10⁻⁸ | 1.09 | MANBA | intergenic |
| rs6881706 | 5 | 35879156 | C | 0.72 | 4.9 × 10⁻⁹ | 1.12 | 0.73 | 1.7 × 10⁻⁹ | 1.12 | 4.3 × 10⁻¹⁷ | 1.12 | IL7R | intergenic |
| rs6880778 | 5 | 40399096 | G | 0.60 | 1.7 × 10⁻⁸ | 1.10 | 0.61 | 3.9 × 10⁻¹³ | 1.13 | 8.1 × 10⁻²⁰ | 1.12 | intergenic | |
| rs71624119 | 5 | 55440730 | G | 0.76 | 2.7 × 10⁻⁹ | 1.12 | 0.76 | 1.9 × 10⁻⁵ | 1.09 | 3.4 × 10⁻¹³ | 1.11 | ANKRD55 | intronic |
| rs72928038 | 6 | 90976768 | A | 0.17 | 7.6 × 10⁻⁷ | 1.11 | 0.19 | 9.0 × 10⁻¹¹ | 1.17 | 1.5 × 10⁻¹⁵ | 1.14 | BACH2 | intronic |
| rs11154801 | 6 | 135739355 | A | 0.37 | 2.3 × 10⁻⁹ | 1.11 | 0.37 | 1.0 × 10⁻¹² | 1.13 | 1.8 × 10⁻²⁰ | 1.12 | AHI1 | intronic |
| rs17066096 | 6 | 137452908 | G | 0.23 | 5.9 × 10⁻¹² | 1.14 | 0.25 | 4.1 × 10⁻¹³ | 1.15 | 1.6 × 10⁻²³ | 1.14 | IL22RA2 | intergenic |
| rs67297943 | 6 | 138244816 | A | 0.78 | 4.8 × 10⁻⁸ | 1.12 | 0.80 | 2.5 × 10⁻⁶ | 1.11 | 5.5 × 10⁻¹³ | 1.11 | TNFAIP3 | intergenic |
| rs212405 | 6 | 159470559 | T | 0.62 | 1.4 × 10⁻¹⁵ | 1.15 | 0.64 | 1.8 × 10⁻⁷ | 1.10 | 8.0 × 10⁻²¹ | 1.12 | TAGAP | intergenic |
| rs1021156 | 8 | 79575804 | A | 0.24 | 5.6 × 10⁻¹⁰ | 1.12 | 0.26 | 2.1 × 10⁻⁸ | 1.11 | 8.5 × 10⁻¹⁷ | 1.11 | ZC2HC1A | intergenic |
| rs4410871 | 8 | 128815029 | G | 0.72 | 2.0 × 10⁻⁹ | 1.12 | 0.72 | 3.4 × 10⁻⁸ | 1.11 | 4.3 × 10⁻¹⁶ | 1.11 | MIR1204 | intergenic |
| rs759648 | 8 | 129158945 | C | 0.31 | 2.8 × 10⁻⁶ | 1.09 | 0.31 | 3.7 × 10⁻⁵ | 1.08 | 5.0 × 10⁻¹⁰ | 1.08 | MIR1208 | intergenic |
| rs2104286 | 10 | 6099045 | A | 0.72 | 7.6 × 10⁻²³ | 1.21 | 0.73 | 3.6 × 10⁻²⁶ | 1.23 | 2.3 × 10-47 | 1.22 | IL2RA | intronic |
| rs1782645 | 10 | 81048611 | A | 0.43 | 4.3 × 10⁻⁷ | 1.09 | 0.41 | 6.2 × 10⁻¹⁰ | 1.11 | 2.5 × 10⁻¹⁵ | 1.10 | ZMIZ1 | intronic |
| rs7923837 | 10 | 94481917 | G | 0.61 | 4.6 × 10⁻⁹ | 1.11 | 0.62 | 2.0 × 10⁻⁹ | 1.11 | 4.3 × 10⁻¹⁷ | 1.11 | HHEX | intergenic |
| rs34383631 | 11 | 60793330 | A | 0.40 | 5.7 × 10⁻¹⁰ | 1.11 | 0.39 | 4.5 × 10⁻¹⁵ | 1.15 | 3.7 × 10⁻²³ | 1.13 | CD6 | intergenic |
| rs1800693 | 12 | 6440009 | G | 0.40 | 6.9 × 10⁻¹⁶ | 1.14 | 0.41 | 1.0 × 10⁻¹³ | 1.14 | 6.7 × 10⁻²⁸ | 1.14 | TNFRSF1A | intronic |
| rs11052877 | 12 | 9905690 | G | 0.36 | 5.4 × 10⁻⁹ | 1.10 | 0.38 | 1.2 × 10⁻⁵ | 1.08 | 5.6 × 10⁻¹³ | 1.09 | CD69 | UTR3 |
| rs201202118c | 12 | 58182062 | A | 0.67 | 7.4 × 10⁻¹³ | 1.14 | 0.67 | 1.6 × 10⁻¹⁰ | 1.12 | 9.0 × 10⁻²² | 1.13 | TSFM | intronic |
| rs7132277 | 12 | 123593382 | A | 0.19 | 1.9 × 10⁻⁶ | 1.10 | 0.19 | 1.4 × 10⁻⁸ | 1.13 | 1.9 × 10⁻¹³ | 1.12 | PITPNM2 | intronic |
| rs2236262 | 14 | 69261472 | A | 0.50 | 1.2 × 10⁻⁵ | 1.08 | 0.50 | 3.8 × 10⁻⁸ | 1.09 | 2.5 × 10⁻¹² | 1.08 | ZFP36L1 | intronic |
| rs74796499 | 14 | 88432328 | C | 0.95 | 8.5 × 10⁻¹¹ | 1.31 | 0.95 | 4.5 × 10⁻¹¹ | 1.33 | 2.4 × 10⁻²⁰ | 1.32 | GALC | intronic |
| rs12927355 | 16 | 11194771 | G | 0.68 | 8.2 × 10⁻²⁷ | 1.21 | 0.69 | 4.3 × 10⁻²¹ | 1.18 | 6.4 × 10-46 | 1.20 | CLEC16A | intronic |
| rs35929052 | 16 | 85994484 | G | 0.89 | 3.3 × 10⁻⁷ | 1.14 | 0.88 | 3.6 × 10⁻⁶ | 1.15 | 5.9 × 10⁻¹² | 1.15 | IRF8 | intergenic |
| rs4796791 | 17 | 40530763 | A | 0.36 | 1.8 × 10⁻⁸ | 1.10 | 0.36 | 1.2 × 10⁻¹³ | 1.14 | 3.7 × 10⁻²⁰ | 1.12 | STAT3 | intronic |
| rs8070345 | 17 | 57816757 | A | 0.45 | 5.4 × 10⁻¹⁶ | 1.14 | 0.46 | 1.9 × 10⁻⁹ | 1.10 | 2.2 × 10⁻²³ | 1.12 | VMP1 | intronic |
| rs1077667 | 19 | 6668972 | G | 0.79 | 3.5 × 10⁻¹³ | 1.16 | 0.79 | 8.4 × 10⁻¹³ | 1.16 | 1.7 × 10⁻²⁴ | 1.16 | TNFSF14 | intronic |
| rs34536443 | 19 | 10463118 | C | 0.95 | 1.2 × 10⁻⁸ | 1.28 | 0.96 | 2.9 × 10⁻⁷ | 1.30 | 1.8 × 10⁻¹⁴ | 1.29 | TYK2 | exonic |
| rs11554159 | 19 | 18285944 | G | 0.73 | 2.6 × 10⁻¹³ | 1.15 | 0.74 | 1.4 × 10⁻¹² | 1.15 | 1.9 × 10⁻²⁴ | 1.15 | IFI30 | exonic |
| rs8107548 | 19 | 49870643 | G | 0.25 | 2.0 × 10⁻⁶ | 1.09 | 0.26 | 2.5 × 10⁻¹⁰ | 1.13 | 5.7 × 10⁻¹⁵ | 1.11 | DKKL1 | intronic |
| rs4810485 | 20 | 44747947 | A | 0.25 | 1.8 × 10⁻⁵ | 1.08 | 0.25 | 1.4 × 10⁻¹² | 1.14 | 7.7 × 10⁻¹⁶ | 1.11 | CD40 | intronic |
| rs2248359 | 20 | 52791518 | G | 0.60 | 9.8 × 10⁻⁵ | 1.07 | 0.62 | 8.2 × 10⁻¹¹ | 1.12 | 2.0 × 10⁻¹³ | 1.09 | CYP24A1 | intergenic |
| rs2283792 | 22 | 22131125 | C | 0.51 | 1.1 × 10⁻⁶ | 1.08 | 0.53 | 5.4 × 10⁻¹¹ | 1.11 | 5.5 × 10⁻¹⁶ | 1.10 | MAPK1 | intronic |
| Secondary | |||||||||||||
| rs523604d | 11 | 118755738 | A | 0.53 | 2.5 × 10⁻⁷ | 1.09 | 0.54 | 4.0 × 10⁻⁹ | 1.11 | 6.2 × 10⁻¹⁵ | 1.10 | CXCR5 | intronic |
All listed signals had a discovery P-value ≤ 1.0 × 10⁻⁴, a replication P-value ≤ 5.0 × 10⁻², and a joint P-value ≤ 5.0 × 10⁻⁸
All P-values are two-sided
RA = Risk Allele, RAF = Risk Allele Frequency
Position is based on human genome 19 and dbSNP 137.
Nearest gene listed if within 50Kb. Bold indicates Gene Ontology Immune System Process.
A proxy SNP (rs10431552, r2 = 0.99) was used in replication.
The P-value and OR values provided are after conditioning on rs9736016 and rs533646 (both Novel – see Table 1).
These three SNPs were not primary in the 2011 GWAS, two were secondary and the third was tertiary in that study.
The strongest novel association, rs12087340 (pjoint = 1.1 × 10⁻²⁰, OR = 1.21), lies between BCL10 (B-cell CLL / lymphoma 10) and DDAH1 (dimethylarginine dimethylaminohylaminohydrolase 1). The protein encoded by BCL10 contains a caspase recruitment domain (CARD) and has been shown to activate NF-kappaB.17 The latter is a signalling molecule that plays an important role in controlling gene expression in inflammation, immunity, cell proliferation, and apoptosis. It has been pursued as a potential therapeutic target for multiple sclerosis.18 BCL10 is also reported to interact with other CARD domain containing proteins including CARD11.19 We have also identified a novel association of rs1843938 (pjoint = 1.2 × 10⁻¹⁰, OR = 1.08), which is only 30 kb from CARD11.
One novel SNP was found within an exon, rs2288904 (pjoint = 1.6 × 10⁻¹¹, OR= 1.10); a missense variant in SLC44A2 (solute carrier family 44, member 2). Notably, this variant is also reported as a monocyte-specifccis-acting eQTL for the antisense transcript of the nearby ILF3 (interleukin enhancer binding factor 3).20 This protein was first discovered to be a subunit of a nuclear factor found in activated T-cells, which is required for T-cell expression of IL2, an important molecule regulating many aspects of inflammation.
Of the 49 previously identified effects,9,10,21 37 are in designated fine-mapping regions, and 23 of these 37 signals were localized to a single gene based on genomic position (Supplementary Table 3). Recognizing that proximity does not necessarily indicate functional importance, this emphasizes the utility of dense mapping in localizing signals from a genome-wide screen. The ImmunoChip analysis furthered the understanding of previously proposed secondary signals at three loci (Supplementary Note and Supplementary Tables 4-6); in particular we showed that the effects of two previously proposed independent associations at the IL2RA locus are driven by a single variant, rs2104286.7,22.
In an effort to define the functionally relevant variants underlying these associations, we further studied the regions surrounding the 97 associated SNPs using both a Bayesian and frequentist approach in 6,356 multiple sclerosis subjects and 9,617 healthy controls from the UK (Online Methods).23 Based on imputation quality, fine-mapping was possible in 68 regions (Supplementary Table 7): 66 of 93 primary (Fig. 2A) and two of four secondary. Eight of the 68 regions were fine-mapped to high resolution (Table 3, Fig. 2B and Supplementary Fig. 96). One third of the variants identified in these eight regions were imputed, indicating reliance on imputation even with dense genotyping coverage.
Figure 2. Bayesian fine-mapping within primary regions of association.
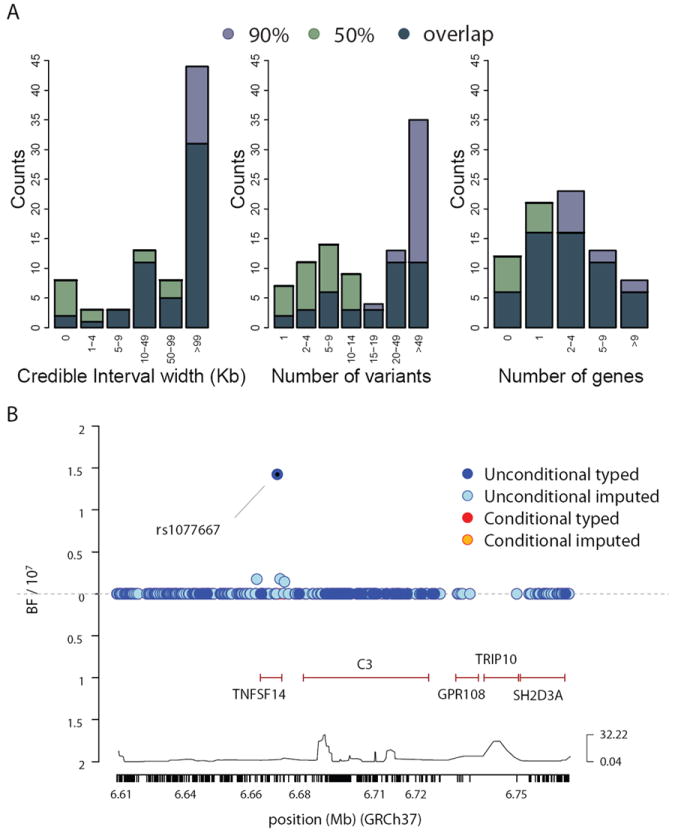
a) Summary of the extent of fine-mapping across 66 regions in 9,617 healthy controls from the UK, showing the the physical extent of, the number of variants, and the number of genes spanned by the posterior 90% and 50% credible sets. b) Detail of fine-mapping in region of TNFSF14. Above the x-axis indicates the Bayes Factor summarizing evidence for association for the SNPs prior to conditioning (blue markers) while below the x-axis indicates the Bayes Factor after conditioning on the lead SNP (rs1077667). Mb=Megabases.
Table 3.
The 18 variants from the 8 regions with consistent high resolution fine-mapping
| Gene | SNP | Chr | Positiona | Posterior | GERP | Functional Annotationb |
|---|---|---|---|---|---|---|
| TNFSF14 | rs1077667 | 19 | 6668972 | 0.74 | -3.89 | intronic, TFBS / DNase1 peak, correlates with serum levels of TNFSF14 |
| IL2RA | rs2104286 | 10 | 6099045 | 0.93 | -0.47 | intronic, correlates with soluble IL-2RA levels |
| TNFRSF1A | rs1800693 | 12 | 6440009 | 0.69 | 2.53 | intronic, causes splicing defect and truncated soluble TNFRSF1A |
| rs4149580c | 12 | 6446990 | 0.10 | 2.06 | intronic | |
| IL12A | rs1014486 | 3 | 159691112 | 0.67 | 0.24 | - |
| CD6 | rs34383631 | 11 | 60793330 | 0.20 | 1.66 | - |
| rs4939490c | 11 | 60793651 | 0.14 | -0.53 | - | |
| rs4939491c | 11 | 60793722 | 0.14 | -0.37 | - | |
| rs4939489 | 11 | 60793648 | 0.10 | 3.25 | - | |
| TNFAIP3 | rs632574 | 6 | 137959118 | 0.27 | -1.15 | - |
| rs498549c | 6 | 137984935 | 0.20 | 0.52 | - | |
| rs651973 | 6 | 137996134 | 0.17 | 2.41 | downstream of RP11-95M15.1 lincRNA gene | |
| rs536331 | 6 | 137993049 | 0.15 | 0.19 | upstream of RP11-95M15.1 lincRNA gene | |
| CD58 | rs6677309 | 1 | 117080166 | 0.21 | -1.18 | intronic, TFBS / DNase1 peak |
| rs35275493c | 1 | 117095502 | 0.24 | 0.75 | intronic (insertion) | |
| rs10754324c | 1 | 117093035 | 0.22 | 0.32 | intronic | |
| rs1335532 | 1 | 117100957 | 0.17 | -1.32 | intronic | |
| STAT4 | rs78712823 | 2 | 191958581 | 0.59 | -3.98 | intronic |
All listed variants have posterior ≥ 0.1 in regions where ≤ 5 variants explain the top 50% of the posterior and the top SNP from the frequentist analysis lives in the 90% confidence interval, ordered by maximum posterior.
Posterior denotes the posterior probability of any variant driving association. GERP denotes Genomic Evolutionary Rate Profiling.
Position is based on human genome 19 and dbSNP 137.
Functional data from VEP, eQTL browser, Fairfax et al. (2012), pubmed searches, 1000G. Dash indicates intergenic with no additional annotation. Variants without annotation are intergenic and have no reported regulatory consequence.
Imputed variant.
To assess whether functional annotation24 provides clues about the molecular mechanisms associated with genetic risk, we considered the relationship of variants to described coding and regulatory features in these eight regions. Although we found no variants with missense or nonsense effects, there was a notable enrichment for variants with functional effects: one known to affect splicing,25 three known to correlate with RNA or serum protein levels22,26,27 and several in transcription-factor binding and DNase I hypersensitive sites.28, 29 Four of the 18 variants in the fine-mapped regions are within conserved regions (GERP > 2).30 This lack of functional annotation likely reflects the limited repertoire of reference expression and epigenomic profiles and suggests that the function of the variants may be cell-type or cell-state specific, as has been reported for many eQTLs in immune cell types.20
To determine the Gene Ontology (GO) processes of the 97 associated variants, we used MetaCore from Thomson Reuters (Online Methods). We found the majority of the 97 variants lie within 50 kb of genes having immunological function. Of the 86 unique genes represented, 35 are linked to the GO immune system process (Table 1 and Table 2). We do not see a substantial over- or under- representation of certain GO processes when comparing the novel and previously identified loci, but this may be a limitation of ImmunoChip targeting genomic loci enriched for immunologically active genes, with more subtle distinctions between them not adequately captured by broad annotations such as GO.
Finally, we explored the overlap between our findings and those in autoimmune diseases with reported ImmunoChip analyses. We calculated the percentage of multiple sclerosis signals (110 non-MHC, Supplementary Table 8) overlapping those of other autoimmune diseases by requiring an r2 ≥ 0.8 between the best variants reported in each study using SNAP.31 In total we find that ~22% of our signals overlap at least one other autoimmune disease. More specificially, ~9.1% overlap with inflammatory bowel disease (IBD) - ~7.3% with ulcerative colitis (UC), ~9.1% with Crohn’s disease (CD) -15, ~9.1% with primary biliary cirrhosis (PBC),32, 33 ~4.5% with celiac disease (CeD),34 ~4.5% with rheumatoid arthritis (RhA),35 ~0.9% with psoriasis (PS),36 and ~2.7% with autoimmune thyroid disease (AITD).37 We report the same top variant seen in PBC for 7 loci. We also note that our best TYK2 variant (rs34536443)38 is also the most associated variant for PBC, PS and RhA. Lastly, AITD, CeD, PBC, and RhA report variants with pairwise r2 ≥ 0.8 to the multiple sclerosis variant near MMEL139 (Supplementary Table 8).
In summary, we have identified 48 new multiple sclerosis susceptibility variants. These novel loci expand our understanding of the immune system processes implicated in multiple sclerosis. We estimate that the 110 non-MHC established risk variants explain 20% of the sibling recurrence risk; 28% including the already identified MHC effects9 (Supplementary Note). Additionally, we have identified five regions where consistent high resolution fine-mapping implicated one variant which accounted for more than 50% of the posterior in previously identified regions of TNFSF14, IL2RA, TNFRSF1A, IL12A, and STAT4. Our study further implicates NF-kappaB in multiple sclerosis pathobiology18, emphasizes the value of dense fine-mapping in large follow-up data sets, and exposes the urgent need for functional annotation in relevant tissues. Understanding the implicated networks and their relation to environmental risk factors will promote the development of rational therapies and may enable the development of preventive strategies.
Online Methods
ImmunoChip data (discovery set)
Details of case ascertainment, processing and genotyping for the discovery phase are provided in the Supplementary Note (Supplementary Table 9). Genotype calling for all samples was performed using Opticall.40 Samples that performed poorly or were determined to be related were removed (Supplementary Table 10). The data were organized in 11 country level strata: ANZ (Australia + New Zealand), Belgium, Denmark, Finland, France, Germany, Italy, Norway, Sweden, United Kingdom (UK), and the United States of America (USA). SNP level quality control (Supplementary Table 11) and population outlier identification using principal components analysis (Supplementary Fig. 97) were done in each stratum separately.
Discovery set analysis
We applied logistic regression, assuming a per-allelic genetic model per data set, including the first five principal components as covariates to correct for population stratification (Supplementary Table 12 lists the per data set genomic inflation factors, λ). We then performed an inverse-variance meta-analysis of the 11 strata, under a fixed effects model, as implemented in PLINK.41 To be more conservative and account for any residual inflation in the test statistic, we applied the genomic control equivalent to the per-SNP standard error in each stratum. Specifically, we corrected the SNP standard errors by multiplying them with the square root of the raw genomic inflation factor λ, per data set, if the λ was >1.
Within the designated fine-mapping intervals, we applied a forward stepwise logistic regression to identify statistically independent effects. The primary SNP in each interval was included as a covariate, and the association analysis was repeated for the remaining SNPs. This process was repeated until no SNPs reached the minimum level of significance (p-value <1 × 10⁻⁴). Outside of the designated fine-mapping intervals, all SNPs having a p-value <1 × 10⁻⁴ were identified and grouped into sets based on a physical distance of less than 2Mb and a similar stepwise regression model was applied. Any SNPs to enter the model with p-value <1 × 10⁻⁴ after conditioning were considered statistically independent primary signals.
In addition, because of the close physical proximity between some fine-mapping intervals and SNP sets, independence was tested for all identified signals within 2Mb of one another. The and cluster plots (Supplementary Fig. 98) of all independent SNPs were examined, and the SNP was excluded if unsatisfactory. If any SNP was excluded, the forward stepwise logistic regression within that fine-mapping interval or SNP set was repeated after removal of the SNP. During this process, 17 additional SNPs were excluded based on cluster or forest plot review.
Replication Set
The replication phase included GWAS data organized into 15 strata. Within each stratum, poorly performing samples (call rate < 95%, gender discordance, excess heterozygosity) and poorly performing SNPs (Hardy-Weinberg equilibrium (HWE) p-value <1 × 10⁻⁶, minor allele frequency (MAF) < 1%, call rate < 95%) were removed. Principal components analysis was performed to identify population outliers per stratum, and the genomic control inflation factor was < 1.1 for each. The data included in the final discovery and replication analyses are summarized in Supplementary Table 13 and Supplementary Table 14. All the samples used in the replication set were unrelated to those in the discovery set; verified by identity-by-descent analysis.
We attempted replication of all non-MHC independent signals that reached a discovery p-value of <1 × 10⁻⁴ in a meta-analysis set of GWAS. Each data set was imputed to the 1000 Genomes European phase I (a) panel using BEAGLE42 to maximize the overlap between the Immunochip SNP content and the GWAS data. Post-imputation genotypic probabilities were used in a logistic regression model, per stratum, to estimate SNP effect sizes and p-values. By using the post-imputation genotypic probabilities, we penalized SNPs that didn’t have good imputation quality, thus ensuring a conservative analysis. Furthermore, we accounted for population stratification in each data set by including the first five principal components in the logistic model. We then meta-analysed the effect size and respective standard errors of the 15 strata using a fixed effects model inverse-variance method. We applied the genomic control equivalent to the per-SNP standard error in each stratum, controlling for the respective genomic inflation factor λ (Supplementary Table 14).
To replicate the primary SNPs per identified signal in the discovery phase, we used the replication effect size and respective standard error. For the secondary and tertiary SNPs, we fitted the same exact models as in the discovery phase, per data set. We then performed fixed effects meta-analysis to estimate an effect size that corresponds to the same logistic model. In the case that a SNP was not present in the replication set, we replaced it with a perfectly tagging SNP, i.e. a SNP that had r2 and D’ equal to 1. If a perfectly tagging SNP was not available, we selected a SNP that had equivalent MAF and the highest possible r2 and D’. Estimation of r2 and D’ for this objective were based on the ImmunoChip control samples.
Joint analysis (discovery and replication sets)
The discovery and replication phase effect sizes and respective standards errors were meta-analysed under a fixed effects model. A SNP was considered replicated when all three of the following criteria were met: 1) replication p-value <5.0 × 10⁻², 2) joint p-value <5 × 10⁻⁸, and 3) the joint p-value was more statistically significant than the discovery p-value. SNPs that reached a p-value of <1 × 10⁻⁶ but did not pass the genome-wide threshold, were coined suggested if the above criteria 1) and 3) were met.
Fine-mapping of association signals
To fine-map signals of association we used a combination of imputation and Bayesian methodology.23 Around each of the 97 associated SNPs, 2Mb were isolated in the discovery and replication phase UK data as well as the European samples from the Phase 1 1000G.28 Forming the single largest cohort, only UK samples were considered to minimize the effects of differential imputation quality between populations of different ancestry. In addition to the previous quality control, SNPs with failed alignment or a difference in MAF > 10% between the typed cohorts and the 1000G samples, MAF < 1%, or HWE p-value <1.0 × 10⁻⁴ were removed.
Imputation was performed separately for the UK discovery and replication cohorts on each 2Mb region using the default settings of IMPUTEv2.43,44 Missing genotypes in the genotyped SNPs were not imputed, and any imputed SNP that failed the HWE and MAF threshold was subsequently removed. We carried out frequentist and Bayesian association tests on all SNPs in each cohort separately, assuming additivity, using the default settings of SNPTESTv2.45 Frequentist fixed-effect meta-analysis was carried out using the software META.46 Bayesian meta-analysis was carried out using an independence prior (near-identical results were obtained using a fixed-effect Bayesian meta-analysis).
To identify regions where reliable fine-mapping could be achieved, we used the information score (INFO, obtained from IMPUTEv2) as identified from the 1000G samples. Specifically, we measured the fraction of variants with both r2 > 0.5 and r2 > 0.8 to the primary associated variant, having greater than 50% and 80% INFO scores respectively. Regions where any SNP with r2 > 0.5 had INFO < 50% were excluded. We also excluded regions where the top hit from imputation had an INFO score less than 80%. Regions were considered to be fine-mapped with high quality when all variants with r2 > 0.8 had at least 80% INFO. Within these regions, we excluded variants where the inferred direction of association was opposite in the UK discovery and replication cohorts.
To measure the posterior probability that any single variant drives association, we calculated the Bayes Factor. Under the assumption that there is a single causal variant in the region, this is proportional to the probability that the variant drives the association.23 We identified the smallest set of variants that contained 90% and 50% of the posterior probability. We called a region successfully and consistently fine-mapped if there were at most five variants in the 50% confidence interval and the top SNP from the frequentist analysis lived in the 90% confidence interval. For these regions, we annotated variants with information about evolutionary conservation, predicted coding consequence, regulation, published associations to expression or DNase I hypersensitive sites using ANNOVAR,47 VEP,24 and the eQTL browser, a recent immune cell expression study20, and other literature.
Gene Ontology
To determine the GO processes for which our associated variants were involved, we used MetaCore from Thomson Reuters. We annotated the processes for the unique genes within 50Kb of the variants.
Cross disease comparison
In order to explore the potential overlap with variants identified across other autoimmune diseases, we calculated the percentage overlap of reported variants found in other ImmunoChip reports to our ImmunoChip results. The top variants reported as either novel or previously known in other ImmunoChip reports were compared with the 110 variants representing both our novel and previous discoveries in multiple sclerosis. In order for a signal to be considered as overlapping, we required an r2 ≥ 0.8 using the Pairwise LD function of the SNAP tool in European samples.31
Secondary analyses
We performed a severity based analysis of MSSS in cases only from the discovery phase (Supplementary Fig. 99). In addition, a transmission disequilibrium test was done in 633 trios to test for transmission of the 97 identified risk alleles (Supplementary Fig. 100). Details are given in the Supplementary Note.
Supplementary Material
Acknowledgments
We thank participants, referring nurses, physicians, and funders - National Institutes of Health, Wellcome Trust, UK MS Society, UK Medical Research Council, US National MS Society, Cambridge NIHR BRC, DeNDRon, Bibbi and Niels Jensens Foundation, Swedish Brain Foundation, Swedish Research Council, Knut and Alice Wallenberg Foundation, Swedish Heart-Lung Foundation, Foundation for Strategic Research, Stockholm County Council, Karolinska Institutet, Institut National de la Santé et de la Recherche Médicale, Fondation d’Aide pour la Recherche sur la Sclérose En Plaques, Association Française contre les Myopathies, GIS-IBISA, German Ministry for Education and Research, German Competence Network MS, Deutsche Forschungsgemeinschaft, Munich Biotec Cluster M4, Fidelity Biosciences Research Initiative, Research Foundation Flanders, Research Fund KU Leuven, Belgian Charcot Foundation, Gemeinnützige Hertie Stiftung, University Zurich, Danish MS Society, Danish Council for Strategic Research, Academy of Finland, Sigrid Juselius Foundation, Helsinki University, Italian MS Foundation, Fondazione Cariplo, Italian Ministry of University and Research, CRT Foundation of Turin, Italian Ministry of Health, Italian Institute of Experimental Neurology, MS association of Oslo, Norwegian Research Council, South Eastern Norwegian Health Authorities, Australian National Health and Medical Research Council, Dutch MS Foundation, Kaiser Permanente. We acknowledge British 1958 Birth Cohort, UK National Blood Service, Vanderbilt University Medical Center’s BioVU DNA Resources Core, Centre de Ressources Biologiques du Réseau Français d’Etude Génétique de la Sclérose en Plaques, Norwegian Bone Marrow Registry, Norwegian MS Registry and Biobank, North American Research Committee on MS Registry, Brigham and Womens Hospital PhenoGenetic Project and DILGOM funded by the Academy of Finland. See Supplementary Note for details.
Footnotes
Author Contributions
M.F.D., D. Booth, A.O., J.S., B. Fontaine, B.H., C. Martin, F.Z., S.D.’A., F.M.-B., B.T., H.F.H., I. Kockum, J. Hillert, T.O., J.R.O., R.H., L.F.B., C. Agliardi, L.A., L. Bernardinelli, V.B., S.B., B.B., L. Brundin, D. Buck, H. Butzkeuven, W. Camu, P.C., E.G.C., I.C., G.C., I.C.-R., B.A.C.C., G.D., S.R.D., A.D.S., B.D., M.D., I.E., F.E., N.E., J.F., A.F., I.Y.F., D.G., C. Graetz, A. Graham, C. Guaschino, C. Halfpenny, G. Hall, J. Harley, T.H., C. Hawkins, C. Hillier, J. Hobart, M.H., I.J., A.J., B.K., A. Kermode, T. Kilpatrick, K.K., T. Korn, H.K., C.L.-F., J.L.-S, M.H.L., M.A.L., G.L., B.A.L., C.M.L., F.L., J. Lycke, S.M., C.P.M., R.M., V.M., D.M., G. Mazibrada, J.M., K.M., G.N., R.N., P.N., F.P., S.E.P., H.Q., M. Reunanen, W.R., N.P.R., M. Rodegher, D.R., M. Salvetti, F.S., R.C.S., C. Schaefer, S. Shaunak, L.S., S. Shields, V.S., M. Slee, P.S.S., M. Sospedra, A. Spurkland, V.T., J.T., A.T., P.T., C.V.D., E.M.V., S.V., J.S.W., A.W., J.F.W., J.Z., E.Z., J.L.H., M.A.P.-V., G.S., D.H., S.L.H., A.C., P.D.J., S.J.S. and J.L.M. were involved with case ascertainment and phenotyping. A. Kemppinen, D. Booth, A. Goris, A.O., B. Fontaine, S.D.’A., F.M.-B., H.F.H., I. Kockum, M.B., J.R.O., L.F.B., IIBDGC, H.B.S., A. Baker, N.B., L. Bergamaschi, I.L.B., P.B., D. Buck, S.J.C., L. Corrado, L. Cosemans, I.C.-R., V.D., J.F., A.F., V.G., I.J., I. Konidari, V.L., C.M.L., M. Lindén, J. Link, C. McCabe, I.M., H.Q., M. Sorosina, E.S., H.W., P.D.J., S.J.S. and J.L.M. processed the DNA. A. Kemppinen, A.O., B. Fontaine, M.B., R.H., L.F.B., WTCCC2, IIBDGC, R.A., H.B.S., N.B., T.M.C.B., H. Blackburn, P.B., W. Carpentier, L. Corrado, I.C.-R., D.C., V.D., P. Deloukas, S.E., A.F., H.H., P.H., A. Hamsten, S.E.H., I.J., I. Konidari, C.L., M. Larsson, M. Lathrop, F.M., I.M., J.M., H.Q., F.S., M. Sorosina, C.V.D., J.W., D.H., P.D.J., S.J.S. and J.L.M. conducted and supervised the genotyping of samples. A.H.B., N.A.P., D.K.X., M.F.D., A. Kemppinen, C.C., T.S.S., C. Spencer, M.B., IIBDGC, C. Anderson, S.E.B., A.T.D., P. Donnelly, B. Fiddes, P.G., G. Hellenthal, S.E.H., L.M., M.P., N.C.S.-B., J.L.H., M.A.P.-V., G. McVean, P.D.J., S.J.S. and J.L.M. performed the statistical analysis. A.H.B., N.A.P., D.K.X., M.F.D., A. Kemppinen, C.C., T.S.S., C. Spencer, D. Booth, A. Goris, A.O., J.S., B. Fontaine, B.H., F.Z., S.D.’A., F.M.-B., H.F.H., I. Kockum, M.B., R.H., L.F.B., C. Agliardi, M.A., C. Anderson, R.A., H.B.S., A. Baker, G.B., N.B., J.B., C.B., L. Bernardinelli, A. Berthele, V.B., T.M.C.B., H. Blackburn, I.L.B., B.B., D. Buck, S.J.C., W. Camu, P.C., E.G.C., I.C., G.C., L. Corrado, L. Cosemans, I.C.-R., B.A.C.C., D.C., G.D., S.R.D., P. Deloukas, A.D.S., A.T.D., P. Donnelly, B.D., M.D., S.E., F.E., N.E., B. Fiddes, J.F., A.F., C.F., D.G., C. Gieger, C. Graetz, A. Graham, V.G., C. Guaschino, A. Hadjixenofontos, H.H., C. Halfpenny, P.H., G. Hall, A. Hamsten, J. Harley, T.H., C. Hawkins, G. Hellenthal, C. Hillier, J. Hobart, M.H., S.E.H., I.J., A.J., B.K., I. Konidari, H.K., C.L., M. Larsson, M. Lathrop, C.L.-F., M.A.L., V.L., G.L., B.A.L., C.M.L., F.M., C.P.M., R.M., V.M., G. Mazibrada, C. McCabe, I.M., L.M., K.M., R.N., M.P., S.E.P., H.Q., N.P.R., M. Rodegher, D.R., M. Salvetti, N.C.S.-B., R.C.S., C. Schaefer, S. Shaunak, L.S., S. Shields, M. Sospedra, A. Strange, J.T., A.T., E.M.V., A.W., J.F.W., J.W., J.Z., J.L.H., A.J.I., G. McVean, P.D.J., S.J.S. and J.L.M. collected and managed the project data. A.H.B., N.A.P., M.F.D., A. Kemppinen, C.C., T.S.S., C. Spencer, J.S., B.H., F.Z., S.D.’A., F.M.-B., H.F.H., J. Hillert, T.O., M.B., J.R.O., R.H., L.F.B., L.A., C. Anderson, G.B., J.B., C.B., A. Berthele, E.G.C., G.C., P. Donnelly, F.E., C.F., C. Gieger, C. Graetz, G. Hellenthal, M.J., T. Korn, M.A.L., R.M., M.P., M. Sospedra, A. Spurkland, A. Strange, J.W., J.L.H., M.A.P.-V., A.J.I., G.S., D.H., S.L.H., A.C., G. McVean, P.D.J., S.J.S. and J.L.M. contributed to the study concept and design. A.H.B., N.A.P., D.K.X., G. McVean, P.D.J., S.J.S. and J.L.M. prepared the manuscript. All authors reviewed the final manuscript.
The authors have no competing financial interests
URLs
ImmunoBase, http://www.immunobase.org/; eQTL browser, http://eqtl.uchicago.edu/; MetaCore, https://portal.genego.com/.
References
- 1.Gourraud PA, Harbo HF, Hauser SL, Baranzini SE. The genetics of multiple sclerosis: an up-to-date review. Immunol Rev. 2012;248:87–103. doi: 10.1111/j.1600-065X.2012.01134.x. [DOI] [PMC free article] [PubMed] [Google Scholar]
- 2.Nylander A, Hafler DA. Multiple sclerosis. J Clin Invest. 2012;122:1180–8. doi: 10.1172/JCI58649. [DOI] [PMC free article] [PubMed] [Google Scholar]
- 3.Compston A, et al. McAlpine’s Multiple Sclerosis. Churchill Livingstone; London: 2006. [Google Scholar]
- 4.Dyment DA, Yee IM, Ebers GC, Sadovnick AD. Multiple sclerosis in stepsiblings: recurrence risk and ascertainment. J Neurol Neurosurg Psychiatry. 2006;77:258–9. doi: 10.1136/jnnp.2005.063008. [DOI] [PMC free article] [PubMed] [Google Scholar]
- 5.Hemminki K, Li X, Sundquist J, Hillert J, Sundquist K. Risk for multiple sclerosis in relatives and spouses of patients diagnosed with autoimmune and related conditions. Neurogenetics. 2009;10:5–11. doi: 10.1007/s10048-008-0156-y. [DOI] [PubMed] [Google Scholar]
- 6.Jersild C, Svejgaard A, Fog T. HL-A antigens and multiple sclerosis. Lancet. 1972;1:1240–1. doi: 10.1016/s0140-6736(72)90962-2. [DOI] [PubMed] [Google Scholar]
- 7.IMSGC. Risk Alleles for Multiple Sclerosis Identified by a Genomewide Study. N Engl J Med. 2007;357:851–62. doi: 10.1056/NEJMoa073493. [DOI] [PubMed] [Google Scholar]
- 8.De Jager PL, et al. Meta-analysis of genome scans and replication identify CD6, IRF8 and TNFRSF1A as new multiple sclerosis susceptibility loci. Nat Genet. 2009;41:776–82. doi: 10.1038/ng.401. [DOI] [PMC free article] [PubMed] [Google Scholar]
- 9.IMSGC & WTCCC2. Genetic risk and a primary role for cell-mediated immune mechanisms in multiple sclerosis. Nature. 2011;476:214–9. doi: 10.1038/nature10251. [DOI] [PMC free article] [PubMed] [Google Scholar]
- 10.Patsopoulos NA, et al. Genome-wide meta-analysis identifies novel multiple sclerosis susceptibility loci. Ann Neurol. 2011;70:897–912. doi: 10.1002/ana.22609. [DOI] [PMC free article] [PubMed] [Google Scholar]
- 11.IMSGC. Evidence for polygenic susceptibility to multiple sclerosis--the shape of things to come. Am J Hum Genet. 2010;86:621–5. doi: 10.1016/j.ajhg.2010.02.027. [DOI] [PMC free article] [PubMed] [Google Scholar]
- 12.Baranzini SE. The genetics of autoimmune diseases: a networked perspective. Curr Opin Immunol. 2009;21:596–605. doi: 10.1016/j.coi.2009.09.014. [DOI] [PubMed] [Google Scholar]
- 13.Cotsapas C, et al. Pervasive sharing of genetic effects in autoimmune disease. PLoS Genet. 2011;7:e1002254. doi: 10.1371/journal.pgen.1002254. [DOI] [PMC free article] [PubMed] [Google Scholar]
- 14.Cortes A, Brown MA. Promise and pitfalls of the Immunochip. Arthritis Res Ther. 2011;13:101. doi: 10.1186/ar3204. [DOI] [PMC free article] [PubMed] [Google Scholar]
- 15.Jostins L, et al. Host-microbe interactions have shaped the genetic architecture of inflammatory bowel disease. Nature. 2012;491:119–24. doi: 10.1038/nature11582. [DOI] [PMC free article] [PubMed] [Google Scholar]
- 16.Krzywinski M, et al. Circos: an information aesthetic for comparative genomics. Genome Res. 2009;19:1639–45. doi: 10.1101/gr.092759.109. [DOI] [PMC free article] [PubMed] [Google Scholar]
- 17.Willis TG, et al. Bcl10 is involved in t(1;14)(p22;q32) of MALT B cell lymphoma and mutated in multiple tumor types. Cell. 1999;96:35–45. doi: 10.1016/s0092-8674(00)80957-5. [DOI] [PubMed] [Google Scholar]
- 18.Yan J, Greer JM. NF-kappa B, a potential therapeutic target for the treatment of multiple sclerosis. CNS Neurol Disord Drug Targets. 2008;7:536–57. doi: 10.2174/187152708787122941. [DOI] [PubMed] [Google Scholar]
- 19.Wegener E, Krappmann D. CARD-Bcl10-Malt1 signalosomes: missing link to NF-kappaB. Sci STKE. 2007;2007:pe21. doi: 10.1126/stke.3842007pe21. [DOI] [PubMed] [Google Scholar]
- 20.Fairfax BP, et al. Genetics of gene expression in primary immune cells identifies cell type-specific master regulators and roles of HLA alleles. Nat Genet. 2012;44:502–10. doi: 10.1038/ng.2205. [DOI] [PMC free article] [PubMed] [Google Scholar]
- 21.Lill CM, et al. Genome-wide significant association of ANKRD55 rs6859219 and multiple sclerosis risk. J Med Genet. 2013;50:140–3. doi: 10.1136/jmedgenet-2012-101411. [DOI] [PubMed] [Google Scholar]
- 22.Maier LM, et al. IL2RA genetic heterogeneity in multiple sclerosis and type 1 diabetes susceptibility and soluble interleukin-2 receptor production. PLoS Genet. 2009;5:e1000322. doi: 10.1371/journal.pgen.1000322. [DOI] [PMC free article] [PubMed] [Google Scholar]
- 23.Maller JB, et al. Bayesian refinement of association signals for 14 loci in 3 common diseases. Nat Genet. 2012;44:1294–301. doi: 10.1038/ng.2435. [DOI] [PMC free article] [PubMed] [Google Scholar]
- 24.McLaren W, et al. Deriving the consequences of genomic variants with the Ensembl API and SNP Effect Predictor. Bioinformatics. 2010;26:2069–70. doi: 10.1093/bioinformatics/btq330. [DOI] [PMC free article] [PubMed] [Google Scholar]
- 25.Gregory AP, et al. TNF receptor 1 genetic risk mirrors outcome of anti-TNF therapy in multiple sclerosis. Nature. 2012;488:508–11. doi: 10.1038/nature11307. [DOI] [PMC free article] [PubMed] [Google Scholar]
- 26.De Jager PL, et al. The role of the CD58 locus in multiple sclerosis. Proc Natl Acad Sci U S A. 2009;106:5264–9. doi: 10.1073/pnas.0813310106. [DOI] [PMC free article] [PubMed] [Google Scholar]
- 27.Malmestrom C, et al. Serum levels of LIGHT in MS. Mult Scler. 2012 doi: 10.1177/1352458512463766. [DOI] [PubMed] [Google Scholar]
- 28.Dunham I, et al. An integrated encyclopedia of DNA elements in the human genome. Nature. 2012;489:57–74. doi: 10.1038/nature11247. [DOI] [PMC free article] [PubMed] [Google Scholar]
- 29.Schaub MA, Boyle AP, Kundaje A, Batzoglou S, Snyder M. Linking disease associations with regulatory information in the human genome. Genome Res. 2012;22:1748–59. doi: 10.1101/gr.136127.111. [DOI] [PMC free article] [PubMed] [Google Scholar]
- 30.Davydov EV, et al. Identifying a high fraction of the human genome to be under selective constraint using GERP++ PLoS Comput Biol. 2010;6:e1001025. doi: 10.1371/journal.pcbi.1001025. [DOI] [PMC free article] [PubMed] [Google Scholar]
- 31.Johnson AD, et al. SNAP: a web-based tool for identification and annotation of proxy SNPs using HapMap. Bioinformatics. 2008;24:2938–9. doi: 10.1093/bioinformatics/btn564. [DOI] [PMC free article] [PubMed] [Google Scholar]
- 32.Juran BD, et al. Immunochip analyses identify a novel risk locus for primary biliary cirrhosis at 13q14, multiple independent associations at four established risk loci and epistasis between 1p31 and 7q32 risk variants. Hum Mol Genet. 2012;21:5209–21. doi: 10.1093/hmg/dds359. [DOI] [PMC free article] [PubMed] [Google Scholar]
- 33.Liu JZ, et al. Dense fine-mapping study identifies new susceptibility loci for primary biliary cirrhosis. Nat Genet. 2012;44:1137–41. doi: 10.1038/ng.2395. [DOI] [PMC free article] [PubMed] [Google Scholar]
- 34.Trynka G, et al. Dense genotyping identifies and localizes multiple common and rare variant association signals in celiac disease. Nat Genet. 2011;43:1193–201. doi: 10.1038/ng.998. [DOI] [PMC free article] [PubMed] [Google Scholar]
- 35.Eyre S, et al. High-density genetic mapping identifies new susceptibility loci for rheumatoid arthritis. Nat Genet. 2012;44:1336–40. doi: 10.1038/ng.2462. [DOI] [PMC free article] [PubMed] [Google Scholar]
- 36.Tsoi LC, et al. Identification of 15 new psoriasis susceptibility loci highlights the role of innate immunity. Nat Genet. 2012;44:1341–8. doi: 10.1038/ng.2467. [DOI] [PMC free article] [PubMed] [Google Scholar]
- 37.Cooper JD, et al. Seven newly identified loci for autoimmune thyroid disease. Hum Mol Genet. 2012;21:5202–8. doi: 10.1093/hmg/dds357. [DOI] [PMC free article] [PubMed] [Google Scholar]
- 38.Ban M, et al. Replication analysis identifies TYK2 as a multiple sclerosis susceptibility factor. Eur J Hum Genet. 2009;17:1309–13. doi: 10.1038/ejhg.2009.41. [DOI] [PMC free article] [PubMed] [Google Scholar]
- 39.Ban M, et al. A non-synonymous SNP within membrane metalloendopeptidase-like 1 (MMEL1) is associated with multiple sclerosis. Genes Immun. 2010;11:660–4. doi: 10.1038/gene.2010.36. [DOI] [PMC free article] [PubMed] [Google Scholar]
- 40.Shah TS, et al. optiCall: a robust genotype-calling algorithm for rare, low-frequency and common variants. Bioinformatics. 2012;28:1598–603. doi: 10.1093/bioinformatics/bts180. [DOI] [PMC free article] [PubMed] [Google Scholar]
- 41.Purcell S, et al. PLINK: a tool set for whole-genome association and population-based linkage analyses. Am J Hum Genet. 2007;81:559–75. doi: 10.1086/519795. [DOI] [PMC free article] [PubMed] [Google Scholar]
- 42.Browning BL, Yu Z. Simultaneous genotype calling and haplotype phasing improves genotype accuracy and reduces false-positive associations for genome-wide association studies. Am J Hum Genet. 2009;85:847–61. doi: 10.1016/j.ajhg.2009.11.004. [DOI] [PMC free article] [PubMed] [Google Scholar]
- 43.Marchini J, Howie B, Myers S, McVean G, Donnelly P. A new multipoint method for genome-wide association studies by imputation of genotypes. Nat Genet. 2007;39:906–13. doi: 10.1038/ng2088. [DOI] [PubMed] [Google Scholar]
- 44.Howie B, Marchini J, Stephens M. Genotype imputation with thousands of genomes. G3 (Bethesda) 2011;1:457–70. doi: 10.1534/g3.111.001198. [DOI] [PMC free article] [PubMed] [Google Scholar]
- 45.Marchini J, Howie B. Genotype imputation for genome-wide association studies. Nat Rev Genet. 2010;11:499–511. doi: 10.1038/nrg2796. [DOI] [PubMed] [Google Scholar]
- 46.Liu JZ, et al. Meta-analysis and imputation refines the association of 15q25 with smoking quantity. Nat Genet. 2010;42:436–40. doi: 10.1038/ng.572. [DOI] [PMC free article] [PubMed] [Google Scholar]
- 47.Wang K, Li M, Hakonarson H. ANNOVAR: functional annotation of genetic variants from high-throughput sequencing data. Nucleic Acids Res. 2010;38:e164. doi: 10.1093/nar/gkq603. [DOI] [PMC free article] [PubMed] [Google Scholar]
Associated Data
This section collects any data citations, data availability statements, or supplementary materials included in this article.