

Abstract
Earlier dynamic nuclear polarization (DNP) experiments with frozen xenon/1-propanol/trityl mixtures have demonstrated spontaneous formation of pure xenon clusters above 120 K, enabling spectrally-resolved real-time measurements of 129Xe nuclear magnetization in the clusters and in the surrounding radical-rich matrix. A spin-diffusion bottleneck was postulated to explain the peculiar time evolution of 129Xe signals in the clusters as well as the apparent discontinuity of 129Xe polarization across the cluster boundaries. A self-contained ab initio model of nuclear spin diffusion in heterogeneous systems is developed here, incorporating the intrinsic T1 relaxation towards the temperature-dependent equilibrium along with the spin-diffusion coefficients based on the measured NMR line widths and the known atomic densities in each compartment. This simple model provides the physical basis for the observed spin-diffusion bottleneck and is in a good quantitative agreement with the earlier measurements. A simultaneous fit of the model to the time-dependent NMR data at two different DNP frequencies provides excellent estimates of the cluster size, the intrinsic sample temperature, and 129Xe T1 constants. The model was also applied to the NMR data acquired during relaxation towards thermal equilibrium after microwaves were turned off to estimate T1 relaxation time constants inside and outside the clusters. Fitting the model to data during and after DNP provides estimates of cluster size that are in complete agreement.
Keywords: Hyperpolarization, MRI, chemical shift, dipolar broadening, nuclear spin diffusion, solid-state diffusion, partial differential equations
1. Introduction
Dynamic Nuclear Polarization (DNP) is a method used to dramatically enhance nuclear spin polarization by transferring spin alignment from the sparse unpaired electrons to the adjacent nuclei using resonant microwave irradiation [1]. Initial reports [2, 3] on the DNP of 129Xe raised expectations that this method of achieving nuclear hyperpolarizaion can compete with the more traditional optical pumping technology [4, 5], especially in the context of high-volume noble-gas hyperpolarization for human-lung imaging [6, 7]. However, the physics of nuclear spin interactions [8, 9, 10] in heterogeneous solid mixtures of a gaseous ingredient (such as xenon), a radical (such as commonly used trityl [11]) and a glassing agent (e. g. 1-propanol, necessary to prevent crystallization [12]) is still not fully understood. As a result, recently reported polarization values for 129Xe DNP [2, 13] are still below 25% and lag significantly behind those in both optically-pumped xenon [5] and 13C dissolution DNP [11].
Our recent low-temperature 129Xe NMR measurements on solid xenon/1-propanol/trityl mixtures (3mg (3.0 mol) Finland-acid radical, dissolved in 97 mg (1.6 mmol) 1-propanol with 2.4 mmol of liquid xenon (BOC, natural abundance, 99.997) during DNP [13] and T1 return to thermal equilibrium present a remarkably simple experimentally -accessible physical system for studying DNP phenomena at the microscopic scale. Starting with a homogeneous low-temperature glassy matrix, containing both 129Xe atoms and unpaired electrons, a simple warming up of the sample to ~125 K for several hours leads to spontaneous formation of pure xenon clusters embedded in xenon-depleted, but otherwise uniform, xenon/1-propanol/trityl host matrix, as shown in Fig. 1A. Volume-averaged polarization of xenon can be separately monitored in Xe clusters and in the glassy matrix, due to the very distinct local chemical shifts and NMR line widths of 129Xe in each environment (Fig. 1B,C). Since DNP directly involves only the nuclear spins in the vicinity of unpaired electrons, more distant nuclei in the glassy matrix must be hyperpolarized by nuclear spin diffusion, a flip-flop nuclear magnetization transfer among stationary atoms [14]. Nuclear spin diffusion is also responsible for propagating DNP into pure-xenon clusters, where no free electrons are available.
Figure 1.
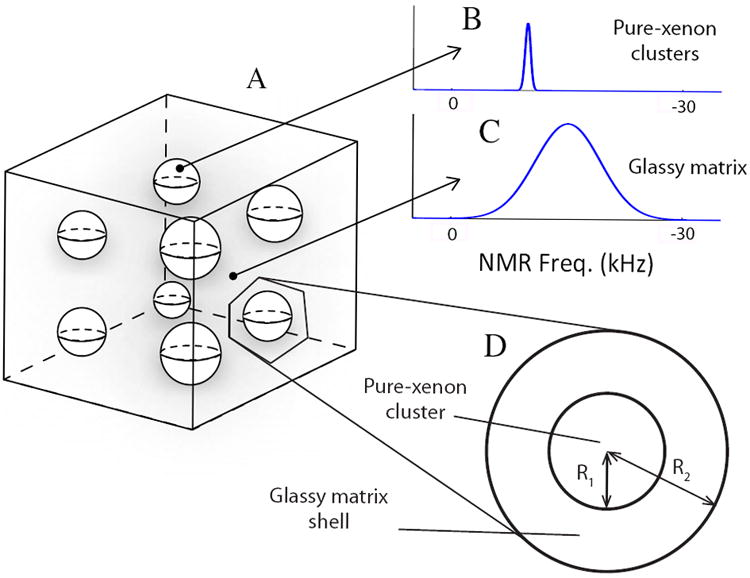
A: Sketch of pure-xenon clusters spontaneously formed in the glassy matrix of solid xenon/1-propanol/trityl mixture upon warming up to ~125 K. B: The narrow peak in 129Xe NMR spectra corresponds to pure xenon clusters. C: The broad 129Xe peak corresponds to solid xenon/1-propanol/trityl mixture. D: Region of the glassy matrix containing the cluster is modeled by two concentric spheres of radii R2 and R1 respectively.
We summarize our earlier measurements [13] of the real-time volume-averaged 129Xe polarization 〈P(t)〉 at two different DNP frequencies, ν+ (filled circles) and ν− (open circles) for pure-xenon clusters in Fig. 2. In the surrounding matrix, 〈P(t)〉 is well-described by a simple mono-exponential saturation towards steady-state values with the time constant of about an hour. The measurements begin at t = 0, when all 129Xe polarization is destroyed by hard radio-frequency (rf) pulses. DNP at ν− tends to populate the excited state of the nuclear Zeeman system, producing negative polarization (where we assign the positive sign to thermal-equilibrium polarization). At the early time points, the cores of the clusters are decoupled from the radical-rich matrix, and they polarize via a T1 process towards their positive thermal equilibrium. At later times along the ν− curve, negative DNP propagates across the cluster boundaries towards the cores, eventually resulting in the overall negative 〈P(t)〉 values. This peculiar crossover from positive to negative polarization during DNP at ν−, highlighted in the insets Fig. 2D,E, along with an order of magnitude suppression of 129Xe polarization in the clusters, was earlier explained by a hypothetical spin-diffusion bottleneck [13]. It was defined as a discontinuity in polarization across the cluster boundary that is proportional to the magnetization flux across it, analogous to the temperature drop across a thin styrofoam cup containing hot coffee. However, the physical basis of this postulated bottleneck was not derived quantitatively. Additionally, ti was assumed that polarization outside the cluster is homogenous. As a result, the fit to the data included an empirical bottleneck constant, which was strongly coupled to the unknown cluster radius. Both parameters could only be estimated qualitatively, with error bars exceeding the estimated values.
Figure 2.
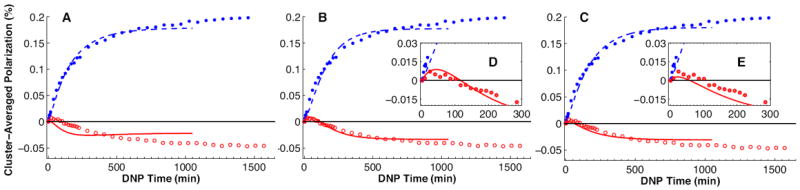
Experimentally measured volume-averaged 129Xe polarization in pure-xenon clusters as a function of time for positive and negative DNP (filled and open circles).* Simultaneous fitting of the model using the earlier simplest (A, Eq. (9)),* earlier bottleneck (B, Eq. (10)),* and the current ab initio (C, Eqs. (6) and (8)) boundary conditions. Note the poor quality of the fit to the experimental data in A. The insets D and E show a closeup view of the cluster-average polarization within minutes after initiating DNP. Note the peculiar behavior of polarization for 0 < t < 300 min under negative DNP and the quality of the fit using the earlier bottleneck and the current ab initio boundary conditions.
* Reproduced with permission from Ref. [13].
Here we develop an ab initio analytical model of nuclear spin diffusion and T1 spin relaxation in heterogeneous DNP mixtures. Our model assumes non-uniform local 129Xe polarization P(r, t) in the clusters and in the glassy matrix, and incorporates spin-diffusion constants independently derived from the measured NMR line widths and the known atomic densities in each compartment. The discontinuity in polarization gradient across the cluster boundary is derived analytically by conserving the magnetization flux. The model reproduces the experimentally observed bottleneck behavior as a sharp but continuous drop of 129Xe polarization across a thin layer of the glassy matrix surrounding the clusters. After eliminating the empirical bottleneck constant from our model, the fit to the experimental data yields a good quantitative estimate of the cluster size, while other fit parameters agree with the earlier empirical model. We also modified the model to reproduce the NMR data acquired during relaxation towards thermal equilibrium following DNP. Fitting the model to the data under this condition gives good estimates of T1 relaxation times inside and outside of the clusters, thermal polarization, intrinsic sample temperature during relaxation and the cluster size. The model suggests significantly different T1 estimates inside and outside the cluster, which is in agreement with observed data. Furthermore, The cluster size estimated by fitting the model to both DNP and relaxation data is consistent.
2. Analytical Model
To model 129Xe polarization, we assume spherical pure-xenon clusters of radius R1, uniformly distributed in the surrounding xenon/1-propanol/trityl glassy matrix. The cluster-containing matrix regions are approximated by spherical shells (Fig. 1D), whose outer radius R2 is calculated in the Appendix A to be 1.49 R1 from the known cluster-to-matrix volume ratio. Local 129Xe polarization P(r, t) at a distance from the center of the cluster is modeled inside the cluster by combining the effects of spin-diffusion and those of T1 relaxation:
| (1) |
Outside the cluster, in the matrix region R1 < r < R2, an additional effect of DNP is taken into account:
| (2) |
Here, Ds1 ≈ 7.3 × 10⁻¹⁴ cm2/s = 4.4 × 10⁻⁴ μm2/min and Ds2 ≈ 5.68 × 10⁻⁶ μm2/min are the 129Xe nuclear spin-diffusion coefficients for natural-abundance pure xenon [15, 16] and for the glass matrix as calculated in Appendix A. The second term on the right-hand side of Eq. (1) describes T1 relaxation towards the thermal polarization P0 at the intrinsic sample temperature T:
| (3) |
where h and kB are the Planck and Boltzmann constants respectively and f = 58.88 MHz is the 129Xe NMR frequency at 5 T.
Similarly, in Eq. (2) describes the equilibrium local polarization far away from the clusters at ν± DNP frequencies and τ0 defines the intrinsic DNP time constant in the glassy matrix.
In the earlier work [13], the polarization in the glassy matrix was assumed spatially uniform and equal to the measured volume-averaged polarization:
| (4) |
with the measured saturation polarizations and at the DNP frequencies ν+ and ν−, respectively. The measured DNP time constant for the volume-averaged polarization was τ = 54 min.
The measurements [13] began with the initial condition:
| (5) |
The outer boundary condition in our model is based on the assumption that polarization profiles at all times are symmetric with respect to the boundaries separating neighboring cluster-containing regions, that is
| (6) |
The boundary condition at the cluster-matrix interface is derived by equating the nuclear magnetization flux due to spin diffusion on either side of R1, which can be written in terms of an infinitely small positive ε:
| (7) |
where 129Xe nuclear magnetization M(r, t) = μn(r)P(r, t) is the product of the magnetic moment μ, the atom density n(r), and the local polarization P(r, t) of 129Xe atoms. In terms of polarization, this evaluates to:
| (8) |
where n1 and n2 refer to 129Xe atom densities in the cluster and glassy matrix regions respectively.
In contrast, the simplest model in the earlier work [13] assumed Eq. (4) with continuous boundary conditions:
| (9) |
see Appendix B for details. In the same work, the boundary condition was modified to include the empirical bottleneck constant κ:
| (10) |
That modified model is treated in detail in Appendix C.
Using the assumed spherical symmetry of each cluster, P(r, t) can be substituted with the new variable u(r, t):
| (11) |
Eqs. (1) and (2) then simplify to:
| (12) |
| (13) |
where subscript notation is used for t and r derivatives. An additional boundary condition on u(0, t) is obtained by requiring that P(r, t) remains finite at r = 0:
| (14) |
The system of differential equations (12) and (13) under the conditions based on Eqs. (5), (6), (8), and (14) is solved using a finite-differences method on a (N+1) × (N+1) grid representing the (r, t) plane with Δt = ttot/N and Δr = R2/N grid spacing, where ttot = 1050 min in this analysis. We define vector u(n) = {u(mΔr, nΔt)}m=0,1,…,N that obeys the recursion relations:
| (15) |
| (16) |
where the elements of the matrix A(N+1)×(N+1) and the vector function f(n) (u) are given in Appendix D.
For any combination of , , and τ0 parameter values, the volume-averaged polarization of 129Xe in the glassy-matrix is obtained by substituting Eq. (11) into the solution of Eqs. (15)-(16), and numerically integrating the resulting P(r, t):
| (17) |
This result is numerically fitted to the functional form of Eq. (4), and the corresponding values of , , and τ are estimated. In an iterative procedure, the original values of , , and τ0 are then corrected by the corresponding ratios between the experimentally measured and the newly estimated values of , , and τ, until the required corrections are below the actual values by at least 5 orders of magnitude. This iterative procedure converges rapidly, requiring fewer than five iterations.
Volume-averaged 129Xe polarization 〈P(t)〉 in the clusters is then obtained by numerically integrating the resulting P(r, t) as well:
| (18) |
The convergence of the finite-differences solution was confirmed by comparing the resulting 〈P(t)〉 curves for N = 150, 370, 750, 1200, 1800 and 2700.
In applying the model to relaxation data, Eqs. 1 and 19 may be used:
| (19) |
where P0 and T1−shell are thermal polarization and relaxation time constants of the homogenously mixed part of the sample. The initial condition defined in Eq. 5 was replaced by final time point of the local polarization P(r, t) estimate derived from fitting the model to the DNP data at ν+ microwave frequency. We set the initial polarization in the relaxation phase to be the measured polarization at the end of the spin-up phase. Furthermore, the iterative method to derive in Eq. 2 was eliminated since P0 is known from the measured temperature at T = 1.43 K using Eq. 3. The measured and modeled polarization 〈P(t)〉 inside and outside the cluster are illustrated in Fig. 4.
Figure 4.
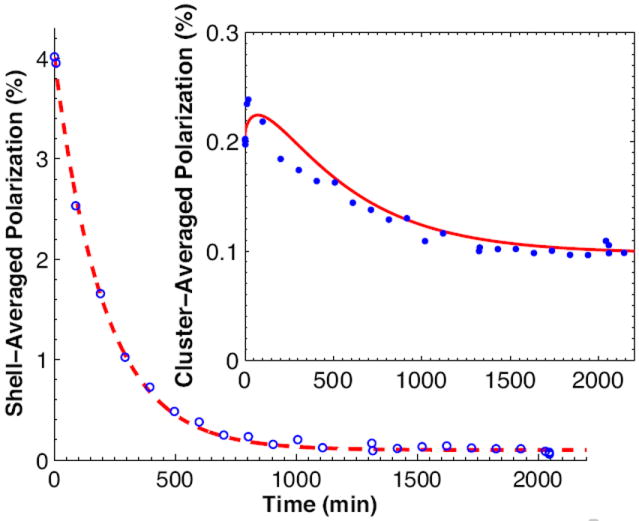
Experimentally measured volume-average 129Xe polarization in the well-mixed shell (open circles) during T1 relaxation after microwaves were turned off. The fitting of the ab initio model to the data (dashed line) is in complete agreement with the data. The inset shows the measured data (filled circles) and the fitting of the model (solid line) for pure xenon clusters. Note the peculiar behavior at the beginning of relaxation which is predicted by the model.
3. Results and Discussion
Fig. 2C,E shows the results of fitting the self-contained model with the boundary conditions defined by Eq. (6) and (8) (solid lines) to the experimental 〈P(t)〉 data at ν+ and ν− DNP frequencies (filled and open circles), treating them as a single data set. Note that similar to the previously published bottleneck model [13] of Eq. (10) (Fig. 2B,D), this calculation reproduces the reversal from positive to negative cluster-averaged polarization under ν− DNP (Fig. 2E, open circles), a result of the immediate bulk relaxation towards the positive thermal polarization and the delayed propagation of negative DNP from the boundary inward. The long-term polarization creep away from zero in the experimental data is peculiar to the clusters, and is not observed in the measured xenon/1-propanol/trityl glassy matrix data. This effect cannot be reproduced by any of our models, and can be attributed to the distribution of cluster sizes as well as due to possible variability of T1 inside the clusters. To avoid the associated bias in our fit parameters, the domain of the fit was limited to the first 1050 min of DNP. Fig. 3C shows the radial dependence of the calculated polarization across the cluster at time t=1024 min. In contrast to the bottleneck model of Fig. 3B, the polarization is continuous at the cluster boundary but exhibits an overall behavior similar to the bottleneck model. However, the earlier simplest model, based on spatially uniform polarization in the glassy matrix and the continuous boundary condition of Eq. (9) (Figs. 2A and 3A) cannot reproduce the sign change of cluster-averaged polarization under DNP at ν−, and leads to unphysically large cluster-size estimates, given in Table 1. The overheating of the sample during DNP is verified by the fit of the model to the relaxation data, which suggest lower sample temperature (Table 2.)
Figure 3.
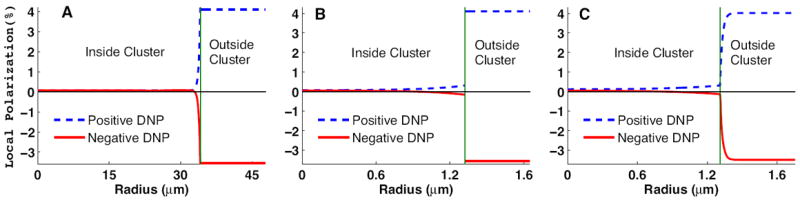
Modeled polarization profiles across the spherical cluster P(r, t) at time t =1024 min, using the best-fit parameters of Table 1. A: Earlier simplest model with the boundary condition of Eq. (9). B: Earlier bottleneck model with the boundary condition of Eq. (10). C: Current ab initio model with the boundary conditions of Eqs. (6) and (8).
Table 1.
Free parameters intra-cluster T1, R1, κ, and P0 used in fitting the models described in the text to the experimental data of Fig. 2. Also included is the intrinsic sample temperature T, derived from P0 using Eq. 3. Best-fit values for the three boundary conditions are listed in columns 2–4, along with the corresponding errors estimated from the fits.
| Best-fit parameters from DNP data: | Model | ||
|---|---|---|---|
| Simplest* | Bottleneck* | Ab initio | |
| Boundary Condition | |||
| Eq. (9) | Eq. (10) | Eqs. (6), (8) | |
| T1, relaxation time (min) | 207 ± 39 | 145 ± 25 | 167 ± 12 |
| R1, cluster radius (μm) | 34 ± 2 | 1.05 ± 0.1 | 1.21 ± 0.04 |
| κ, bottleneck const. (μm−1) | ∞ | 0.2 ± 0.18 | N/A |
| P0, thermal polarization (%) | 0.073 ± 0.005 | 0.069 ± 0.0044 | 0.069 ± 0.003 |
| T, sample temperature (K) | 1.93 ± 0.14 | 2.03 ± 0.13 | 2.04 ± 0.09 |
Listed with permission from Ref. [13].
Table 2.
Free parameters intra and extra-cluster T1 relaxation times and cluster sizeR1 from from the ab initio model described in the text to the experimental data of Fig. 4. Sample temperature was measured at 1.43 K and was assumed to be constant. Eq. 3.
| Best-fit parameters from relaxation data | ||
|---|---|---|
| T1 relaxation time (min) | R1, cluster radius (μm) | |
| extra-cluster | intra-cluster | |
| 214 ± 12 | 391 ± 60 | 0.97 ± 0.18 |
Thermal polarization P0, extracted by fitting the current ab initio model to the experimental data, is similar to that of the bottleneck model (see Table 1). Either value can be used to estimate the internal sample temperature during DNP according to Eq. 3. The inferred values, also listed in Table 1, imply a significant overheating of the sample by the microwave irradiation. This finding, based entirely on the prediction of our numerical models, has lead to several modifications of the DNP system with the goal to reduce overheating (such as eliminating thermal barriers to cooling, lowering microwave power, and pelletizing the sample), and resulted in the increase of maximum 129Xe polarization from 5.1% to 21% [13].
The cluster size obtained by fitting the current ab initio model (R1 = 1.31 ± 0.05 μm) is in good agreement with the rough estimate (0.7 μm) based on the known pure-xenon atomic-diffusion values [17] expected during the thermal cycling of the sample. In contrast, fitting the bottleneck model to the DNP experimental data yields a much less precise result (R1 = 1.27 ± 1.05 μm). The large confidence interval in fitting the earlier model is due to the strong statistical coupling between the expected values of the empirical bottleneck constant κ and the cluster radius R1.
Fig. 4 shows the extra-cluster volume average polarization (open circles) measured during the relaxation and the results of the ab initio model (dashed line). The inset in the same figure shows this data (filled circles) and the fitting of the ab initio model (solid line) for pure xenon clusters. The initial increase observed in polarization may be attributed to a transient state caused by the interplay of significant polarization gradient across the cluster boundaries and T1 relaxation before reaching a steady state. This behavior is also predicted by the model as demonstrated in the inset in Fig. 4.
The free parameters derived from the fit are listed in Table 2. Thermal polarization P0 was derived by measuring the temperature (1.43 K) and using Eq. 3. The substantial difference in the predicted T1 relaxation times (Table 2) inside and outside the cluster is consistent with observation and may be attributed to the coupling between 129Xe species and the neighboring protons in the xenon/1-propanol/radical mixture. Lastly, the model applied to both DNP and relaxation datasets predict cluster sizes that are consistent (Table 2).
4. Conclusion
We have demonstrated a self-contained analytical model that describes recent measurements of 129Xe polarization during and after DNP of heterogeneous xenon/1-propanol/ trityl mixtures containing pure-xenon clusters. Our ab initio model incorporates the effects of DNP, nuclear spin diffusion, and T1 relaxation, and quantitatively explains the earlier postulated spin-diffusion bottleneck at the cluster-matrix boundary [13] in terms of a sharp drop in 129Xe polarization in the thin layer of the fairly “spin-insulating” glassy matrix surrounding each cluster. Fitting this model to the experimental data during and after DNP provides a very accurate estimate of the size of spontaneously-formed pure-xenon clusters, in contrast to the previous empirical model. Developing these analytical methods in parallel to the experimental polarization techniques offers new insights into DNP of heterogeneous solid-state systems at the microscopic scale.
Theory of nuclear spin diffusion in heterogeneous media is derived.
Model provides the physical basis for the spin-diffusion bottleneck observed earlier.
The predictions fit the experimental data from a sample of clustered Xe-129 mixture.
Model finds accurate estimates of the xenon cluster size, internal temperature and T1.
This analysis lead to DNP system improvements that resulted in much higher 129Xe polarization.
Acknowledgments
This work has been supported by NIH RO1 EB010208.
Appendix A
The ratio of the outer radius of the glassy matrix shell to that of the cluster (Fig. 1D) is obtained as:
| (20) |
by solving the following system of volumetric equations:
Here s is the ratio of the numbers of xenon atoms outside and inside the clusters, measured from the ratio of the areas under the broad and narrow NMR peaks at thermal equilibrium [13], and m is the ratio of the nominal xenon and 1-propanol concentrations in the sample before the clusters were formed. MXe = 130.1 g/mol and M1−prop = 60.1 g/mol are the molecular weights, whereas ρXe = 3.78 g/cm3 and ρ1−prop ~ 0.95 g/cm3 are the densities of pure xenon [18] and 1-propanol respectively at 1.4 K. The density of 1-propanol was estimated by extrapolating from the values measured above 150 K [19]. The density of the glassy matrix was assumed to be volume-weighted average of the densities of the pure compounds, neglecting possible volumetric corrections as well as the ~ 1% contribution of the trityl radical.
The spin-diffusion coefficient Ds2 = 5.68 × 10⁻⁶ μm2/min in the glassy matrix is found by scaling the known Ds1 value for pure xenon based on [8]
| (21) |
where the square root of the second moment of the NMR line S1/2 is parameterized by the measured linewidths [13] (0.7 KHz and 7 KHz respectively for the narrow and broad peaks) and the summation over the neighboring 129Xe atoms scales with the 4/3 power of the corresponding number densities: (n1/n2)4/3 = 7.74. As a result, the 129Xe spin-diffusion coefficient in the glassy matrix is a factor of 77.4 lower than that in the pure xenon clusters.
Appendix B
For comparison purposes, we provide an analytical solution for the simplest early model defined by Eqs. (1), (4), (5), and (9). Separating r and t in Eq. (12) yields the general solution:
| (22) |
where k ∈ ℂ distinguishes individual modes and the amplitudes αk, βk are determined from the initial and boundary conditions. Substituting Eq. (22) into Eq. (14) gives βk = 0. Substituting into Eq. (9) and equating time-dependent exponents determines αk for k = k0 = −i(DsT1)−1/2 and k = kτ = (T1 τ−1−1)1/2(DsT1)−1/2. The remaining αk are found by requiring the corresponding modes to vanish at the r = R1 boundary: sin knR1 = 0. This defines harmonics kn = πn/R1, which can be used to decompose the residual difference between Eq. (5) and the k0, kτ modes at t = 0 into a Fourier series in kn:
| (23) |
where
| (24) |
| (25) |
Obtaining P(r, t) from Eqs. (11) and (23) and volume-averaging using Eq. (18) leads to further simplification:
| (26) |
with , , and ζn = π2 n2 ρ−2. The sum in Eq. (26) converges rapidly (even at t = 0 the residuals drop off as n−3), and in practice keeping the first 100 terms in the sum gives a very adequate precision.
Appendix C
Following the general finite-differences method described in Eqs. (15-16), the matrices A and f(n) that were used to solve the earlier bottleneck model of Eqs. (1), (4), (5), and (10) are:
and the components of the vector function f(n) (u) are:
The (N + 1) × (N + 1) grid is defined on the cluster region r < R1 only.
Appendix D
Elements of the matrices A for recursion introduced in Eq. 16 are:
where rnD = n1 Ds1/(n2 Ds2), and M = N R1/R2 is the radial index of the cluster boundary r = R1 on the grid. The symbols α, β, γ, … ψ are defined in Table 3. The components of the vector function f(n)(u) are:
Table 3.
Summary of the parameters used to simplify elements of the Matrix A in Appendix D.
| Symbol | Value | Symbol | Value | ||
|---|---|---|---|---|---|
|
| |||||
| α | (−3Δr2 + 2ΔrR1)−1 | η | (3Δr2 + 2ΔrR1)−1 | ||
| β |
|
λ |
|
||
| γ | 3(−Δr2 + 2Δr R1)−1 | ξ | (−3Δr2 + 2Δr R2)−1 | ||
| δ |
|
σ |
|
||
| ε | 3(Δr2 + 2Δr R1)−1 | φ | 3(−Δr2 + 2Δr R2)−1 | ||
| ζ |
|
ψ |
|
||
Footnotes
Publisher's Disclaimer: This is a PDF file of an unedited manuscript that has been accepted for publication. As a service to our customers we are providing this early version of the manuscript. The manuscript will undergo copyediting, typesetting, and review of the resulting proof before it is published in its final citable form. Please note that during the production process errors may be discovered which could affect the content, and all legal disclaimers that apply to the journal pertain.
References
- 1.de Boer W, Niinikoski TO. Nucl Instrum Methods. 1974;114:495. [Google Scholar]
- 2.Ardenkjaer-Larsen JH, et al. 8,003,077. U S Patent. 2003 Oct 24;
- 3.Comment A, et al. Phys Rev Lett. 2010;105:018104. doi: 10.1103/PhysRevLett.105.018104. [DOI] [PubMed] [Google Scholar]
- 4.Happer W, Miron E, Schaefer S, Schreiber D, van Wijngaarden WA, Zeng X. Phys Rev A. 1984;29:3092. [Google Scholar]
- 5.Hersman FW, et al. Acad Radiol. 2008;15:683. doi: 10.1016/j.acra.2007.09.020. [DOI] [PMC free article] [PubMed] [Google Scholar]
- 6.Cleveland ZI, et al. PLoS One. 2010;5:e12192. doi: 10.1371/journal.pone.0012192. [DOI] [PMC free article] [PubMed] [Google Scholar]
- 7.Dregely I, et al. J Magn Reson Imag. 2011;33:1052. doi: 10.1002/jmri.22533. [DOI] [PMC free article] [PubMed] [Google Scholar]
- 8.Khutsishvili GR. Sov Phys Uspekhi. 1966;8:743. [Google Scholar]
- 9.Hovav Y, Feintuch A, Vega S. J Magn Reson. 2010;207:176. doi: 10.1016/j.jmr.2010.10.016. [DOI] [PubMed] [Google Scholar]
- 10.Hovav Y, Feintuch A, Vega S. J Chem Phys. 2011;134:074509. doi: 10.1063/1.3526486. [DOI] [PubMed] [Google Scholar]
- 11.Meyer W, et al. Nucl Instrum Methods Phys Res A. 2011;631:1. [Google Scholar]
- 12.Ardenkjaer-Larsen JH, et al. Proc Natl Acad Sci USA. 2003;100:10158. doi: 10.1073/pnas.1733835100. [DOI] [PMC free article] [PubMed] [Google Scholar]
- 13.Kuzma NN, et al. J Chem Phys. 2012;135:104508. doi: 10.1063/1.4751021. submitted. [DOI] [PMC free article] [PubMed] [Google Scholar]
- 14.Bloembergen N. Physica. 1949;15:386. [Google Scholar]
- 15.Morgan SW. Ph D thesis. University of Utah; 2007. [Google Scholar]
- 16.Fisher RA, Brodale GE, Hornung EW, Giauque WF. Rev Sci Instrum. 1968;39:108. [Google Scholar]
- 17.Yen WM, Norberg RE. Phys Rev. 1963;131:269. [Google Scholar]
- 18.Rabinovich, et al. Thermophysical properties of neon, argon, krypton and xenon. Hemisphere Publishing; 1988. [Google Scholar]
- 19.Ruth AA, Lesche H, Nicke B, Phys Z. Z Phys Chemie - Int J Res Phys Chem Chem Phys. 2003;217:707. [Google Scholar]