Deletion of Ezh2 results in transcriptional repression of developmental regulator genes, derepression of oncogenic polycomb targets, and induction of MDS/MPN-like disease in mice that is exacerbated by concurrent deletion of Tet2.
Abstract
Polycomb group (PcG) proteins are essential regulators of hematopoietic stem cells. Recent extensive mutation analyses of the myeloid malignancies have revealed that inactivating somatic mutations in PcG genes such as EZH2 and ASXL1 occur frequently in patients with myelodysplastic disorders including myelodysplastic syndromes (MDSs) and MDS/myeloproliferative neoplasm (MPN) overlap disorders (MDS/MPN). In our patient cohort, EZH2 mutations were also found and often coincided with tet methylcytosine dioxygenase 2 (TET2) mutations. Consistent with these findings, deletion of Ezh2 alone was enough to induce MDS/MPN-like diseases in mice. Furthermore, concurrent depletion of Ezh2 and Tet2 established more advanced myelodysplasia and markedly accelerated the development of myelodysplastic disorders including both MDS and MDS/MPN. Comprehensive genome-wide analyses in hematopoietic progenitor cells revealed that upon deletion of Ezh2, key developmental regulator genes were kept transcriptionally repressed, suggesting compensation by Ezh1, whereas a cohort of oncogenic direct and indirect polycomb targets became derepressed. Our findings provide the first evidence of the tumor suppressor function of EZH2 in myeloid malignancies and highlight the cooperative effect of concurrent gene mutations in the pathogenesis of myelodysplastic disorders.
Recent genomic studies have identified a series of recurrent somatic mutations in patients with myeloid malignancies, including myelodysplastic syndrome (MDS), myeloproliferative neoplasm (MPN), chronic myelomonocytic leukemia (CMML)—classified as an MDS/MPN—and acute myeloid leukemia (AML). Notably, these mutations frequently occur in epigenetic regulator genes such as tet methylcytosine dioxygenase 2 (TET2), isocitrate dehydrogenase 1 (IDH1), IDH2, DNA methyltransferase 3A (DNMT3A), and polycomb group (PcG) genes (Chung et al., 2012; Raza and Galili, 2012; Shih et al., 2012). PcG proteins form the polycomb repressive complexes (PRCs) 1 and 2. PRC2 contains three core subunits: SUZ12, one of the EED isoforms, and the histone methyltransferase EZH1 or EZH2, which catalyzes di- and tri-methylation of histone H3 at lysine 27 (H3K27me3). Canonical PRC1 contains four core subunits, PCGF (which can include BMI1 or MEL18), CBX, PHC, and RING1A or RING1B, which monoubiquitylates histone H2A at lysine 119 (H2AK119ub1). PRC1 and PRC2 cooperatively function as transcriptional repressors via establishing these repressive histone modifications. PcG genes have been implicated in the maintenance of self-renewing somatic and cancer stem cells (Konuma et al., 2010; Sauvageau and Sauvageau, 2010) and have typically been characterized as oncogenes, as exemplified by somatic activating mutations of EZH2 in follicular and diffuse large B cell lymphomas (Morin et al., 2010). However, EZH2, which is located at chromosome 7q36, is frequently involved in chromosomal abnormalities such as -7 and 7q-, and inactivating mutations of EZH2 have also been identified in patients with MDS, MPN, and CMML—all clonal myeloid disorders originating from hematopoietic stem cells (HSCs; Ernst et al., 2010; Nikoloski et al., 2010). Of interest, other components of PRC2, EED, and SUZ12 appeared to be mutated in a manner similar to EZH2, although the frequencies of their mutations are much lower than those of EZH2 mutations. The PRC2-related gene ASXL1, which plays an important role in the recruitment and/or stability of PRC2 (Abdel-Wahab et al., 2012), has also been shown to carry inactivating mutations in patients with MDS, MPN, and CMML (Abdel-Wahab et al., 2011; Bejar et al., 2011). Although these mutations suggest a tumor suppressor function of PRC2-related genes in these diseases, both the impact of each PcG mutation and its interplay with coinciding mutations remain largely unknown.
Loss-of-function mouse models of Tet2, Dnmt3a, and Bap1, as well as gain-of-function mouse models of IDH1, have been reported to recapitulate some aspects of malignancies (Moran-Crusio et al., 2011; Challen et al., 2012; Dey et al., 2012; Sasaki et al., 2012). However, the role of PcG-related mutants has not yet been tested in mice. To understand the contribution of inactivating PcG mutations to the development of myeloid malignancies, we examined the Ezh2-deficient mice over longer periods of time and also tested the impact of concurrent depletion of Ezh2 and Tet2 on hematopoiesis.
RESULTS
Somatic mutations of PcG genes in myeloid dysplasia
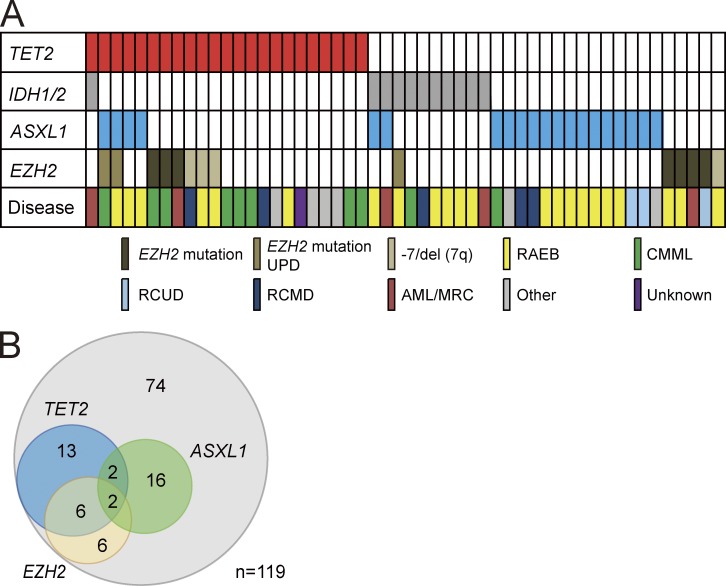
In our cohort of 119 patients with myelodysplastic disorders, which includes MDS, CMML, and AML with myelodysplasia-related changes (AML/MRC), inactivating mutations in EZH2 and ASXL1 were detected in 8.4 and 16.8% of patients, respectively. Moreover, 3.4% of patients had deletion of EZH2 (located at 7q36) associated with -7 and 7q- chromosomal abnormalities (Fig. 1 A and Table S1). Notably, 57.1% of these EZH2 mutations coexisted with TET2 mutations. Conversely, 34.8% of patients with TET2 mutations had coexisting EZH2 mutations (Fig. 1 B). These findings suggest a link between EZH2 and TET2 mutations in the pathogenesis of myelodysplastic disorders.
Figure 1.
Distribution of mutations in epigenetic regulator genes in patients with myelodysplastic disorders. (A) Mutations of TET2, IDH1/2, EZH2, and ASXL1 in 52 samples from 119 patients with MDS, CMML, and AML/MRC shown by colored bars. Each column represents 1 of the 52 samples with a mutation in one or more of the genes listed. EZH2 mutations include uniparental disomy (UPD) of EZH mutation and deletion of EZH2 (located at 7q36) associated with -7 and 7q- chromosomal abnormalities. The disease types of these 52 patients are also shown. Refractory anemia with excess blasts (RAEB) includes RAEB-1 and RAEB-2. CMML includes CMML-1 and CMML-2. RCUD and RCMD denote Refractory cytopenia with unilineage or multilineage dysplasia, respectively. Other diseases include 5q- syndrome, Refractory anemia with ring sideroblasts (RARS), and MDS, unclassifiable (MDS-U). (B) Venn diagrams showing the number of patients who have both TET2 and PcG mutations. The overlap between mutations in TET2 and EZH2 is statistically significant (P < 0.001).
Deletion of Ezh2 results in enhanced repopulating capacity of HSCs and promotes myeloid-biased repopulation
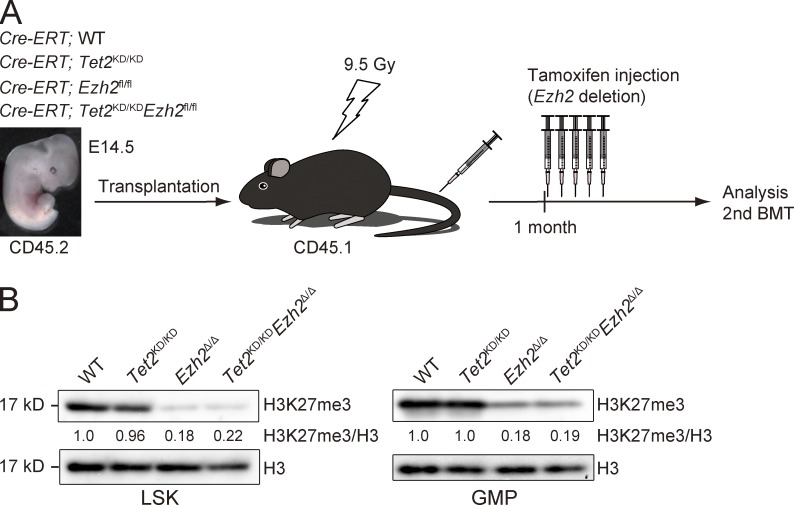
To decipher the pathological role of inactivating EZH2 mutations and concurrent inactivation of EZH2 and TET2 genes in malignant stem cell disorders, we crossed Cre-ERT;Ezh2fl/fl mice (Mochizuki-Kashio et al., 2011) and Tet2 gene trap mice (Tet2KD/KD; Shide et al., 2012). Tet2KD/KD mice, in which the gene trap vector is inserted into exon 2 of Tet2 just before the first coding exon, express Tet2 mRNA at levels ∼20% of those of the WT mice and frequently die by postnatal day 3 (Shide et al., 2012). Considering the early death of Tet2KD/KD mice and a necessity to exclude the influence of the loss of Tet2 and Ezh2 in BM niche cells, we transplanted E14.5 fetal liver cells from Cre-ERT control (WT), Cre-ERT;Tet2KD/KD, Cre-ERT;Ezh2fl/fl, and Cre-ERT;Tet2KD/KDEzh2fl/fl CD45.2 mice into lethally irradiated CD45.1 recipient mice and deleted Ezh2 by intraperitoneal injection of tamoxifen at 4 wk after transplantation (Fig. 2 A). We hereafter refer to the recipient mice reconstituted with Tet2KD/KD, Ezh2Δ/Δ, and Tet2KD/KDEzh2Δ/Δ cells as Tet2KD/KD, Ezh2Δ/Δ, and Tet2KD/KDEzh2Δ/Δ mice, respectively. EZH2 is a catalytic component of PRC2 that catalyzes the methylation of H3K27. As expected, the levels of H3K27me3 were markedly reduced upon deletion of Ezh2 in both Lineage−Sca-1+c-Kit+ (LSK) cells, which include HSCs and multipotent progenitor cells (MPPs), and in granulocyte-macrophage progenitors (GMPs; Fig. 2 B). TET2, a methylcytosine dioxygenase, catalyzes the oxidation of 5-mC (5-methylcytosine) to 5-hmC (5-hydroxymethyl cytosine), the first step of active demethylation ((Ernst et al., 2010; Ko et al., 2010). The levels of 5-hmC in total BM cells were also reduced in Tet2KD/KD and Tet2KD/KDEzh2Δ/Δ cells, whereas there was no obvious difference in the levels of 5-mC among each genotype (unpublished data).
Figure 2.
Generation of mice reconstituted with Tet2KD/KD, Ezh2Δ/Δ, and Tet2KD/KDEzh2Δ/Δ hematopoietic cells. (A) A schematic diagram of the experimental process. 106 E14.5 fetal liver cells from Cre-ERT;WT, Cre-ERT;Tet2KD/KD, Cre-ERT;Ezh2fl/fl, and Cre-ERT;Tet2KD/KDEzh2fl/fl CD45.2 mice were transplanted into lethally irradiated CD45.1 recipient mice. For deletion of Ezh2, 100 µl tamoxifen (10 mg/ml) was intraperitoneally injected once a day for 5 consecutive days at 4 wk after transplantation. (B) Levels of H3K27me3 in LSK cells and GMPs. LSK cells and GMPs from BM of WT, Tet2KD/KD, Ezh2Δ/Δ, and Tet2KD/KDEzh2Δ/Δ mice were analyzed by Western blotting using an anti-H3K27me3 antibody at 4 mo after transplantation. Levels of H3K27me3 were normalized to the amount of H3 and are indicated relative to WT control values. The levels of H3K27me3 in WT cells were arbitrarily set to 1. The representative data from two independent experiments are presented.
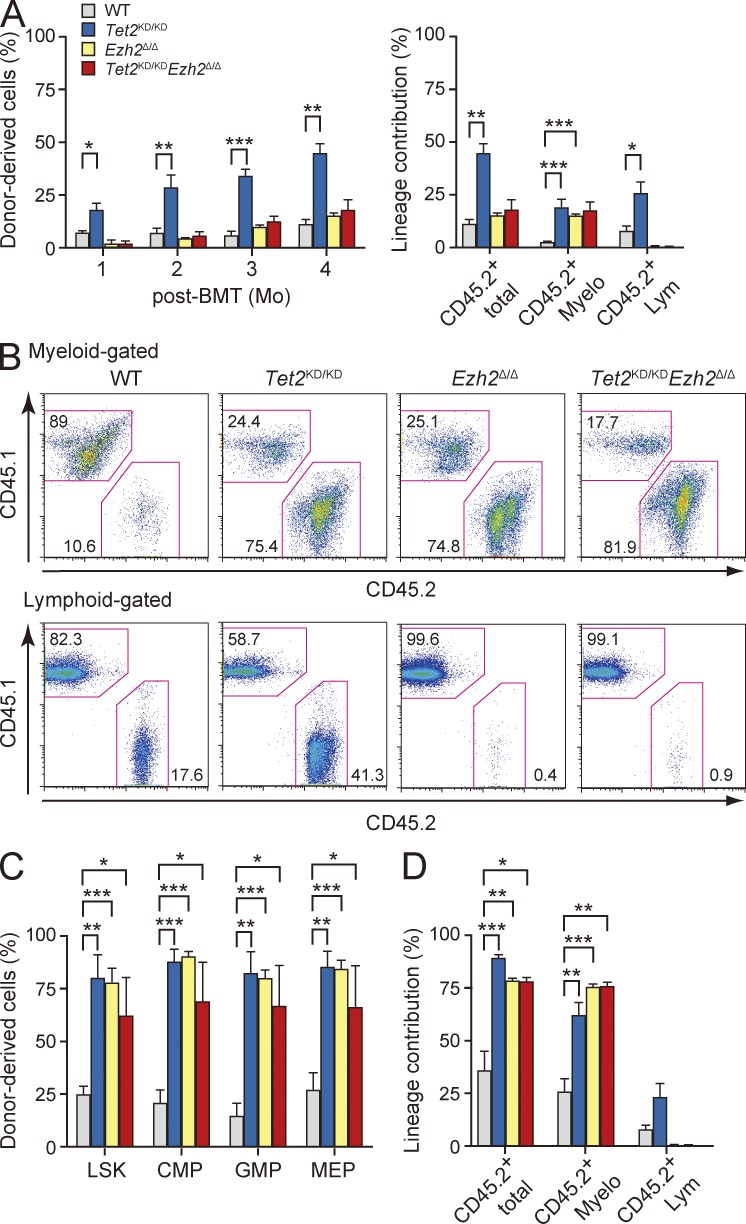
To explore the consequence of loss of Ezh2 and/or Tet2 in hematopoietic stem/progenitor cells, we first performed competitive repopulating assays using LSK cells recovered from the recipient mice at 3 mo after deletion of Ezh2. It has been reported that Tet2 loss leads to increased HSC self-renewal and myeloid transformation (Moran-Crusio et al., 2011; Shide et al., 2012). As expected, Tet2KD/KD LSK cells readily established progressively increasing chimerism in the PB over time (Fig. 3 A). Similarly, the contribution of Ezh2Δ/Δ and Tet2KD/KDEzh2Δ/Δ LSK-derived cells to the myeloid compartment of the PB increased over time, although the total chimerism was lower than that of Tet2KD/KD cells because of inefficient production of lymphocytes by Ezh2-deficient LSK cells (Fig. 3, A and B). Indeed, LSK cells of all genotypes established significantly higher chimerism in the BM LSK fraction compared with WT LSK cells (Fig. 3 C). All mutant cells taken from the primary recipients continued to propagate in the secondary recipients during serial transplantation and exhibited myeloid-biased differentiation (Fig. 3 D). These results reveal that the loss of Ezh2 augments the repopulating capacity of HSCs and activates the production of myeloid cells in much the same way as the loss of Tet2 does.
Figure 3.
Enhanced repopulating capacity of Tet2KD/KD, Ezh2Δ/Δ, and Tet2KD/KDEzh2Δ/Δ HSCs. (A) Competitive repopulating assays. 600 LSK cells from WT, Tet2KD/KD, Ezh2Δ/Δ, and Tet2KD/KDEzh2Δ/Δ mice at 12 wk after deletion of Ezh2 were injected into lethally irradiated CD45.1 recipients with 4 × 10⁵ CD45.1 competitor BM cells. The percentages of donor-derived total CD45.2+ hematopoietic cells in the PB (left) and the percentages of total CD45.2+ hematopoietic cells and myeloid (Gr-1+ and/or Mac-1+) and lymphoid (B220+, CD4+, or CD8+) cells in the PB at 12 wk after transplantation (right) are shown as mean ± SEM (n = 4–6). These data are representative data from two independent experiments. (B) Representative flow cytometric profiles of donor-derived CD45.2+ myeloid (top) and lymphoid cells (bottom) in the PB at 12 wk after transplantation. (C) Percentages of donor-derived CD45.2+ hematopoietic cells in the BM LSK HSC/MPP and myeloid progenitor fractions. The data are shown as mean ± SEM (n = 4–6). (D) Secondary transplantation assays. Total BM cells (2 × 10⁶) from primary recipient mice at 12 wk after transplantation were transplanted into lethally irradiated recipient mice without competitor cells. The percentages of donor-derived total CD45.2+ hematopoietic cells and myeloid and lymphoid cells in the PB at 20 wk after transplantation are shown as mean ± SEM (n = 3–5). *, P < 0.05; **, P < 0.01; ***, P < 0.001.
Deletion of Ezh2 causes myeloid dysplasia in mice
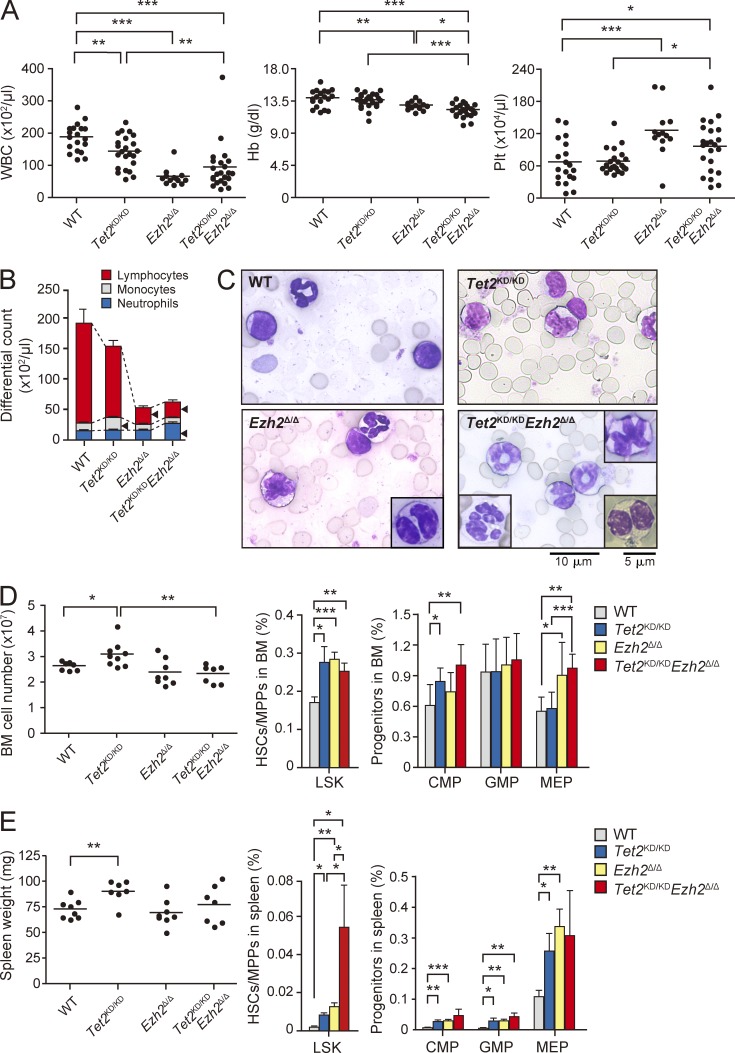
We next analyzed the hematopoiesis in recipient mice reconstituted with Tet2KD/KD, Ezh2Δ/Δ, and Tet2KD/KDEzh2Δ/Δ cells. PB from Ezh2Δ/Δ and Tet2KD/KDEzh2Δ/Δ mice at 3 mo after deletion of Ezh2 showed reduced white blood cell counts due to lymphopenia and increased platelet counts. In addition, mild but significant anemia was detected in these mice (Fig. 4, A and B). Tet2KD/KD mice showed monocytosis in PB as reported previously (Moran-Crusio et al., 2011), whereas Tet2KD/KDEzh2Δ/Δ mice did not (Fig. 4 B). Cytological analysis of Ezh2Δ/Δ and Tet2KD/KDEzh2Δ/Δ PB revealed morphological abnormalities in myeloid cells, such as delayed maturation of neutrophils, hyposegmented neutrophils consistent with a pseudo Pelger-Huët anomaly, hypersegmented neutrophils, and dysplasia of monocytes (Fig. 4 C). This trend was more evident in Tet2KD/KDEzh2Δ/Δ PB compared with Ezh2Δ/Δ PB but was not obvious in Tet2KD/KD PB (Fig. 4 C).
Figure 4.
Hematopoiesis in the recipient mice reconstituted with Tet2KD/KD, Ezh2Δ/Δ, and Tet2KD/KDEzh2Δ/Δ hematopoietic cells. (A) PB cell counts in recipients reconstituted with Tet2KD/KD, Ezh2Δ/Δ, and Tet2KD/KDEzh2Δ/Δ fetal liver hematopoietic cells at 12 wk after deletion of Ezh2. White blood cell (WBC), hemoglobin (Hb), and platelet (Plt) counts in the PB from WT (n = 19), Tet2KD/KD (n = 23), Ezh2Δ/Δ (n = 13), and Tet2KD/KDEzh2Δ/Δ (n = 23) mice are plotted as dots and the mean values are indicated as bars. (B) The hematopoietic compartment of the PB assessed by manual differential cell counts, performed at 12 wk after deletion of Ezh2. WT (n = 5), Tet2KD/KD (n = 7), Ezh2Δ/Δ (n = 5), and Tet2KD/KDEzh2Δ/Δ (n = 6) mice are represented as mean ± SEM. Arrowheads indicate statistically significant populations compared with WT (P < 0.05). (C) Smear preparation of PB from WT, Tet2KD/KD, Ezh2Δ/Δ, and Tet2KD/KDEzh2Δ/Δ mice at 12 wk after deletion of Ezh2 observed after May-Giemsa staining. Bar, 10 µm. Hyposegmented neutrophils consistent with a pseudo Pelger-Huët anomaly (bottom right), hypersegmented neutrophils (bottom left), and dysplastic monocyte (top right) are depicted in insets. Bar, 5 µm. (D) BM analysis of WT, Tet2KD/KD, Ezh2Δ/Δ, and Tet2KD/KDEzh2Δ/Δ mice at 12 wk after deletion of Ezh2. Absolute numbers of total BM cells from a unilateral pair of the femur and the tibia of WT (n = 7), Tet2KD/KD (n = 9), Ezh2Δ/Δ (n = 8), and Tet2KD/KDEzh2Δ/Δ mice (n = 7) are plotted as dots and mean values are indicated as bars (left). The percentage of LSK cells (middle) and myeloid progenitors (right) are presented as mean ± SEM (WT, n = 7; Tet2KD/KD, n = 6; Ezh2Δ/Δ, n = 6; Tet2KD/KDEzh2Δ/Δ, n = 6). (E) Extramedullary hematopoiesis in the spleen of Tet2KD/KD, Ezh2Δ/Δ, and Tet2KD/KDEzh2Δ/Δ mice at 12 wk after deletion of Ezh2. Spleen weights of WT (n = 8), Tet2KD/KD (n = 7), Ezh2Δ/Δ (n = 8), and Tet2KD/KDEzh2Δ/Δ mice (n = 7) are plotted as dots and mean values are indicated as bars (left). Percentage of LSK cells (middle) and myeloid progenitors (right) are presented as mean ± SEM (WT, n = 5; Tet2KD/KD, n = 5; Ezh2Δ/Δ, n = 7; Tet2KD/KDEzh2Δ/Δ, n = 4). *, P < 0.05; **, P < 0.01; ***, P < 0.001.
BM analysis at 3 mo after deletion of Ezh2 revealed that although total BM cell numbers were mildly increased only in Tet2KD/KD mice, all mutant mice had a greater proportion of LSK cells than the WT mice (Fig. 4 D). Similarly, Tet2KD/KD, Ezh2Δ/Δ, and Tet2KD/KDEzh2Δ/Δ mice had a greater proportion of common myeloid progenitors (CMPs) and/or MEPs (Fig. 4 D). Furthermore, extramedullary hematopoiesis was evident in the spleen of all mutant mice as defined by a significant increase in the absolute number of LSK cells and myeloid progenitors, although splenomegaly was evident only in Tet2KD/KD mice, likely because of impaired lymphopoiesis in the absence of Ezh2 (Fig. 4 E).
Ezh2Δ/Δ and Tet2KD/KDEzh2Δ/Δ mice develop myelodysplastic disorders
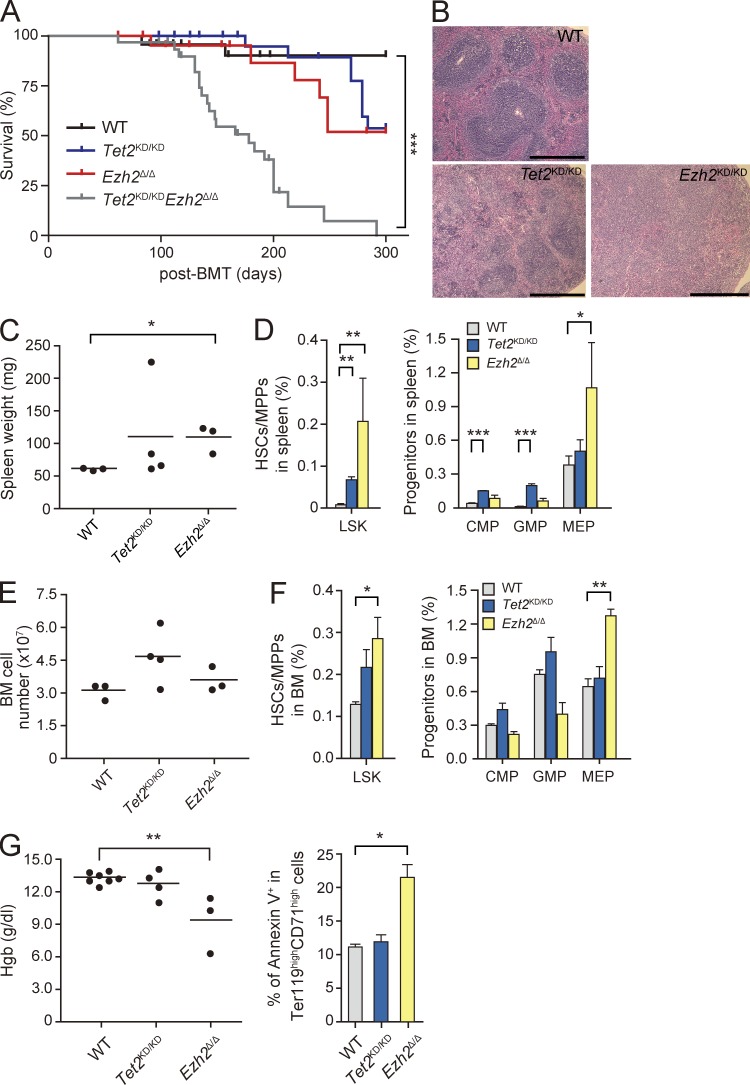
During a long observation period, we found that not only Tet2KD/KD mice but also Ezh2Δ/Δ mice die of hematological disorders. This is the first study to describe the lethal hematologic phenotypes caused by loss of Ezh2. Tet2KD/KD mice developed CMML-like disease accompanied by monocytosis and extramedullary hematopoiesis as reported previously (Moran-Crusio et al., 2011) and half of the mice died by 10 mo after transplantation. Notably, Ezh2Δ/Δ mice also developed MDS/MPN-like disease and half of the mice died by 10 mo after transplantation (Fig. 5 A and Table S2). They showed myeloproliferative features characterized by active extramedullary hematopoiesis in the spleen as evident from splenomegaly with a marked increase in LSK cells and MEPs resulting in effacement of lymphoid follicles (Fig. 5, B–D). They also showed a significant increase in LSK cells and MEPs in the BM, whereas they did not show obvious monocytosis in the PB (Fig. 5, E and F; and Table S2). They were anemic and showed increased apoptosis in Ter119highCD71high erythroblasts (Fig. 5 G) and LSK cells (Fig. 6 E) in the BM, suggesting ineffective erythropoiesis, a feature compatible with myelodysplastic disorders. Ezh2Δ/Δ mice also showed dysplasia of myeloid cells as described above (Fig. 4 C).
Figure 5.
Ezh2Δ/Δ mice develop myelodysplastic disorders. (A) Kaplan-Meier survival curve of WT (n = 24), Tet2KD/KD (n = 28), Ezh2Δ/Δ (n = 23), and Tet2KD/KDEzh2Δ/Δ (n = 32) mice. Some of the mice (WT, n = 11; Tet2KD/KD, n = 11; Ezh2Δ/Δ, n = 11; Tet2KD/KDEzh2Δ/Δ, n = 13) were sacrificed for analyses in the middle of observation (indicated by short vertical bars on the curves). These survival curves were generated from two to four independent experiments. n.s., not significant. (B) Hematoxylin and Eosin (H&E) staining of paraffin-embedded sections of spleen. Bars, 500 µm. (C) Spleen weights plotted as dots with the mean values indicated as bars (WT, n = 3; Tet2KD/KD, n = 4; and Ezh2Δ/Δ, n = 3). (D) The percentage of LSK cells and myeloid progenitors in the spleen presented as mean ± SEM (WT, n = 5; Tet2KD/KD, n = 4; and Ezh2Δ/Δ, n = 3). (E) Absolute numbers of total BM cells from a unilateral pair of the femur and the tibia are plotted as dots and mean values are indicated as bars. (F) Percentage of LSK cells and myeloid progenitors in the BM presented as mean ± SEM. The numbers of mice analyzed are WT, n = 3; Tet2KD/KD, n = 4; and Ezh2Δ/Δ, n = 3. (G) Hemoglobin contents in PB are plotted as dots and mean values are indicated as bars (left). Percentage of Annexin V+ cells in Ter119highCD71high BM erythroblasts is also shown as mean ± SEM from three independent experiments. The numbers of mice analyzed are WT, n = 3; Tet2KD/KD, n = 3; and Ezh2Δ/Δ, n = 3 (right). *, P < 0.05; **, P < 0.01; ***, P < 0.001.
Figure 6.
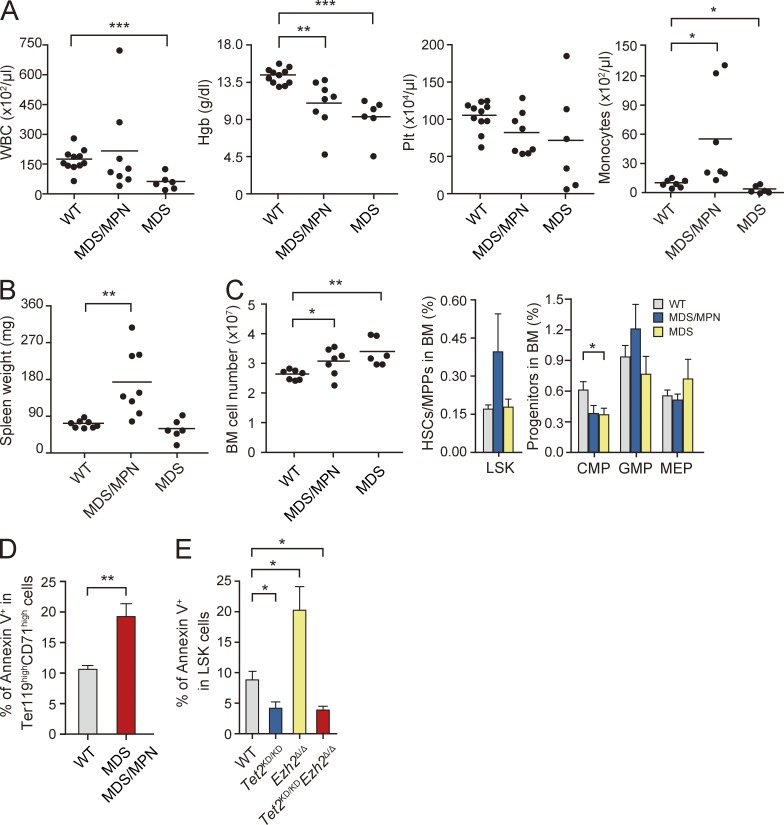
Tet2KD/KDEzh2Δ/Δ mice develop myelodysplastic disorders. (A–C) Hematological data from moribund Tet2KD/KDEzh2Δ/Δ mice and those surviving at 300 d after transplantation. PB cell counts and the number of monocytes in the PB (A), spleen weights (B), and absolute numbers of total BM cells from a unilateral pair of the femur and the tibia (C, left) are plotted as dots and mean values are indicated as bars. Percentage of LSK cells (C, middle) and myeloid progenitor cells (C, right) are presented as mean ± SEM. Data were collected from WT (n = 8), MDS/MPN (n = 8), and MDS (n = 6) mice for spleen weights and WT (n = 11), MDS/MPN (n = 7), and MDS (n = 6) mice for others. (D) Percentage of Annexin V+ cells in Ter119highCD71high BM erythroblasts shown as mean ± SEM from three independent experiments (WT, n = 3; MDS/MPN, n = 2; MDS, n = 2). (E) Percentage of Annexin V+ cells in LSK cells from the indicated mice at 8 mo after transplantation shown as mean ± SEM from three independent experiments (WT, n = 3; Tet2KD/KD, n = 3; Ezh2Δ/Δ, n = 3; and Tet2KD/KDEzh2Δ/Δ, n = 3). *, P < 0.05; **, P < 0.01; ***, P < 0.001.
To our surprise, concurrent deletion of Tet2 and Ezh2 significantly shortened the latency of disease development and all Tet2KD/KDEzh2Δ/Δ mice died by 10 mo after transplantation (Fig. 5 A). Histological analysis of moribund Tet2KD/KDEzh2Δ/Δ mice revealed lethal pneumonia in all mice analyzed (n = 6; unpublished data). Tet2KD/KDEzh2Δ/Δ mice developed heterogeneous diseases which were classified into two types of myeloid neoplasms: (1) MDS/MPN including CMML (n = 8) and (2) MDS (n = 6; Table S2). MDS/MPN mice showed myeloproliferative features, including CMML-like monocytosis in the PB (Fig. 6 A and Table S2) and/or splenomegaly with extramedullary hematopoiesis (Fig. 6 B), and an increase in LSK cells in the BM (Fig. 6 C). In contrast, MDS mice did not show obvious myeloproliferative features but showed a trend of pancytopenia (Fig. 6 A and Table S2). Myeloid dysplasia, including delayed maturation of neutrophils, a pseudo Pelger-Huët anomaly, hypersegmented neutrophils, and dysplasia of monocytes, was evident in Tet2KD/KDEzh2Δ/Δ mice compared with Tet2Δ/Δ and Ezh2Δ/Δ mice as described above (Fig. 4 C). Furthermore, MDS and MDS/MPN mice had a lower proportion of Ter119+ erythroblasts compared with WT mice (unpublished data). The proportion of Annexin V+ cells in CD71highTer119high erythroblasts was significantly higher in both MDS and MDS/MPN mice compared with their WT counterparts, implicating enhanced apoptosis as a cause of anemia (Fig. 6 D). In contrast, enhanced apoptosis in the absence of Ezh2 was canceled by loss of Tet2 in LSK cells at 8 mo after transplantation (Fig. 6 E), suggesting differential impact of loss of Ezh2 and Tet2 on apoptosis in disease-initiating cells.
Alterations in expression of Ezh1 target genes associated with disease progression
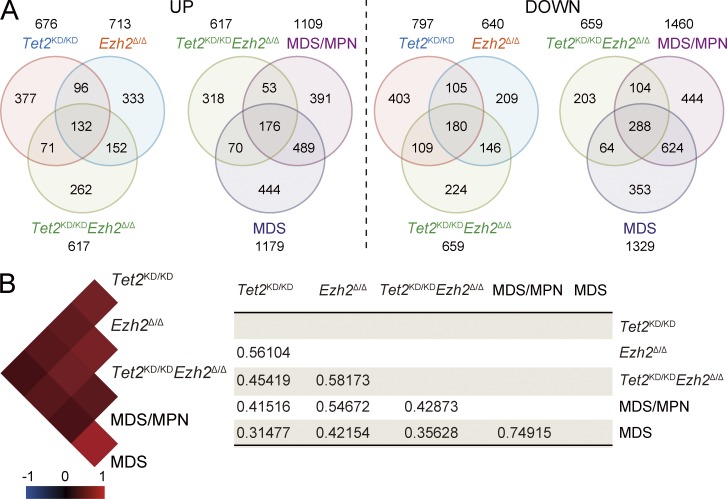
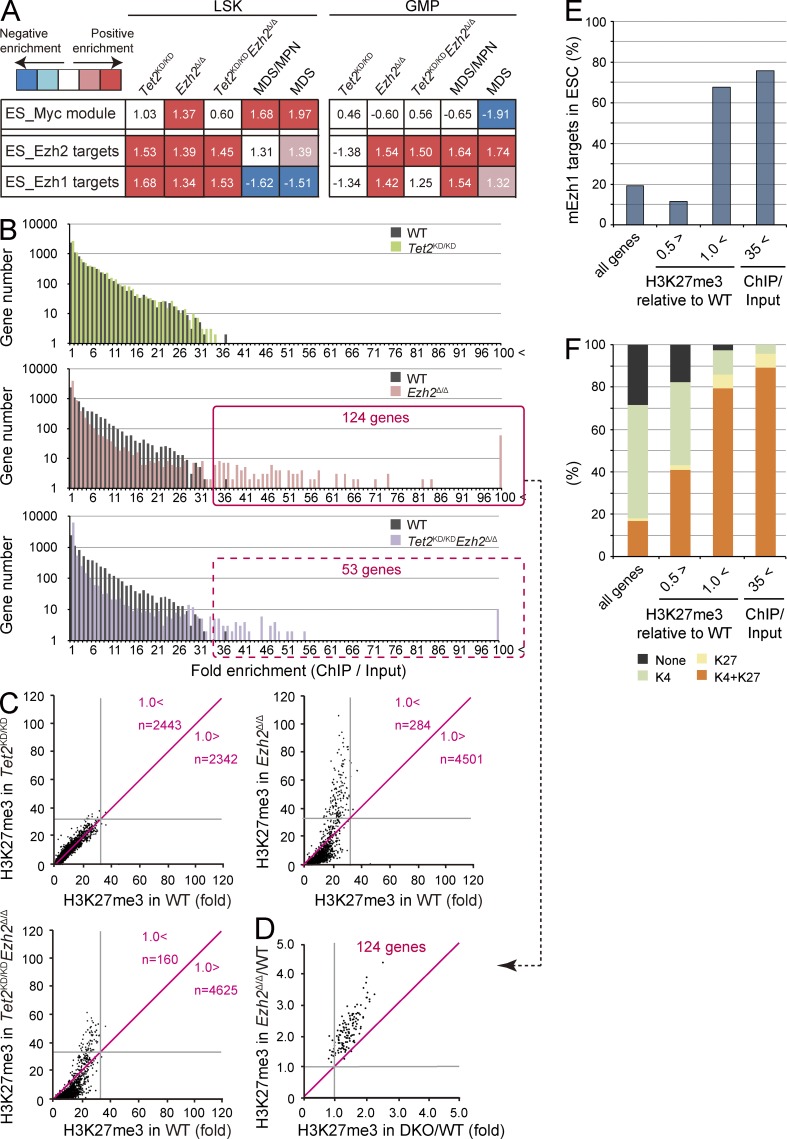
To elucidate the changes in gene expression responsible for the hematological phenotypes induced by loss of Ezh2 and/or Tet2, we performed microarray analysis using LSK cells and GMPs from each mutant mouse at 3 mo after deletion of Ezh2 and MDS/MPN and MDS mice. Of interest, there was significant overlap between genes up-regulated or down-regulated in Tet2KD/KD and Ezh2Δ/Δ LSK cells. This was true among all genotypes and diseases, and the overall gene expression profiles were highly correlated with each other (Fig. 7). To better understand the consequences of the loss of Ezh2 and/or Tet2, we next performed gene set enrichment analysis (GSEA; Subramanian et al., 2005). Embryonic stem (ES) cell–like signatures, which have been widely used in assessment of cancer gene signatures, are subdivided into a PRC module, a Myc module, and a core ES module (Kim et al., 2010). Among these, the Myc module, which is active in various cancers and predicts cancer outcome, was significantly enriched in Ezh2Δ/Δ LSK cells and became highly enriched in Tet2KD/KDEzh2Δ/Δ LSK cells during the development of MDS/MPN and MDS (Fig. 8 A). Of note, the Myc module became enriched in LSK cells but not in GMPs, suggesting the existence of pathological stem cells in the LSK fraction. Several modules related to enhanced cell cycle were also positively enriched in MDS/MPN and MDS LSK cells (unpublished data). We next analyzed gene sets of Ezh2 targets that lose H3K27me3 upon deletion of Ezh2 in ES cells (ES_Ezh2 targets) and Ezh1 targets profiled in Ezh2−/− ES cells (ES_Ezh1 targets; Shen et al., 2008). As expected, all of the PRC2 gene sets showed a trend of positive enrichment (derepression) in Ezh2Δ/Δ and Tet2KD/KDEzh2Δ/Δ LSK cells and GMPs (Fig. 8 A). Notably, however, Ezh1 targets were negatively enriched (repressed) and the degree of positive enrichment of Ezh2 targets was attenuated in Tet2KD/KDEzh2Δ/Δ LSK cells from mice which developed myelodysplastic disorders. These data suggest compensatory action by Ezh1 in LSK cells during the development of myelodysplastic disorders. Of interest, both the Ezh1 and Ezh2 targets were positively enriched even in Tet2KD/KD LSK cells, suggesting some involvement of Tet2 in PRC2-mediated gene silencing in HSC/MPPs.
Figure 7.
Gene expression alterations associated with disease progression. (A) Venn diagram of genes up-regulated or down-regulated in LSK cells from Tet2KD/KD, Ezh2Δ/Δ, and Tet2KD/KDEzh2Δ/Δ mice at 4 mo after transplantation and MDS/MPN (ID19) and MDS (ID18) mice (>2.0- or <0.5-fold compared with the WT control, respectively). The numbers of genes in each group are indicated. The overlaps between every two gene sets are statistically significant (P < 0.01). (B) A heat map showing the correlation of overall gene expression profiles among LSK cells from the indicated mice. Black, red, and blue colors represent no, positive, and negative correlation, respectively. The score of correlation coefficient between LSK cells from each genotype or diseased mice was defined with Pearson’s correlation and is shown on the right.
Figure 8.
Alterations in gene expression and H3K27me3 levels upon deletion of Ezh2. (A) Gene expression alterations associated with disease progression. Normalized enrichment score (NES) from overall gene expression profiles of LSK cells and GMPs derived from GSEA is shown as the number in each cell. Red and blue colors represent positive (up-regulated in the given genotype relative to WT) and negative (up-regulated in WT relative to the given genotype) enrichment, respectively. Concentrated colors show that the nominal p-value is <0.05 and false discovery rate (FDR) is <0.05, which suggests meaningful enrichment for the given gene sets. Pale colors show borderline enrichment. The cells which do not meet these criteria show white color. (B) Summary of H3K27me3 enrichment detected by ChIP-seq analysis. GMPs isolated from primary recipient mice at 4 mo after transplantation were subjected to ChIP-seq analysis using an anti-H3K27me3 antibody. The fold enrichment values of H3K27me3 signals were calculated against the input signals (ChIP/input) from 5.0 kb upstream to 0.5 kb downstream of the TSSs of RefSeq genes. The red boxes indicate genes with the H3K27me3 enrichment >35-fold in Ezh2Δ/Δ and Tet2KD/KDEzh2Δ/Δ GMPs. (C) Scatter plots of H3K27me3 enrichment in Tet2KD/KD, Ezh2Δ/Δ, and Tet2KD/KDEzh2Δ/Δ GMPs in comparison with that in WT GMPs. Gray lines indicate 35-fold enrichment, which is the value defined as high enrichment in A. The numbers of genes with higher and lower fold enrichment than that of WT (divided by red lines) are indicated. (D) Scatter plots of 124 genes enclosed by a red square in B showing the H3K27me3 enrichment >35-fold relative to WT in Ezh2Δ/Δ and Tet2KD/KDEzh2Δ/Δ (DKO) GMPs. Gray lines indicate 1.0, which is the value indicating that Ezh2Δ/Δ and Tet2KD/KDEzh2Δ/Δ GMPs showed the same fold enrichment as WT. (E and F) The proportion of Ezh1 target genes (E) and genes that are marked with univalent (H3K4me3 or H3K27me3) or bivalent histone domains (H3K4me3 and H3K27me3; F) identified in ES cells were categorized by the changes in H3K27me3 levels in Ezh2Δ/Δ GMPs. The proportions in all RefSeq genes are shown in the first lane. PRC2 target genes were subdivided into genes with reduced H3K27me3 levels (<0.5-fold compared with WT), genes that maintained H3K27me3 levels (>1-fold compared with WT), and genes with the H3K27me3 enrichment >35-fold compared with input in Ezh2Δ/Δ GMPs in B.
Alterations in H3K27me3 upon deletion of Ezh2
To assess the genome-wide effects of loss of Ezh2 and/or Tet2 on epigenome, we conducted chromatin immunoprecipitation sequencing (ChIP-seq) for H3K27me3 in hematopoietic cells from WT, Tet2KD/KD, Ezh2Δ/Δ, and Tet2KD/KDEzh2Δ/Δ mice at 4 mo after transplantation. Due to the paucity of LSK HSC/MPPs, we used GMPs for ChIP-seq analysis and characterized the H3K27me3 levels over the region from 5.0 kb upstream to 0.5 kb downstream of transcriptional start sites (TSSs) of Reference Sequence (RefSeq) genes (Pruitt et al., 2007). As expected, drastic reductions in the levels of H3K27me3 were observed in GMPs from Ezh2Δ/Δ and Tet2KD/KDEzh2Δ/Δ mice, although considerable levels of H3K27me3 remained even in the absence of Ezh2 (Fig. 8 B). Among PcG targets (greater than fourfold enrichment of H3K27me3 compared with input in WT GMPs) that showed greater than twofold reduction of H3K27me3 levels in Tet2KD/KDEzh2Δ/Δ GMPs, 121 genes were derepressed greater than twofold in both MDS/MPN and MDS LSK cells compared with WT. These genes included 24 potential oncogenes such as Hmga2 (Oguro et al., 2012), Pbx3 (Li et al., 2013), and Lmo1 (Tremblay et al., 2010; Table S3).
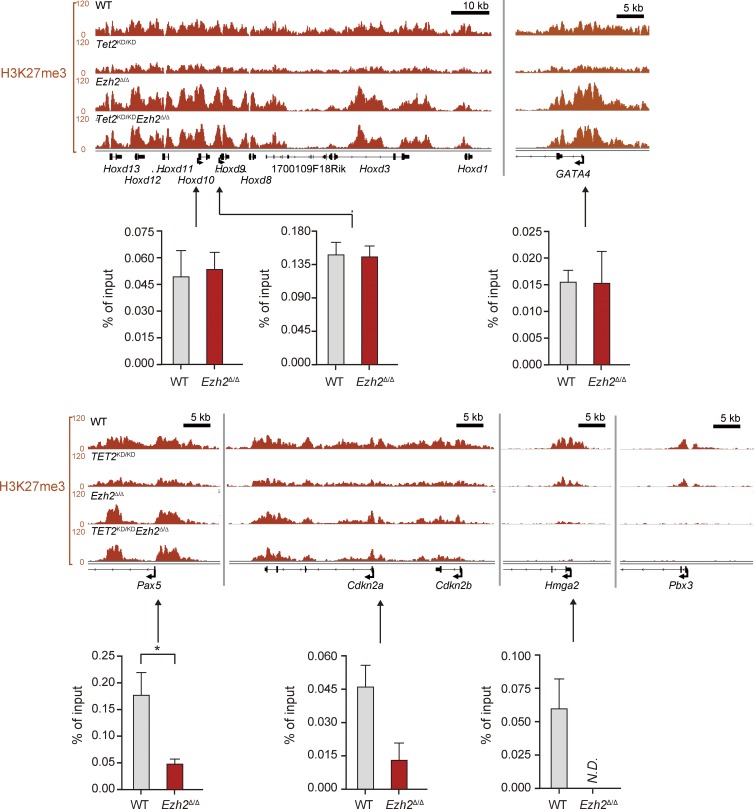
Surprisingly, H3K27me3 marks around TSSs became more enriched (greater than onefold compared with WT) in a small portion of genes upon deletion of Ezh2, particularly in Ezh2Δ/Δ GMPs (Fig. 8, B–D), suggesting a major role for Ezh1 on these gene promoters. Indeed, these genes overlapped considerably with the targets of Ezh1 in ES cells (Shen et al., 2008; Fig. 8 E), and this trend was more obvious with genes that showed high levels of H3K27me3 (>35-fold enrichment of H3K27me3 compared with input in Ezh2Δ/Δ GMPs). More importantly, the genes that maintained H3K27me3 levels upon deletion of Ezh2 were overlapped markedly with genes marked with bivalent histone domains in ES cells (Bernstein et al., 2006; Ku et al., 2008; Fig. 8 F). This trend was again more obvious with the 124 genes that showed high levels of H3K27me3 (>35-fold enrichment of H3K27me3 in Ezh2Δ/Δ GMPs), and most of these genes appeared to be canonical developmental regulators, including genes encoding homeobox, paired-box, T-box, forkhead, and Gata family transcription factors and zinc finger DNA-binding proteins (Table S4). Because the amounts of DNA immunoprecipitated from Ezh2Δ/Δ and Tet2KD/KD Ezh2Δ/Δ GMPs are less than those from WT and Tet2KD/KD GMPs, we may somewhat overestimate the H3K27me3 levels in Ezh2Δ/Δ and Tet2KD/KD Ezh2Δ/Δ GMPs. However, quantitative ChIP analysis confirmed the trend of ChIP-sequence data (Fig. 9). These results suggest that Ezh1 plays a crucial role in keeping key developmental regulator genes transcriptionally repressed.
Figure 9.
The levels of H3K27me3 at promoter regions in GMPs. Visualization of ChIP-seq data of the H3K27me3 levels of several developmental regulator genes (Hoxd locus, Gata4, and Pax5), tumor suppressor genes (Cdkn2a and Cdkn2b) and oncogenes (Hmga2 and Pbx3) in GMPs from WT, Tet2KD/KD, Ezh2Δ/Δ, and Tet2KD/KDEzh2Δ/Δ mice at 4 mo after transplantation using the Integrative Genomics Viewer (IGV). Schematic diagram of these gene loci indicates their genomic structures. Exons and untranslated regions are demarcated by large and small black boxes, respectively. Data of ChIP analyses at the promoters of selected genes are also depicted. Quantitative ChIP analyses of GMPs from WT and Ezh2Δ/Δ mice at 6 mo after transplantation were performed. The relative amounts of immunoprecipitated DNA are depicted as a percentage of input DNA. N.D. indicates not detected. The data are shown as the mean ± SEM for triplicate analyses. Regions amplified from the precipitated DNA by site-specific quantitative PCR are indicated by arrows. *, P < 0.05.
DISCUSSION
In this study, we first demonstrated that the deletion of Ezh2 confers a growth advantage to HSCs and results in an MDS/MPN-like disease in mice, similar to the depletion of Tet2. Ezh2Δ/Δ mice developed a lethal MDS/MPN-like disease with myeloproliferative features, including enhanced repopulating capacity of HSCs and extramedullary hematopoiesis in the spleen, and myelodysplastic features, such as anemia accompanied by enhanced apoptosis in erythroblasts and dysplasia in myeloid cells. These findings are compatible with the recurrent inactivation of EZH2 genes in myelodysplastic disorders and strongly support the tumor suppressor function of EZH2. Although no mutations have been identified in PRC1 genes, we recently reported that concurrent loss of the PRC1 gene Bmi1 along with Ink4a/Arf in mice causes pathological hematopoiesis that mimics human primary myelofibrosis, a disease categorized as an MPN (Oguro et al., 2012). Together, inactivation of PcG genes could contribute to the pathogenesis of malignant stem cell disorders.
We further demonstrated that inactivating Ezh2 and TET2 mutations coexist in 6.7% of patients with myelodysplastic disorders, and concurrent deletion of Ezh2 and Tet2 in mice accelerates the development of heterogeneous myelodysplastic disorders including MDS and MDS/MPN. Of note, Tet2KD/KDEzh2Δ/Δ mice showed more advanced myelodysplastic features compared with Tet2KD/KD and Ezh2Δ/Δ mice. This is the first study to describe the cooperative effects of the two independent mutations in the pathogenesis of myelodysplastic disorders. Extensive mutation analyses of the myeloid malignancies have revealed that most MDS and MDS/MPN patients have several concurrent genetic mutations, but their pathological meanings remain to be addressed. Our findings highlight the cooperative effects of the independent mutations in the pathogenesis of myelodysplastic disorders. It is assumed that the deregulated gene expression upon concurrent depletion of Tet2 and Ezh2 accounts for enhancement in the myelodysplastic features, such as dysplasia of myeloid cells, functional defects in neutrophils, and enhanced apoptosis in erythroid cells, although these details require further investigation. On the contrary, EZH2 mutations are very rare in de novo AML and chronic myeloid leukemia in blastic transformation (CML-BC; Ernst et al., 2010; Chung et al., 2012; Raza and Galili, 2012; Shih et al., 2012), and MDS patients with EZH2 mutations have much lower risk of transformation to AML compared with those with other gene mutations (Chung et al., 2012; Raza and Galili, 2012; Shih et al., 2012). Indeed, no Ezh2Δ/Δ and Tet2KD/KDEzh2Δ/Δ mice developed AML in this study. We and other groups have previously reported that deletion of Ezh2 largely attenuates the leukemogenecity of AML in a mouse model (Neff et al., 2012; Tanaka et al., 2012). These findings suggest differential roles of EZH2 in AML versus MDS and MDS/MPN.
Although deletion of Ezh2 results in a drastic reduction in H3K27me3 levels, considerable levels of H3K27me3 are retained. The genes that maintained H3K27me3 levels after loss of Ezh2 largely overlap with the targets of Ezh1 in ES cells, and most of these genes are developmental regulator genes that are marked with bivalent histone domains (Bernstein et al., 2006; Ku et al., 2008). Furthermore, tumor suppressor genes such as Ink4a/Arf, a critical PcG target for the maintenance of the self-renewal capacity of HSCs (Oguro et al., 2006), and PcG-targeted developmental regulator genes, such as Pax5 (Oguro et al., 2010), were kept closely repressed by reduced but significant levels of H3K27me3 modification (Fig. 9). These findings indicate that Ezh1 is capable of repressing developmental regulator genes and tumor suppressor genes, acting to maintain pathological stem cells in the absence of Ezh2. Of interest, Ezh1 was recently reported to maintain HSCs in a slow-cycling, undifferentiated state (Hidalgo et al., 2012). Together, our findings suggest that Ezh1 plays a critical role in pathological stem cells as well as HSCs.
In contrast, several PcG targets became derepressed in Ezh2Δ/Δ and Tet2KD/KDEzh2Δ/Δ LSK cells. These included many direct PcG targets that are potential oncogenes, such as Hmga2, Pbx3, and Lmo1. Furthermore, the Myc module, which is active in various cancers, was positively enriched in Ezh2Δ/Δ LSK cells and further enriched in MDS/MPN and MDS LSK cells. The derepression of PcG-targeted oncogenes in conjunction with the up-regulation of the Myc module could function as the major drivers in HSCs for the induction of myelodysplastic and myeloproliferative disorders in the absence of Ezh2.
Of interest, Ezh2 knock-in (Ezh2-KI) mice overexpressing Ezh2 specifically in hematopoietic cells develop MPN (Herrera-Merchan et al., 2012). Ezh2-KI mice show an enhanced HSC activity similarly to Ezh2Δ/Δ mice in this study. GSEA showed significant positive enrichment of the Myc module in both Ezh2Δ/Δ and Ezh2-KI LSK cells (unpublished data). However, Ezh2-KI mice do not show myelodysplastic features. Apoptosis in LSK cells is suppressed in Ezh2-KI mice but enhanced in Ezh2Δ/Δ mice. Ezh2-KI LSK cells show enhanced colony-forming capacity, whereas Ezh2Δ/Δ LSK cells show severely compromised proliferation in culture probably due to failure in the transcriptional repression of tumor suppressor genes such as p19Arf (unpublished data), as we have previously reported in transformed myeloid progenitors (Tanaka et al., 2012). These findings clearly discriminate the effects of overexpression and loss/hypomorphism of Ezh2 on hematopoiesis, even though both results in clonal propagation of HSCs.
Finally, the functional cross talk between DNA and histone modifications is an intriguing issue to understand the epigenetics of myeloid malignancies. Tet2KD/KDEzh2Δ/Δ mice developed not only MDS/MPN but also MDS, whereas Ezh2Δ/Δ mice developed only MDS/MPN. Moreover, myelodysplastic features were more pronounced in Tet2KD/KDEzh2Δ/Δ mice compared with Ezh2Δ/Δ mice. These findings suggest that loss of Ezh2 and Tet2 cooperate to generate a MDS phenotype in mice. However, enhanced apoptosis in the absence of Ezh2 was significantly attenuated in LSK cells, but not in erythroblasts, upon down-regulation of the Tet2 expression, suggesting an opposing impact of loss of Ezh2 and Tet2 on apoptosis in MDS-initiating hematopoietic stem and progenitor cells.
The understanding of the pathological significance of each somatic gene mutation in myeloid malignancies is just starting to be revealed. Nevertheless, our findings clearly indicate that mouse models, including our own, are capable of faithfully mimicking myelodysplastic disorders and can serve as valuable tools for the analysis of epigenomics of myelodysplastic disorders and preclinical therapeutic studies.
MATERIALS AND METHODS
Sequencing analysis of primary samples with MDS and related myeloid neoplasms.
Genomic DNAs from 119 BM samples with MDS and related neoplasms were analyzed for mutations of TET2, IDH1, IDH2, EZH2, and ASXL1 genes by high-throughput sequencing of SureSelect-enriched target exons (Agilent Technologies) according to manufacturer’s protocol. Genome-wide copy number lesions were also analyzed using GeneChip SNP-genotyping microarrays (Affymetrix) as previously described (Chen et al., 2008). Allelic imbalances were detected from the allele-specific copy numbers calculated using CNAG/AsCNAR software (http://www.genome.umin.jp; Nannya et al., 2005; Yamamoto et al., 2007). All mutations were confirmed by Sanger-sequencing. All patient samples were appropriately anonymized before the analysis according to the protocol approved by the Ethics Boards of the University of Tokyo.
Mice and generation of fetal liver chimeras.
Tet2KD/KD and Ezh2fl/fl mice, which had been backcrossed at least eight times onto a C57BL/6 (CD45.2) background, were used (Mochizuki-Kashio et al., 2011; Shide et al., 2012). For conditional deletion of Ezh2, the mice were crossed with Rosa::Cre-ERT mice (Taconic). C57BL/6 (CD45.2) mice were purchased from Japan SLC. C57BL/6 mice congenic for the Ly5 locus (CD45.1) were purchased from Sankyo-Lab Service. All experiments using the mice were performed in accordance with our institutional guidelines for the use of laboratory animals and approved by the Review Board for animal experiments of Chiba University (approval ID: 25–104). To generate fetal liver chimeras, we intravenously transplanted E14.5 fetal liver from CD45.2 mutant mice (test cells) into 8-wk-old CD45.1 recipients irradiated at a dose of 9.5 Gy. After 1 mo, the recipient mice were injected with 100 µl tamoxifen dissolved in corn oil at a concentration of 10 mg/ml intraperitoneally once a day for 5 consecutive days to induce Cre activity.
Serial transplantation assay.
600 CD45.2 LSK cells were sorted from the BM of the primary recipient mice reconstituted with WT, Tet2KD/KD, Ezh2Δ/Δ, and Tet2KD/KDEzh2Δ/Δ cells at 4 mo after transplantation and injected into lethally irradiated CD45.1 mice (secondary recipient mice) along with 4 × 10⁵ BM cells (CD45.1) for competitor cells. For tertiary transplantation, 2 × 10⁶ whole BM cells taken from the secondary recipient mice 4 mo after transplantation were injected into lethally irradiated CD45.1 mice.
Western blot analysis of H3K27me3.
Samples were separated by SDS-PAGE, transferred to a PVDF membrane and detected by Western blotting using the following antibodies: anti-H3 (Abcam) and anti-H3K27me3 (Millipore).
Flow cytometry and antibodies.
mAbs recognizing the following antigens were used in flow cytometry and cell sorting: CD45.2 (104), CD45.1 (A20), Gr-1 (RB6-8C5), CD11b/Mac-1 (M1/70), Ter-119, CD127/IL-7Rα (A7R34), B220 (RA3-6B2), CD4 (L3T4), CD8α (53–6.7), CD117/c-Kit (2B8), Sca-1 (D7), and CD16/32/FcγRII-III (93). The mAbs were purchased from BD, eBioscience, or BioLegend. For Annexin V staining, cells were suspended with 1× Annexin binding buffer (BD) and stained with FITC-Annexin V (BD) according to the manufacturer’s protocol. Dead cells were eliminated by staining with 1 µg/ml propidium iodide (Sigma-Aldrich). All flow cytometric analyses and cell sorting were performed on a FACSAria II or FACSCanto II (BD).
Microarray analysis.
A one-color microarray-based gene expression analysis system (Agilent Technologies) containing 39,429 clones was used (SurePrint G3 Mouse GE 8 × 60K array; Agilent Technologies), according to the manufacturer’s instructions. Total RNA was extracted from 5 × 10⁴ sorted LSK cells or GMPs. A total of 10 ng of total RNA was mixed with spike-in controls using a One Color Spike Mix kit (Agilent Technologies), amplified and labeled with Cyanine 3 using a Quick Amp Labeling kit (Agilent Technologies) according to the manufacturer’s instructions, which generated single-color labeled cRNA. A total of 1,650 ng of the labeled cRNA was used for each hybridization. The process of hybridization and washing was performed using a Hi-RPM Gene Expression Hybridization kit (Large; Agilent Technologies) and a Gene Expression Wash Pack (Agilent Technologies), respectively. A DNA microarray scanner (Agilent Technologies) was used for array scanning.
qRT-PCR.
Total RNA was isolated using TRIZOL LS solution (Invitrogen) and reverse transcribed by the ThermoScript RT-PCR system (Invitrogen) with an oligo-dT primer. Real-time quantitative RT-PCR (qRT-PCR) was performed with an ABI Prism 7300 Thermal Cycler (Applied Biosystems) using FastStart Universal Probe Master (Roche) and the indicated combinations of Universal Probe Library (Roche) and primers listed below.
Primer sequences and probe numbers for real-time RT-PCR (forward/reverse): Hmga2, 5′-AAGGCAGCAAAAACAAGAGC-3′/5′-CCGTTTTTCTCCAATGGTCT-3′; Pbx3, 5′-GCCTTGGAGCAAACTCACTG-3′/5′-AGATGGAGTTGTTGCGTCCT-3′; Hprt1, 5′-TCCTCCTCAGACCGCTTTT-3′/5′-CCTGGTTCATCATCGCTAATC-3′. Primer sequences for manual ChIP analysis at promoter regions: (forward/reverse primer) Hoxd10, 5′-TCTCATTGGCTTGGTTGTCA-3′/5′-CAGGAGAGCTGTTGGGAAAG-3′; Hoxd9, 5′-TTAAACAACACGCCAAGCTG-3′/5′-AAACCCATCCCTACACACACA-3′; Gata4, 5′-ACAGCTCTCTGGTGGCTCTC-3′/5′-AGGTGGTATTCCAGCCCTCT-3′; Pax5, 5′-CCACTGGACAATGGCAGTTT-3′/5′-TCCCCCTATCCTCGAACTCT-3′; Cdkn2a, 5′-GATGGAGCCCGGACTACAGAAG-3′/5′-CTGTTTCAACGCCCAGCTCTC-3′; Hmga2, 5′-AAAACTTGGGCTCCGGGTGCAGA-3′/5′-GGGCGCCCAGCTCAGCTCTAG-3′.
ChIP assay and ChIP assay coupled with massive parallel sequencing (ChIP-Seq).
GMPs from the BM of recipient mice were cross-linked with 0.5% formaldehyde for 5 min at room temperature, washed three times with PBS, and lysed with RIPA buffer (10 mM Tris, pH 8.0, 140 mM NaCl, 1 mM EDTA, 1% Triton X-100, 0.1% SDS, 0.1% sodium deoxycholate [DOC], and protease inhibitor cocktail) and sonicated for 30 min using a Microson XL2000 Ultrasonic cell disruptor (Misonix). The mean chromatin fragment size after sonication was ∼200–300 bp. After centrifugation, the soluble chromatin fraction was recovered, precleared for 1 h at 4°C with a mixture of Protein A– and G–conjugated Dynabeads (Invitrogen) blocked with BSA and salmon (Invitrogen), and then incubated with an anti-H3K27me3 antibody (07–449; Millipore) for 2 h at 4°C. Chromatin was immunoprecipitated overnight at 4°C with antibody-conjugated Dynabeads. The immunoprecipitates were extensively washed with the following combination of wash buffers: high salt RIPA buffer (10 mM Tris, pH 8.0, 500 mM NaCl, 1 mM EDTA, 1% Triton X-100, 0.1% SDS, 0.1% DOC, and protease inhibitor cocktail), LiCl wash buffer (10 mM Tris-HCl, pH 8.0, 250 mM LiCl, 1 mM EDTA, 0.5% NP-40, and 0.5% DOC), and TE buffer (10 mM Tris-HCl, pH 8.0, and 1 mM EDTA. Bound chromatin and input DNA were placed in elution buffer (10 mM Tris-HCl, pH 8.0, 5 mM EDTA, 300 mM NaCl, and 0.5% SDS) and reverse cross-linked. Immunoprecipitated DNA and input DNA were treated with RNase A (Sigma-Aldrich) and proteinase K (Roche), and purified with a QIAquick PCR purification kit (QIAGEN). For ChIP assay, quantitative PCR was performed with an ABI prism 7300 Thermal Cycler using SYBR Premix Ex Taq II (Takara Bio). The primer sequences are listed above. For ChIP-Seq, immunoprecipitated DNA and input samples were then prepared using ChIP-Seq Sample Prep kit (Illumina). Adaptor-ligated DNA fragments were size fractionated by 12% acrylamide gel, and the 170- to 250-bp fraction was recovered. DNA thus obtained was amplified by 18 cycles of PCR. 1 ng DNA was used for the sequencing reaction of the GAIIx (Illumina), according to the manufacturer’s instructions. A total of 170,000–250,000 clusters were generated per tile, and 36 cycles of the sequencing reactions were performed. Short-read sequences were aligned to the mouse genome sequences (mm9 from University of California, Santa Cruz Genome Browser; http://genome.ucsc.edu/) using the Eland program. Sequences allowing no more than two mismatches per sequence were used for the analysis. The ChIP-Seq signal was quantified as total number of reads per million. To enumerate genes with H3K27me3 modification, genes with cumulative tag numbers in the region 5.0 kb upstream of the TSS to 0.5 kb downstream of the TSS greater than twofold was selected.
Statistical analysis.
Heat map was drawn by Matrix2png (Pavlidis and Noble, 2003). Statistical tests were performed using Prism (version 5; GraphPad Software). For analysis of survival curves, log rank (Mantel-Cox) test was performed.
Deposition of the data.
Microarray and ChIP-sequence data were deposited in Gene Expression Omnibus (accession no. GSE42666) and DNA Data Bank of Japan (DDBJ, accession no. DRA000485-488), respectively.
Online supplemental material.
Table S1 lists the gene mutations and abnormalities in chromosome 7 in patient samples. Table S2 provides the detailed hematological characteristics of diseased mice. Table S3 lists the potential oncogenes of direct PcG targets derepressed in the absence of Ezh2. Table S4 lists the genes with a fold enrichment of H3K27me3 >35 compared with input in Ezh2-deficient GMPs. Online supplemental material is available at http://www.jem.org/cgi/content/full/jem.20131144/DC1.
Supplementary Material
Acknowledgments
We thank Terumi Horiuchi for data mining of the ChIP-seq analysis and Kazue Imai for assistance on statistical analysis.
This work was supported in part by Grants-in-aid for Scientific Research (#24249054 and #221S0002), Scientific Research on Innovative Areas “Genome Science” (#221S0002) and the Global COE Program (Global Center for Education and Research in Immune System Regulation and Treatment) from MEXT, Japan, a Grant-in-aid for Core Research for Evolutional Science and Technology (CREST) from the Japan Science and Technology Corporation (JST), and grants from the Takeda Science Foundation, the Uehara Memorial Foundation, and the Tokyo Biochemical Research Foundation.
The authors have no competing financial interests to declare.
Footnotes
Abbreviations used:
- AML
- acute myeloid leukemia
- AML/MRC
- AML with myelodysplasia-related changes
- ChIP-seq
- chromatin immunoprecipitation sequencing
- CMML
- chronic myelomonocytic leukemia
- DNMT3A
- DNA methyltransferase 3A
- ES
- embryonic stem
- GMP
- granulocyte-macrophage progenitor
- GSEA
- gene set enrichment analysis
- HSC
- hematopoietic stem cell
- IDH1
- isocitrate dehydrogenase 1
- MDS
- myelodysplastic syndrome
- MPN
- myeloproliferative neoplasm
- MPP
- multipotent progenitor cell
- PcG
- polycomb group
- PRC
- polycomb repressive complex
- RefSeq
- Reference Sequence
- TET2
- tet methylcytosine dioxygenase 2
- TSS
- transcriptional start site
References
- Abdel-Wahab O., Pardanani A., Patel J., Wadleigh M., Lasho T., Heguy A., Beran M., Gilliland D.G., Levine R.L., Tefferi A. 2011. Concomitant analysis of EZH2 and ASXL1 mutations in myelofibrosis, chronic myelomonocytic leukemia and blast-phase myeloproliferative neoplasms. Leukemia. 25:1200–1202 10.1038/leu.2011.58 [DOI] [PMC free article] [PubMed] [Google Scholar]
- Abdel-Wahab O., Adli M., LaFave L.M., Gao J., Hricik T., Shih A.H., Pandey S., Patel J.P., Chung Y.R., Koche R., et al. 2012. ASXL1 mutations promote myeloid transformation through loss of PRC2-mediated gene repression. Cancer Cell. 22:180–193 10.1016/j.ccr.2012.06.032 [DOI] [PMC free article] [PubMed] [Google Scholar]
- Bejar R., Stevenson K., Abdel-Wahab O., Galili N., Nilsson B., Garcia-Manero G., Kantarjian H., Raza A., Levine R.L., Neuberg D., Ebert B.L. 2011. Clinical effect of point mutations in myelodysplastic syndromes. N. Engl. J. Med. 364:2496–2506 10.1056/NEJMoa1013343 [DOI] [PMC free article] [PubMed] [Google Scholar]
- Bernstein B.E., Mikkelsen T.S., Xie X., Kamal M., Huebert D.J., Cuff J., Fry B., Meissner A., Wernig M., Plath K., et al. 2006. A bivalent chromatin structure marks key developmental genes in embryonic stem cells. Cell. 125:315–326 10.1016/j.cell.2006.02.041 [DOI] [PubMed] [Google Scholar]
- Challen G.A., Sun D., Jeong M., Luo M., Jelinek J., Berg J.S., Bock C., Vasanthakumar A., Gu H., Xi Y., et al. 2012. Dnmt3a is essential for hematopoietic stem cell differentiation. Nat. Genet. 44:23–31 10.1038/ng.1009 [DOI] [PMC free article] [PubMed] [Google Scholar]
- Chen Y., Takita J., Choi Y.L., Kato M., Ohira M., Sanada M., Wang L., Soda M., Kikuchi A., Igarashi T., et al. 2008. Oncogenic mutations of ALK kinase in neuroblastoma. Nature. 455:971–974 10.1038/nature07399 [DOI] [PubMed] [Google Scholar]
- Chung Y.R., Schatoff E., Abdel-Wahab O. 2012. Epigenetic alterations in hematopoietic malignancies. Int. J. Hematol. 96:413–427 10.1007/s12185-012-1181-z [DOI] [PubMed] [Google Scholar]
- Dey A., Seshasayee D., Noubade R., French D.M., Liu J., Chaurushiya M.S., Kirkpatrick D.S., Pham V.C., Lill J.R., Bakalarski C.E., et al. 2012. Loss of the tumor suppressor BAP1 causes myeloid transformation. Science. 337:1541–1546 10.1126/science.1221711 [DOI] [PMC free article] [PubMed] [Google Scholar]
- Ernst T., Chase A.J., Score J., Hidalgo-Curtis C.E., Bryant C., Jones A.V., Waghorn K., Zoi K., Ross F.M., Reiter A., et al. 2010. Inactivating mutations of the histone methyltransferase gene EZH2 in myeloid disorders. Nat. Genet. 42:722–726 10.1038/ng.621 [DOI] [PubMed] [Google Scholar]
- Herrera-Merchan A., Arranz L., Ligos J.M., de Molina A., Dominguez O., Gonzalez S. 2012. Ectopic expression of the histone methyltransferase Ezh2 in haematopoietic stem cells causes myeloproliferative disease. Nat Commun. 3:623 10.1038/ncomms1623 [DOI] [PubMed] [Google Scholar]
- Hidalgo I., Herrera-Merchan A., Ligos J.M., Carramolino L., Nuñez J., Martinez F., Dominguez O., Torres M., Gonzalez S. 2012. Ezh1 is required for hematopoietic stem cell maintenance and prevents senescence-like cell cycle arrest. Cell Stem Cell. 11:649–662 10.1016/j.stem.2012.08.001 [DOI] [PubMed] [Google Scholar]
- Kim J., Woo A.J., Chu J., Snow J.W., Fujiwara Y., Kim C.G., Cantor A.B., Orkin S.H. 2010. A Myc network accounts for similarities between embryonic stem and cancer cell transcription programs. Cell. 143:313–324 10.1016/j.cell.2010.09.010 [DOI] [PMC free article] [PubMed] [Google Scholar]
- Ko M., Huang Y., Jankowska A.M., Pape U.J., Tahiliani M., Bandukwala H.S., An J., Lamperti E.D., Koh K.P., Ganetzky R., et al. 2010. Impaired hydroxylation of 5-methylcytosine in myeloid cancers with mutant TET2. Nature. 468:839–843 10.1038/nature09586 [DOI] [PMC free article] [PubMed] [Google Scholar]
- Konuma T., Oguro H., Iwama A. 2010. Role of the polycomb group proteins in hematopoietic stem cells. Dev. Growth Differ. 52:505–516 10.1111/j.1440-169X.2010.01191.x [DOI] [PubMed] [Google Scholar]
- Ku M., Koche R.P., Rheinbay E., Mendenhall E.M., Endoh M., Mikkelsen T.S., Presser A., Nusbaum C., Xie X., Chi A.S., et al. 2008. Genomewide analysis of PRC1 and PRC2 occupancy identifies two classes of bivalent domains. PLoS Genet. 4:e1000242 10.1371/journal.pgen.1000242 [DOI] [PMC free article] [PubMed] [Google Scholar]
- Li Z., Zhang Z., Li Y., Arnovitz S., Chen P., Huang H., Jiang X., Hong G.M., Kunjamma R.B., Ren H., et al. 2013. PBX3 is an important cofactor of HOXA9 in leukemogenesis. Blood. 121:1422–1431 10.1182/blood-2012-07-442004 [DOI] [PMC free article] [PubMed] [Google Scholar]
- Mochizuki-Kashio M., Mishima Y., Miyagi S., Negishi M., Saraya A., Konuma T., Shinga J., Koseki H., Iwama A. 2011. Dependency on the polycomb gene Ezh2 distinguishes fetal from adult hematopoietic stem cells. Blood. 118:6553–6561 10.1182/blood-2011-03-340554 [DOI] [PubMed] [Google Scholar]
- Moran-Crusio K., Reavie L., Shih A., Abdel-Wahab O., Ndiaye-Lobry D., Lobry C., Figueroa M.E., Vasanthakumar A., Patel J., Zhao X., et al. 2011. Tet2 loss leads to increased hematopoietic stem cell self-renewal and myeloid transformation. Cancer Cell. 20:11–24 10.1016/j.ccr.2011.06.001 [DOI] [PMC free article] [PubMed] [Google Scholar]
- Morin R.D., Johnson N.A., Severson T.M., Mungall A.J., An J., Goya R., Paul J.E., Boyle M., Woolcock B.W., Kuchenbauer F., et al. 2010. Somatic mutations altering EZH2 (Tyr641) in follicular and diffuse large B-cell lymphomas of germinal-center origin. Nat. Genet. 42:181–185 10.1038/ng.518 [DOI] [PMC free article] [PubMed] [Google Scholar]
- Nannya Y., Sanada M., Nakazaki K., Hosoya N., Wang L., Hangaishi A., Kurokawa M., Chiba S., Bailey D.K., Kennedy G.C., Ogawa S. 2005. A robust algorithm for copy number detection using high-density oligonucleotide single nucleotide polymorphism genotyping arrays. Cancer Res. 65:6071–6079 10.1158/0008-5472.CAN-05-0465 [DOI] [PubMed] [Google Scholar]
- Neff T., Sinha A.U., Kluk M.J., Zhu N., Khattab M.H., Stein L., Xie H., Orkin S.H., Armstrong S.A. 2012. Polycomb repressive complex 2 is required for MLL-AF9 leukemia. Proc. Natl. Acad. Sci. USA. 109:5028–5033 10.1073/pnas.1202258109 [DOI] [PMC free article] [PubMed] [Google Scholar]
- Nikoloski G., Langemeijer S.M., Kuiper R.P., Knops R., Massop M., Tönnissen E.R., van der Heijden A., Scheele T.N., Vandenberghe P., de Witte T., et al. 2010. Somatic mutations of the histone methyltransferase gene EZH2 in myelodysplastic syndromes. Nat. Genet. 42:665–667 10.1038/ng.620 [DOI] [PubMed] [Google Scholar]
- Oguro H., Iwama A., Morita Y., Kamijo T., van Lohuizen M., Nakauchi H. 2006. Differential impact of Ink4a and Arf on hematopoietic stem cells and their bone marrow microenvironment in Bmi1-deficient mice. J. Exp. Med. 203:2247–2253 10.1084/jem.20052477 [DOI] [PMC free article] [PubMed] [Google Scholar]
- Oguro H., Yuan J., Ichikawa H., Ikawa T., Yamazaki S., Kawamoto H., Nakauchi H., Iwama A. 2010. Poised lineage specification in multipotential hematopoietic stem and progenitor cells by the polycomb protein Bmi1. Cell Stem Cell. 6:279–286 10.1016/j.stem.2010.01.005 [DOI] [PubMed] [Google Scholar]
- Oguro H., Yuan J., Tanaka S., Miyagi S., Mochizuki-Kashio M., Ichikawa H., Yamazaki S., Koseki H., Nakauchi H., Iwama A. 2012. Lethal myelofibrosis induced by Bmi1-deficient hematopoietic cells unveils a tumor suppressor function of the polycomb group genes. J. Exp. Med. 209:445–454 10.1084/jem.20111709 [DOI] [PMC free article] [PubMed] [Google Scholar]
- Pavlidis P., Noble W.S. 2003. Matrix2png: a utility for visualizing matrix data. Bioinformatics. 19:295–296 10.1093/bioinformatics/19.2.295 [DOI] [PubMed] [Google Scholar]
- Pruitt K.D., Tatusova T., Maglott D.R. 2007. NCBI reference sequences (RefSeq): a curated non-redundant sequence database of genomes, transcripts and proteins. Nucleic Acids Res. 35:D61–D65 10.1093/nar/gkl842 [DOI] [PMC free article] [PubMed] [Google Scholar]
- Raza A., Galili N. 2012. The genetic basis of phenotypic heterogeneity in myelodysplastic syndromes. Nat. Rev. Cancer. 12:849–859 10.1038/nrc3321 [DOI] [PubMed] [Google Scholar]
- Sasaki M., Knobbe C.B., Munger J.C., Lind E.F., Brenner D., Brüstle A., Harris I.S., Holmes R., Wakeham A., Haight J., et al. 2012. IDH1(R132H) mutation increases murine haematopoietic progenitors and alters epigenetics. Nature. 488:656–659 10.1038/nature11323 [DOI] [PMC free article] [PubMed] [Google Scholar]
- Sauvageau M., Sauvageau G. 2010. Polycomb group proteins: multi-faceted regulators of somatic stem cells and cancer. Cell Stem Cell. 7:299–313 10.1016/j.stem.2010.08.002 [DOI] [PMC free article] [PubMed] [Google Scholar]
- Shen X., Liu Y., Hsu Y.J., Fujiwara Y., Kim J., Mao X., Yuan G.C., Orkin S.H. 2008. EZH1 mediates methylation on histone H3 lysine 27 and complements EZH2 in maintaining stem cell identity and executing pluripotency. Mol. Cell. 32:491–502 10.1016/j.molcel.2008.10.016 [DOI] [PMC free article] [PubMed] [Google Scholar]
- Shide K., Kameda T., Shimoda H., Yamaji T., Abe H., Kamiunten A., Sekine M., Hidaka T., Katayose K., Kubuki Y., et al. 2012. TET2 is essential for survival and hematopoietic stem cell homeostasis. Leukemia. 26:2216–2223 10.1038/leu.2012.94 [DOI] [PubMed] [Google Scholar]
- Shih A.H., Abdel-Wahab O., Patel J.P., Levine R.L. 2012. The role of mutations in epigenetic regulators in myeloid malignancies. Nat. Rev. Cancer. 12:599–612 10.1038/nrc3343 [DOI] [PubMed] [Google Scholar]
- Subramanian A., Tamayo P., Mootha V.K., Mukherjee S., Ebert B.L., Gillette M.A., Paulovich A., Pomeroy S.L., Golub T.R., Lander E.S., Mesirov J.P. 2005. Gene set enrichment analysis: a knowledge-based approach for interpreting genome-wide expression profiles. Proc. Natl. Acad. Sci. USA. 102:15545–15550 10.1073/pnas.0506580102 [DOI] [PMC free article] [PubMed] [Google Scholar]
- Tanaka S., Miyagi S., Sashida G., Chiba T., Yuan J., Mochizuki-Kashio M., Suzuki Y., Sugano S., Nakaseko C., Yokote K., et al. 2012. Ezh2 augments leukemogenicity by reinforcing differentiation blockage in acute myeloid leukemia. Blood. 120:1107–1117 10.1182/blood-2011-11-394932 [DOI] [PubMed] [Google Scholar]
- Tremblay M., Tremblay C.S., Herblot S., Aplan P.D., Hébert J., Perreault C., Hoang T. 2010. Modeling T-cell acute lymphoblastic leukemia induced by the SCL and LMO1 oncogenes. Genes Dev. 24:1093–1105 10.1101/gad.1897910 [DOI] [PMC free article] [PubMed] [Google Scholar]
- Yamamoto G., Nannya Y., Kato M., Sanada M., Levine R.L., Kawamata N., Hangaishi A., Kurokawa M., Chiba S., Gilliland D.G., et al. 2007. Highly sensitive method for genomewide detection of allelic composition in nonpaired, primary tumor specimens by use of affymetrix single-nucleotide-polymorphism genotyping microarrays. Am. J. Hum. Genet. 81:114–126 10.1086/518809 [DOI] [PMC free article] [PubMed] [Google Scholar]
Associated Data
This section collects any data citations, data availability statements, or supplementary materials included in this article.


