Abstract
The gas-phase oxidation of n-butane has been studied in an atmospheric jet-stirred reactor (JSR) at temperatures up to 950 K. For the first time, continuous wave cavity ring-down spectroscopy (cw-CRDS) in the near-infrared has been used, together with gas chromatography (GC), to analyze the products formed during the oxidation. In addition to the quantification of formaldehyde and water, which is always difficult by GC, cw-CRDS allowed as well the quantification of hydrogen peroxide (H2O2). A comparison of the obtained mole fraction temperature profiles with simulations using a detailed gas-phase mechanism shows a good agreement at temperatures below 750 K, but an overestimation of the overall reactivity above this temperature. Also, a strong overestimation was found for the H2O2 mole fraction at the higher temperatures. In order to improve the agreement between model and experimental results, two modifications have been implemented to the model: (a) the rate constant for the decomposition of H2O2 (+M) ↔ 2 OH (+M) has been updated to the value recently proposed by Troe (Combust. Flame, 2011, 158, 594-601) and (b) a temperature dependant heterogeneous destruction of H2O2 on the hot reactor walls with assumed rate parameters has been added. The improvement (a) slows down the overall reactivity at higher temperatures, but has a negligible impact on the maximal H2O2 mole fraction. Improvement (b) has also a small impact on the overall reactivity at higher temperatures, but a large effect on maximal H2O2 mole fraction. Both modifications lead to an improved agreement between model and experiment for the oxidation of n-butane in a JSR at temperatures above 750 K.
Introduction
In a previous study of the n-butane oxidation1 in an atmospheric jet-stirred reactor (temperature from 550 to 800 K), the combined use of gas chromatography with different detection systems and of tuneable synchrotron vacuum ultraviolet (SVUV) photoionization mass spectrometry with molecular-beam sampling has shown to be a powerful tool to analyse a wide range of stable species from water and carbon oxides up to C4 ketohydroperoxides, olefins, aldehydes, ketones and cyclic ethers. However, species cannot be quantified with accuracy when their photoionization cross sections are not known with precision. This is the case for hydrogen peroxide, a key product of alkane oxidation2: its decomposition is a degenerate branched chain reaction and leads to the formation of the very reactive OH radicals, finally driving the system to ignition. Thus hydrogen peroxide mole fractions presented by Herbinet et al.1 were calculated using an estimated cross section and are then not accurate.
Despite its importance in the occurrence of autoignition, H2O2 has been rarely quantified under conditions close to those observed near this phenomenon. Only recently, two papers have shown some quantitative measurements of this species. Guo et al.3 have measured H2O2 during dimethyl ether oxidation in an atmospheric flow reactor from 490 K to 750 K, using molecular beam electron-ionization mass spectrometry. The H2O2 mole fraction was calibrated by vaporizing liquid H2O2 solution into a heated helium flow, the vapor was then used for calibration. The authors observed a fast surface decomposition of H2O2 into O2 and H2O, and the O2 signal measured during the calibration was used to correct and to calculate the actual H2O2 concentration. A temperature mole fraction profile in reasonable agreement with literature models for dimethyl ether oxidation4-6 was obtained.
Bahrini et al.7 have quantified H2O2 during n-butane oxidation in a jet-stirred reactor under conditions very close to those used by Herbinet et al.1 using continuous wave cavity ring-down spectroscopy (cw-CRDS) in the near-infrared. CRDS is an absolute absorption technique, and therefore no calibration is needed when the absorption cross section is known. However, absorption cross sections in the near infrared region are not known in the literature and have therefore been obtained in the present work from separate experiments using laser photolysis coupled to cw-CRDS. Using these absorption cross sections, the obtained temperature mole fraction profile was in good agreement with the prediction of a literature model for n-butane oxidation8 below 750 K, but important deviations appear at higher temperatures. Compared to the work of Guo et al.3, the more direct calibration method used by Bahrini et al.7 allows to be independent of the uncertainty in the H2O2 concentration when handling the unstable H2O2.
The purpose of the present paper is to present all stable species which have been measured using cw-CRDS during the oxidation of n-butane in a jet-stirred reactor. The profiles obtained by cw-CRDS are compared, when possible, with gas chromatography (GC) measurements. Simulations are presented using an improved kinetic model taking into account a temperature dependent wall loss reaction of H2O2 as well as a recently improved rate constant9 for the decomposition of H2O2. A sensitivity analysis on the kinetic model has been performed to evaluate the impact of uncertainties of some reaction rate constants as well as wall effects on the origin of the observed deviation between experimental profiles and simulations.
Experimental and modeling details
The study has been accomplished in a spherical fused silica jet-stirred reactor (JSR) with a volume of 90 cm3 coupled to a detection of stable species by cw-CRDS. For comparison purpose but also for obtaining profiles for a large number of species, analysis using GC with flame ionization detection (GC-FID) have also been performed, either in separate experiments or simultaneously.
The isothermal JSR is attached to a quartz annular preheating zone in which the temperature of the gas is increased up to the reactor temperature. The gas mixture residence time inside the annular preheater is very short compared to its residence time inside the reactor (a few percent). Both the spherical reactor and the annular preheating zone are heated by the means of Thermocoax resistances rolled up around the reactor. The reaction temperature was measured with a thermocouple located inside the intra-annular space of the preheating zone; its extremity being placed at the level of the injection jets.
All experiments have been performed using a stoichiometric mixture of 0.023 n-butane / 0.15 O2 / 0.827 He at a total pressure of 1 atm in the temperature range 550 – 950 K, total gas flows have been adapted in order to always obtain a residence time within the reactor of 6 s. The set-up has already been described in detail in earlier works10,11, so only a brief description will be given here.
Coupling JSR – cw-CRDS
The cw-CRDS measurements are carried out in a 80 cm long cell, well separated from the JSR: a strong pressure drop between JSR (atmospheric pressure) and cw-CRDS cell (below 10 Torr) is established, mainly for decreasing the pressure broadening of the absorption spectra and thus achieving a more selective detection of the different species. The cw-CRDS cell consists of two glass tubes (outer diameter 8 mm, length 40 cm each), hold together in the center by a stainless steel Swagelok T-fitting. The third outlet of the T takes a 6 mm diameter fused silica tube with its second extremity thinned out to a very small orifice. This second end of the tube is connected to the JSR such that the orifice is placed in the center of the JSR. Pumping on both ends of the cw-CRDS cell leads to the pressure drop between JSR reactor and cw-CRDS cell. The gas flow through the cw-CRDS cell is around 100 ccm STP min−1, leading to a residence time in the cw-CRDS cell of less than 1 second. Cw-CRDS measurements have been carried out using a DFB laser, tunable in the range 6620 – 6644 cm−1. From the ring-down time measured in the absence of the absorbing species A (τ0) and in the presence of the species A (τ), the absorption coefficient α can be determined:
| (1) |
RL is the ratio between the cavity length L, i.e. the distance between the two cavity mirrors to the length LA over which the absorber is present (this ratio has been determined as 0.92 in independent experiments, for details see Bahrini et al.10), c is the speed of light. If the absorption cross section σ is known for the species A, its concentration can be calculated using equation (1). More details on the cw-CRDS technique can be found in earlier works10,12.
Coupling JSR - GC/FID
Gas chromatographic analyses have already been used for the study of the oxidation of large alkanes and details can be found in recent papers1, 11, 13-15. Briefly, analyses were performed using two online gas chromatographs equipped with a six-gate sampling valve for the introduction of samples taken from the outlet of the jet-stirred reactor.
The first gas chromatograph (Shimadzu 14) is equipped with a Carbosphere packed column, a thermal conductivity detector (TCD), and a flame ionization detector (FID). It was used for the quantification of O2, CO, CO2, methane, ethylene, acetylene and ethane. Amongst the products which are known to be important for hydrocarbon oxidation, only water and hydrogen were not quantified.
The second gas chromatograph (Agilent 7890) was fitted with a PlotQ capillary column and a FID preceeded by a methanizer, which increases the sensitivity of the detection of carbon oxides compared to thermal conductivity detectors, as well as improving the quantification of formaldehyde, and was used for the quantification of C1-C5 hydrocarbons and small oxygenated compounds.
The calibration of the gas chromatographs was performed using gaseous standard cylinders of well defined and calibrated composition provided by Air Liquide. The maximum relative uncertainty in the mole fractions was estimated to ± 5 % with a detection limit of around 5 ppm for hydrocarbons and C2+ oxygenated compounds. The maximum relative uncertainty in the mole fraction was estimated to ± 20 % for formaldehyde (due to the tail of the peak and the co-elution with other species) with a detection limit around 10 ppm.
Coupling of laser photolysis – cw-CRDS / LIF
Absorption cross sections for H2O2 in the near-infrared region have already been measured in an earlier work16, however all experiments had been performed at a total pressure of 50 Torr while cw-CRDS measurements in this work have been carried out at around 10 Torr. The main advantage of carrying out the cw-CRDS measurements at low pressure is to limit the pressure broadening of the absorption spectra of all species, leading to a less digested spectrum and thus a better selectivity. Absorption lines in the wavelength range covered in this work suffer from pressure broadening, therefore it is indispensable to know the broadening coefficient of the selected line in order to calculate the absorption cross section at different pressures in a given bath gas. Unfortunately, broadening coefficients for H2O2 in the near-infrared region are not known in the literature and thus we have preferred to directly measure absorption cross sections of a few selected lines at the working pressure of 10 Torr.
Modeling details
The purpose of the present study is mainly an experimental one, but a detailed kinetic model has been used in order to test its performance in reproducing these new results, and to possibly point out important deviations. The model used in this work, which is available on request, is based on the mechanism recently proposed by Battin-Leclerc et al.8. It is based on a mechanism automatically generated by software EXGAS, such as described by Buda et al.17 and by Biet et al.13. The updated rate constant for the reaction H2O2 (+M) ⇆ 2 •OH (+M), recently proposed by Troe9, has been implemented to this model. Also, a temperature dependent wall loss of H2O2 has been introduced to the model in order to reproduce the experimentally observed H2O2 profiles.
Experimental results
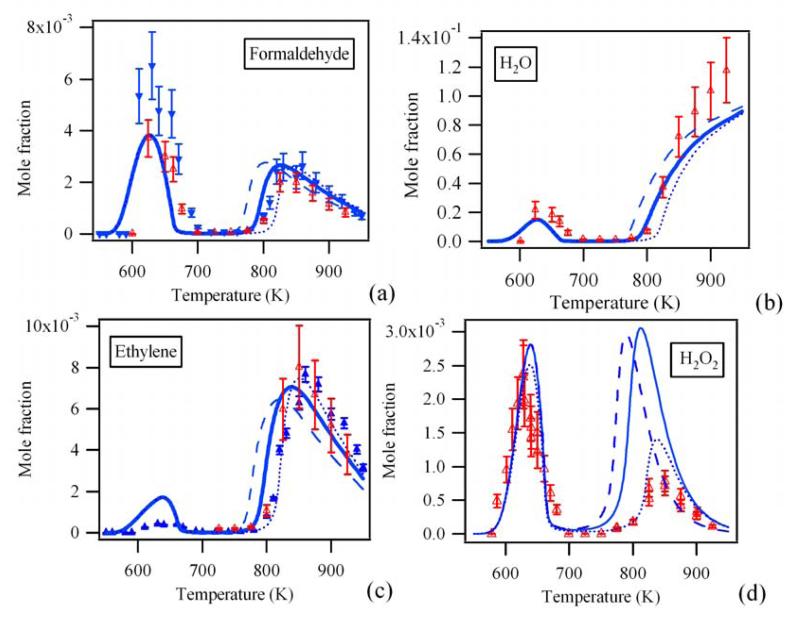
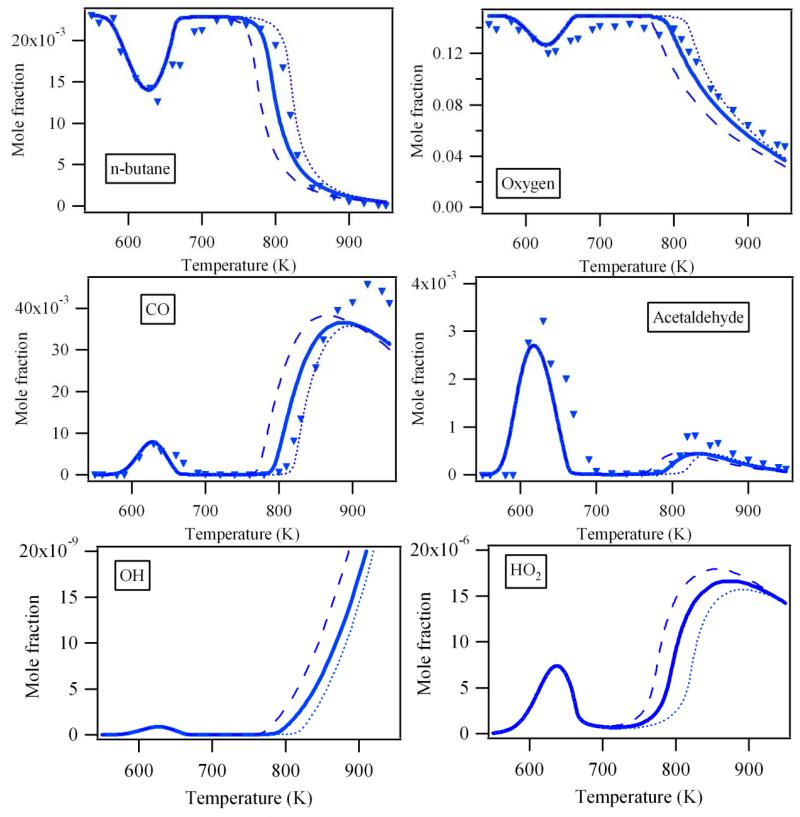
The mole fraction profiles such as obtained in this work from experiment and model calculations are presented in Figures 1, 2 and S1-S4: Figure 1 shows the products quantified by cw-CRDS (CH2O, H2O, C2H4 and H2O2, whereby CH2O and C2H4 where also quantified by GC), Figure 2 shows other major products linked to the reactivity (n-butane, O2, CO, CH3CHO, OH and HO2 radicals, whereby the last two species have not been quantified experimentally), Figures S1-S4 finally show the profiles of 20 other products quantified by GC only. In all figures, the results of three different models are shown: the dashed lines show the results from the original model such as proposed by Battin-Leclerc et al.8, full lines show the results from the model improved with the new rate constant for the decomposition of H2O29, while the dotted lines show the model including additionally the heterogeneous decomposition of H2O2. Compared to the previous study of Herbinet et al.1 in the same type of JSR, the temperatures range has been extended in this study up to 950 K allowing the investigation of the reactivity of this alkane above 800 K. The only studies in the literature dealing with the oxidation of n-butane in this intermediates range of temperature are from Chakir et al.18 and Minetti et al.19, both having observed significantly less products. Figures 1, 2 and S1-S4 show for all analyzed species the characteristic behavior with two distinct reactivity zones, an increase in reactivity at low temperature (T ≈ 600K), followed by a decrease in reactivity in the so-called negative temperature zone (T > 650 K) and another increase in reactivity at higher temperatures (T > 800 K)20.
Figure 1.
Profile of CH2O (a), H2O (b), C2H4 (c) and H2O2 (d). Full blue symbols: GC measurements. Open red symbols: experimentally obtained concentration by averaging the mole fractions obtained from different CRDS absorption lines. Dashed lines: gas phase model such from Battin-Leclerc et al.8. Full lines: gas phase model with the revised rate constant for H2O2 decomposition. Dotted lines: gas phase model as full line, but with additional H2O2 wall destruction.
Figure 2.
Profile of reactants, main products and some important radicals which cannot be observed by CRDS. Symbols: GC measurements. Full lines: profiles obtained from only gas phase model. Dotted lines: profiles obtained from gas phase model with temperature dependent H2O2 wall destruction.
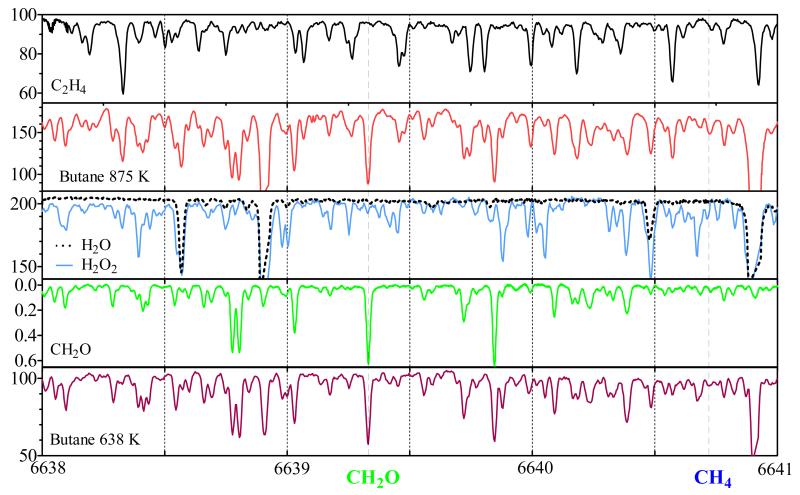
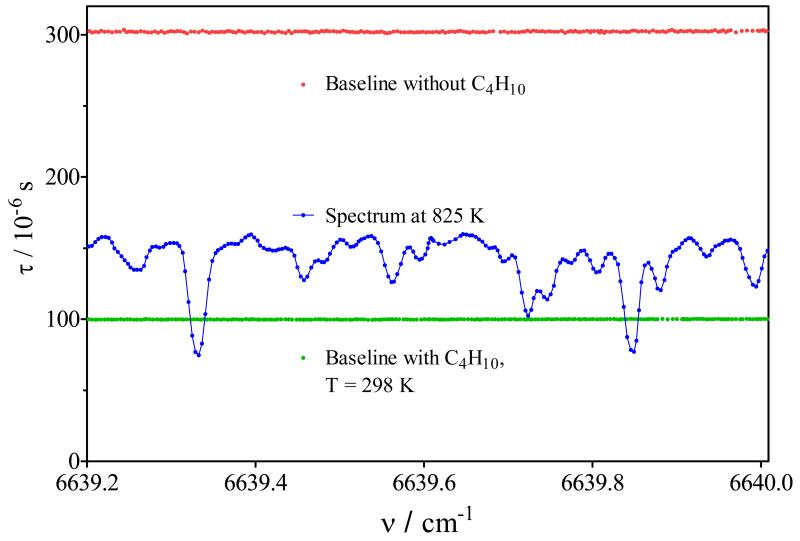
The absorption spectrum of the gas mixture exiting the JSR reactor has been analyzed by cw-CRDS between 6620 to 6644 cm−1, i.e. the range accessible by the DFB laser. In Figure 3 is shown the portion of the spectrum in the wavelength range between 6638 and 6641 cm−1, the full spectrum can be found as supplementary data (Figure S5). In these figures, the spectrum is shown such as obtained at the exit of the JSR at 2 different temperatures, 875 K (second from top) and 638 K (bottom), the spectra are represented as ring-down time τ as a function of wavenumber. These temperatures have been chosen because they represent the maxima of product formation in the two temperature domains (see Figure 1 and 2). Butane itself does absorb in this wavelength range, but it does not exhibit any structured absorption feature, i.e. it only leads to an overall decrease in ring-down time. This is illustrated in Figure 4, showing the baseline recorded before admitting n-butane to the reactor (upper red line, τ ≈ 300 μs), the baseline with n-butane, but the reactor still at ambient temperature (lower green line, τ ≈ 100 μs), as well as a typical spectrum obtained with the reactor at 825 K and a residence time of 6 s (blue dots), where around 60% of the n-butane has been consumed. From the decrease in ring-down time after admission of n-butane at ambient temperature (red and green line), an absorption cross section of n-butane of σ = (2.5±0.3) × 10−23 cm2 over the entire wavelength range can be calculated. Therefore, the structured spectrum obtained from the gas mixture at the exit of the JSR such as shown in Figure 3 is solely due to absorption by reaction intermediates.
Figure 3.
Absorption spectrum in the range 6638 – 6641 cm−1 for the major absorbing reaction products (ring down time as a function of wavenumber for H2O2, H2O and C2H4, absorption cross sections in 20−21 cm2 taken from Staak et al for CH2O) as well as the spectrum such as observed from the oxidation of n-butane at 638 K and 875 K. CH4 line at 6640.72 cm−1 al blue dotted line, CH2O line at 6639.33 cm−1 as green dotted line.
Figure 4.
Absorption of n-butane: base line with helium only (red), with presence of 9.7×1015 cm−3 n-butane (green), oxidation products at 825 K (blue)
Four species have been identified being mostly responsible for the structured absorption observed in this wavelength range: C2H4, H2O, H2O2 and CH2O. The individual spectra of these four species have therefore been added for comparison in Figure 3 and S5: C2H4 as the top panel, H2O (as dashed line) and a mixture of H2O and H2O2 in the center and CH2O as second from bottom. The spectra of C2H4, H2O and H2O2 have been obtained during this work by flowing a diluted mixture of the species via the JSR at room temperature into the cw-CRDS cell: C2H4 has been taken as a pure gas from a cylinder (99.95% purity, Air Liquide) and has been diluted with a known flow of Helium prior to entering the JSR, H2O has been obtained by bubbling a fraction of the He-flow through liquid water, H2O2 has been obtained by bubbling through a solution of 50% H2O2 / H2O and hence consists of the sum of both spectra, H2O and H2O2. The spectrum of CH2O has been taken from Staak et al21, however absolute absorption cross sections used in this work have been taken from Morajkar et al22. The absorption spectra for the individual species are relatively dense (except for H2O, which has well-defined and separated lines), and hence the spectrum of the gas mixture at the exit of the JSR, a convolution of the individual spectra weighted by the concentration of each species, is also very dense. In order to extract reliably the concentration of each species, isolated absorption features need to be identified, i.e. lines that are as little as possible perturbed by absorption lines from other species. The procedure for extracting absolute concentrations for each individual species from the convoluted product spectrum is detailed in the following sections.
Quantification of CH2O
CH2O has already been quantified by the same technique in an earlier study by Bahrini et al.10 on the oxidation of CH4. Four different lines (6638.77, 6638.804, 6641.674 and 6642.355cm−1) were chosen for the quantification of CH2O due to their relatively good isolation from CH4- and H2O absorption lines, the only other species exhibiting a structured absorption spectrum in that previous study. In the current work the fuel, n-butane, has, in contrast to CH4, only a broadband absorption feature in this wavelength range and thus does not perturb the measurement, but leads only to a shift of the baseline. Therefore, lines that have not been considered in the CH4-study due to strong overlap with a CH4 absorption line, might be very well appropriate for a quantification of CH2O in this study, while lines that have been chosen in the CH4 study can be perturbed by either H2O2 or by C2H4, two species that were not present in significant amounts in the CH4 oxidation study. The absorption of CH4 itself as a reaction product in the oxidation of n-butane is very small due to its low absorption cross sections and its low concentrations (see Figure S1). The position of the strongest CH4 absorption line in our wavelength range (σ = 2.05×10⁻²³ cm2 at 6640.72 cm−1, obtained from Campargue et al.23 by considering a Voigt profile) is indicated by a blue, dashed line in Figure 3. The absorption due to CH4 explains well the small absorption feature observed at this wavelength in the 875K spectrum (maximal CH4 concentration) of Figure 3, but underlying small absorption features of C2H4 and CH2O make it impossible to determine a reliable CH4-concentration. Besides, the determination of CH4 concentration by GC is very reliable. A small contribution of CH4 absorption has also been identified in the vicinity of the strongest HO2 absorption line (see Figure 5 and discussion on absence of HO2 below).
Figure 5.
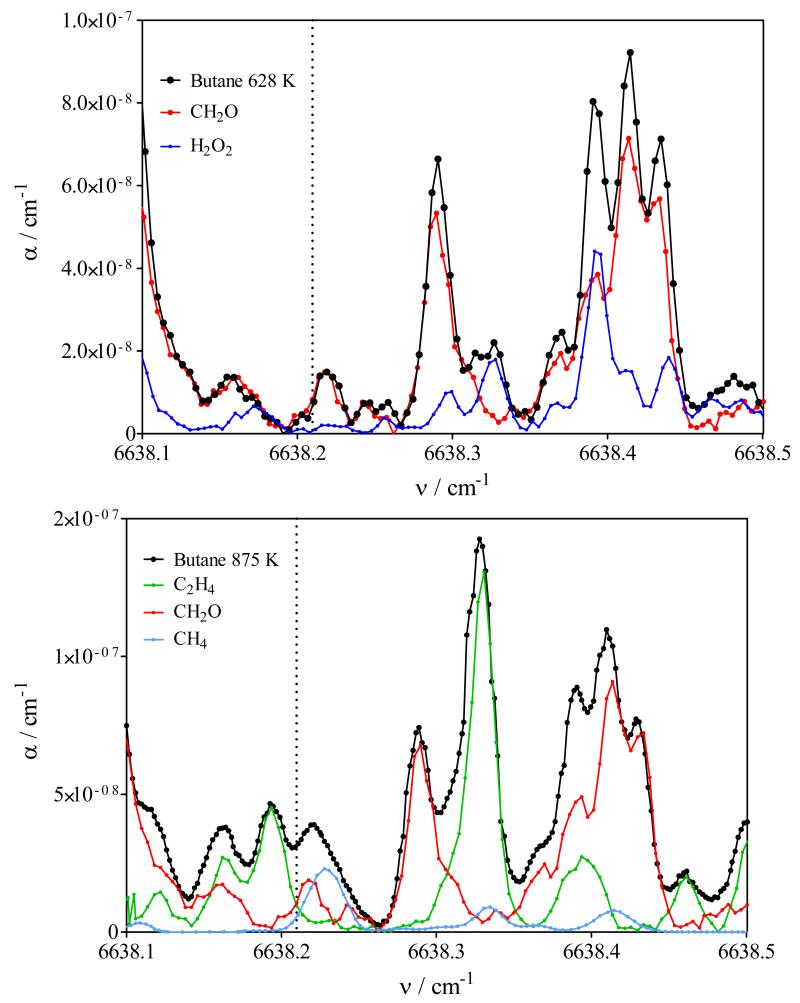
Graph demonstrating the absence of HO2 within the cw-CRDS cell. Black line is spectrum obtained from n-butane oxidation: upper panel at 628 K, lower panel 875 K. Red line is CH2O spectrum, blue line in upper panel is H2O2, green line in lower panel is C2H4, blue line in lower panel is CH4 spectrum. The doted line indicates the position of the strongest absorption line of HO2 at 6638.21 cm−1 from Thiebaud et.al.37. Spectra of individual species have been scaled to match the spectrum from n-butane oxidation products.
A major source of uncertainty for the reliable quantification of species during this study is the determination of the baseline τ0, i.e. the ring-down time in the absence of the absorbing species. Due to the broad absorption of n-butane itself, the baseline varies with temperature with the change in n-butane concentration (see Figure 4). Besides this problem, it can be seen from Figures 3 and S5 that the spectra of the reaction mixtures are very dense and it is generally not possible to identify isolated strong absorption lines with the baseline next to the absorption line free of any perturbation by other absorbing species. A rigorous way out of this problem could be the fitting of the product spectra through convolution of the individual spectra using an appropriate program such as Fityk24. This option however is not straightforward neither, because the measured raw data (ring-down time as a function of wavenumber) need to be converted into absorption spectra (absorption coefficient α as a function of wavenumber) using equation (1): it can be seen that again the baseline τ0 is needed. From these considerations, we have adopted a pragmatic approach: the average of the highest ring-down time in the right and left vicinity of the absorption line has been used as τ0. In order to check for systematic errors, different absorption lines have been analyzed for each species and the obtained concentrations have been compared for consistency. For CH2O, the following 6 lines have been analyzed (see Table 1): 6624.78, 6625.25, 6639.33 (indicated by a green dashed line in Figure 3), 6641.67, 6642.35 and 6642.49 cm−1.
Table 1.
CH2O concentrations extracted from the full spectrum such as shown in Figure S5 using 6 different lines with either absorption cross sections such as obtained directly by Morajkar et al.22 at 10 Torr or divided by 1.7 from Staak et al.21 (see text)
| 628 K | 875 K | |||||||
|---|---|---|---|---|---|---|---|---|
| Line No |
Wave- number / cm−1 |
σ / 10−22 cm2 |
τ / μs | τ0 / μs | [CH2O] / 1014cm−3 |
τ / μs | τ0 / μs | [CH2O] / 1014cm−3 |
| 1 | 6624.78 | 5.34 | 45.61 | 102.14 | 8.23 | 70.70 | 177.80 | 5.78 |
| 2 | 6625.25 | 3.20 | 60.02 | 103.74 | 7.95 | 96.00 | 177.60 | 5.42 |
| 3 | 6639.33 | 3.60 | 58.28 | 103.50 | 7.54 | 90.10 | 175.60 | 5.44 |
| 4 | 6641.67 | 4.59 | 52.05 | 100.05 | 7.28 | 81.42 | 166.40 | 4.95 |
| 5 | 6642.35 | 4.24 | 53.80 | 99.50 | 7.30 | 81.96 | 171.62 | 5.45 |
| 6 | 6642.49 | 1.52 | 74.20 | 99.95 | 8.28 | 118.7 | 171.33 | 6.17 |
| Average | 7.8±0.3 | 5.5±0.2 | ||||||
The absorption cross sections for CH2O at around 6640 cm−1 used in the former study on the oxidation of CH4 were taken from Staak et al.21, the only data available in the literature at that time. Using these values, the experimentally obtained CH2O profile did not agree well with model calculations: the CH2O concentrations obtained from the experiment were roughly two times lower than predicted by the model. Following that study, we have measured CH2O absorption cross sections of two selected lines in the near infrared (6624.78 and 6625.25 cm−1, indicated by dashed green lines in Figure S5)22: we have used, similar to the measurement of the H2O2 absorption cross sections presented further down in this work, the well-known rate constant25 for the reaction of OH-radicals with CH2O for quantifying the CH2O concentration in-situ. Line strengths were found two times smaller compared to Staak et al. for both lines. From this result and taking into account the corresponding broadening factors for CH2O (0.918 cm−1 atm−1)21 and helium (0.04 cm−1 atm−1)22 we have adopted for this study (8 ±2 Torr helium) peak absorption cross sections for all lines 1.7 times smaller than published by Staak et al.
Table 1 summarizes the CH2O concentrations extracted from the spectra shown in Figure S5 for both temperatures, using all six lines. The absorption cross sections for the first two lines are thus directly determined by Morajkar et al.22, while the absorption cross sections for the last four lines are thus obtained by dividing the peak absorption cross sections of Staak et al.21 by 1.7. It can be seen that there is overall consistency between the concentrations from all six lines for both temperatures, giving confidence that the analysis procedure can be considered free from systematic errors.
It was also possible to quantify formaldehyde by gas chromatographic analyses using the flame ionization detector thanks to the use of a methanizer located before the detector. The methanizer causes the catalytic hydrogenation of carbonyl functions transforming formaldehyde into methane and making the detection of this species much more sensitive. However the formaldehyde peak using the Plot Q capillary column has a very long tail which results in a co-elution with the peaks of methanol, acetaldehyde and ethylene oxide. Thus the relative uncertainty in the mole fractions obtained using this method is larger than that of other species and is estimated to ±20%.
The mole fraction profiles for CH2O are shown in Figure 1a: the open red symbols represent the average such as obtained by cw-CRDS from the different absorption lines, the blue symbols represent the results obtained by GC. The experimental mole fractions obtained by cw-CRDS are in good agreement with the predicted ones. The mole fractions derived from GC measurement are somewhat higher than the values obtained by cw-CRDS, especially in the low temperature range, supporting the lack of accuracy in the values obtained by gas chromatography for this oxygenated species.
Quantification of H2O
H2O is obviously a major reaction product in the oxidation of hydrocarbons and has already been detected by cw-CRDS in the earlier study on the oxidation of CH4. H2O has a well-structured and well-known absorption spectrum in the near infrared region and an extended list of line strengths has been published. Line strengths26 in the wavelength range covered in this work span over several orders of magnitude and peak absorption cross sections under our conditions vary from around 10−23 to 10−29 cm2. Thus it is possible to choose lines having a suitable absorption cross section depending on the H2O concentration to be measured: lines with a large absorption cross section can be appropriate for a reliable quantification of H2O in the low temperature range while the same transition might be saturated at higher temperatures, where the n-butane oxidation is more advanced and thus the H2O concentration is higher. Another criterion for choosing a suitable absorption line, besides the line strength, is again the absence of interfering lines from other reaction products. Taking into account these requirements, 12 absorption lines have been selected and are listed in Table 2, 9 lines have been used for quantification in the low and high temperature range. Peak absorption cross sections under our conditions (8 ± 2 Torr helium) have been calculated from line strengths such as published by Macko et al.26 supposing a Voigt profile with a unique broadening coefficient of 0.1 cm−1atm−1 for all lines27. As explained above, not all absorption lines can be used at all temperatures. From Table 2 it can be seen that, even though the scatter of the concentrations obtained from individual lines is larger than for CH2O, the statistical error from the obtained average concentration (95% confidence interval) is satisfactory. In Figure 1b is presented the H2O mole fractions as a function of temperature, the data point at each temperature being obtained from the average of several individual absorption lines. The computed profiles are in good agreement with the experimental data.
Table 2.
H2O concentrations extracted from the full spectrum such as shown in Figure S5 using 12 different lines with the absorption cross sections obtained from the line strength such as published by Macko et al.26, a unique broadening factor of 0.1 cm−1 atm−1 has been used for all lines for calculating the peak absorption cross section
| 628 K | 875 K | |||||||
|---|---|---|---|---|---|---|---|---|
| Line No |
Wave- number / cm−1 |
σ / 10−23 cm2 |
τ / μs | τ0 / μs | [H2O] / 1015cm−3 |
τ / μs | τ0 / μs | [H2O] / 1016cm−3 |
| 1 | 6628.24 | 20.5 | 32.9 | 101.6 | 3.63 | |||
| 2 | 6628.42 | 0.35 | 120.4 | 183.9 | 2.97 | |||
| 3 | 6631.88 | 2.10 | 14.5 | 101.7 | 2.12 | 53.5 | 168 | 2.20 |
| 4 | 6625.87 | 1.27 | 91.5 | 103.1 | 3.51 | 73.5 | 177.9 | 2.28 |
| 5 | 6626.47 | 18.6 | 42.8 | 100.3 | 2.61 | |||
| 6 | 6636.84 | 0.918 | 83.1 | 171.9 | 2.45 | |||
| 7 | 6638.90 | 4.46 | 63.7 | 102.2 | 4.80 | 28.6 | 168.6 | 2.36 |
| 8 | 6640.48 | 0.254 | 128.7 | 171.2 | 2.75 | |||
| 9 | 6640.90 | 16.0 | 33.9 | 90.95 | 4.19 | |||
| 10 | 6641.26 | 1.82 | 84.8 | 100.2 | 3.61 | 60.3 | 173.0 | 2.15 |
| 11 | 6642.84 | 1.62 | 87.4 | 99.8 | 3.18 | 59.6 | 171.8 | 2.45 |
| 12 | 6643.06 | 1.13 | 91.6 | 98.2 | 2.37 | 78.8 | 168.2 | 2.17 |
| Average | 3.3 ± 0.4 | 2.4 ± 0.1 | ||||||
Quantification of C2H4
C2H4 has been identified as one of the major absorbing species in the higher temperature range, while its concentration is below the CRDS-detection limit in the lower temperature range. To our knowledge, the absorption spectrum of C2H4 in the wavelength range used in this work has not been published and therefore its spectrum has been measured in the wavelength range 6620 – 6644 cm−1. For the spectrum shown in Figure 3 and S5, a concentration of 5.92×1015 cm−3, calculated from flow meter measurements, has been used at a total pressure of 6.1 Torr, and the obtained peak absorption cross sections of the eleven most intense absorption lines in this wavelength range are tabulated in Table 3. Only six of these lines have been used to quantify the C2H4 concentration, because the other lines do overlap with absorption lines from CH2O. As can be seen in Table 3, the concentrations extracted from the 875K - spectrum in Figure S5 using the six lines are in good agreement and the C2H4 concentrations at higher temperature, shown in Figure 1c, are also in good agreement with the concentrations such as obtained by GC/FID. However, absorption spectroscopy in this wavelength range is certainly not the most appropriate method for a sensitive detection of C2H4.
Table 3.
11 most intense absorption lines of C2H4 obtained from the spectrum shown in Figure S5
| [C2H4] = 5.75×1015 cm−3 | 875 K | ||||||
|---|---|---|---|---|---|---|---|
| Line No |
ν / cm−1 | τ / μs | τ0 / μs | σ / 10−23 cm2 at 10 torr He |
τ / μs | τ0 / μs | [C2H4] / 1015 cm−3 |
| 1 | 6623.37 | 59.70 | 90.75 | 3.61 | 125.9 | 170.20 | 2.07 |
| 2 | 6623.48 | 60.83 | 91.05 | 3.44 | 116.2 | 169.30 | 2.84 |
| 3 | 6627.90 | 70.06 | 91.74 | 2.13 | 139.4 | 183.2 | 2.92 |
| 4 | 6633.22 | 70.00 | 93.50 | 2.26 | 137.7 | 171.3 | 2.28 |
| 5 | 6635.01 | 76.60 | 96.05 | 1.67 | 146.6 | 171.1 | 2.13 |
| 6 | 6637.09 | 70.60 | 97.30 | 2.49 | 134.2 | 174.0 | 2.49 |
| 7 | 6622.38 | 61.78 | 89.72 | 3.18 | |||
| 8 | 6637.96 | 70.15 | 97.25 | 2.50 | |||
| 9 | 6638.33 | 59.50 | 96.30 | 4.05 | |||
| 10 | 6640.57 | 65.68 | 94.90 | 4.66 | |||
| 11 | 6641.23 | 56.15 | 96.07 | 2.95 | |||
| Average | 2.46 ± 0.24 | ||||||
Quantification of H2O2
The quantification of H2O2 has already been described in a separate paper7, for completeness the concentration profile such as presented in the earlier work is shown as Figure 1d. In this work we briefly describe the measurement of the absorption cross sections used for the analysis of the spectra and discuss possible reasons for the disagreement between measurement and model in the high temperature range.
Preparing a mixture containing a known concentration of H2O2 is rather difficult, because H2O2 is unstable and tends to decompose heterogeneously3. Therefore, the absorption cross sections at 10 Torr total pressure have been determined using laser photolysis coupled to a simultaneous detection of OH and HO2 radicals. Advantage can be taken of the well-known rate constant28 for the reaction of OH-radicals with H2O2 to deduce the H2O2 concentration from experimental OH decays, measured by LIF under pseudo-first order conditions. Simultaneous measurement of absolute HO2 profiles, measured by cw-CRDS, allows taking into account secondary chemistry. More details of this method can be found in Parker et al16, where the measurement of absorption cross sections of H2O2 at 50 Torr total pressure has been described. The absorption cross sections obtained in such a way for 5 different lines at 10 Torr helium are summarized in Table 4. In Table 5 are listed the ring-down times and the corresponding absorption coefficients α for the 18 most intense lines of H2O2 in the current wavelength range, obtained from the spectrum shown in Figure S5. The absolute absorption cross sections from Table 4 can then be used to convert the absorption coefficients into absorption cross sections: plotting σ from Table 4 against α from Table 5 for the 5 lines calibrated by laser photolysis leads to the H2O2 concentration used in Figure 3 / S5 and can then be used as calibration factor of σ = α / [H2O2] = α / (3.41±0.2) × 1014 cm3.
Table 4.
Absorption cross sections of H2O2 lines at 10 Torr helium in the near infrared region from LP / LIF / cw-CRDS measurements
| ν / cm−1 | σ / 10−23 cm2 at 10 Torr He |
|---|---|
| 6639.25 | 7.49± 0.44 |
| 6639.45 | 7.79 ± 0.47 |
| 6640.02 | 7.89 ± 0.13 |
| 6640.06 | 13.8 ± 0.48 |
| 6642.14 | 8.55 ± 0.23 |
Table 5.
Absorption cross sections of H2O2 lines in the near infrared region obtained from Figure S5 and calibrated by absorption cross sections from Table 4 (σ = α × (2.93±0.2) × 10−15 cm3). Bold lines are the same than in Table 4. Error is estimated to ±20% and includes uncertainties in σ (from Table 4) as well as in τ and τ0 from Figure S5.
| ν / cm−1 | τ / μs | τ0 / μs | α / 10−8 cm−1 | σ / 10−23 cm2 at 10 torr He |
|---|---|---|---|---|
| 6621.99 | 161.19 | 187.25 | 3.15 | 9.22 ± 1.8 |
| 6624.10 | 165.96 | 185.21 | 2.28 | 6.68 ± 1.3 |
| 6631.81 | 153.31 | 189.79 | 4.57 | 13.4 ± 2.7 |
| 6633.57 | 167.70 | 192.30 | 2.78 | 8.15 ± 1.6 |
| 6635.11 | 157.95 | 191.59 | 4.05 | 11.9 ± 2.4 |
| 6635.84 | 149.56 | 192.21 | 5.41 | 15.8 ± 3.1 |
| 6635.95 | 149.25 | 192.75 | 5.51 | 16.1 ± 3.2 |
| 6639.25 | 175.13 | 200.16 | 2.60 | 7.62 ± 1.5 |
| 6639.45 | 179.20 | 203.31 | 2.41 | 7.06 ± 1.4 |
| 6639.88 | 154.32 | 202.29 | 5.60 | 16.4 ± 3.3 |
| 6640.02 | 176.91 | 201.30 | 2.50 | 7.32 ± 1.5 |
| 6640.06 | 158.50 | 200.60 | 4.83 | 14.1 ± 2.8 |
| 6640.38 | 159.00 | 201.19 | 4.81 | 14.1 ± 2.8 |
| 6640.67 | 158.84 | 201.29 | 4.84 | 14.2 ± 2.8 |
| 6641.71 | 159.17 | 205.41 | 5.15 | 15.1 ± 3.0 |
| 6641.80 | 176.41 | 205.78 | 2.95 | 8.65 ± 1.7 |
| 6642.14 | 175.24 | 205.52 | 3.06 | 8.97 ± 1.8 |
| 6643.43 | 160.42 | 210.99 | 5.45 | 16.0 ± 3.2 |
Absence of HO2
HO2 is an important intermediate in the oxidation of hydrocarbons and models predict concentrations of up to around 20 ppm under the conditions of this work. HO2 has a well structured absorption spectrum in the wavelength range investigated in this work29, with the strongest line at around 6638.21 cm−1. The portion of the absorption spectrum around this wavelength range, such as obtained from the oxidation of n-butane at 628K (upper panel) and 875 K (lower panel) is shown in Figure 5 as black symbols and line. For the lower temperature, CH2O and H2O2 are the major absorbers in this wavelength range, while it is CH2O and C2H4 at the higher temperature, with small contributions of CH4. Therefore, the spectra obtained from the two (three) corresponding species are plotted in the same figures with their intensities being scaled such that the sum of the individual spectra roughly matches the absorbance obtained from n-butane oxidation. It can be seen that the n-butane oxidation spectrum at the lower temperature shows only very weak absorption (α < 1×10⁻⁸ cm−1) around the strongest HO2 line (indicated by a dotted, vertical line) and can be very well reproduced by the sum of the corresponding stable species alone. The absorption is slightly higher at the higher temperature (α = 3×10⁻⁸ cm−1), where C2H4, CH2O and CH4 have weak absorption lines near the HO2 absorption line. When matching characteristic absorption features for both stable product (C2H4 and CH2O), the missing absorption around the HO2 line matches very well with an absorption coefficient corresponding to a CH4 mole fraction of around 4×10⁻³.
The maximal HO2 concentration such as predicted by the models (mole fractions up to 5 and 15 × 10−6 in the low and high temperature range, respectively) would lead to an absolute concentration in the cw-CRDS cell (around 10 Torr) of around 2 / 6 × 1012 cm−3. Estimating an absorption cross section for HO2 at 10 Torr of σ = 3×10⁻¹⁹ cm2, such concentrations would result in absorption coefficients of α = 0.6 / 1.8 × 10⁻⁶ cm−1, to be compared with the overall observed absorbance of 0.007 / 0.03 × 10⁻⁶ cm−1. From these observations it can be concluded, that over the entire temperature range the HO2 concentration in the cw-CRDS cell is less than 1% of what is predicted by models. The same total absence of HO2 has already been observed in an earlier work10 on the oxidation of CH4 and no obvious explanation could be given. We have very recently coupled a JSR to a detection of HOx radicals by FAGE (Fluorescence Assay by Gas Expansion: details of the instruments are described elsewhere30-32 and will not be repeated here): preliminary results show that the HO2 concentration measured by this technique is in good agreement with model calculations. Because the self-reaction of HO2 radicals in the gas phase is too slow to explain the decrease of at least 99%, we suspect a heterogeneous loss of HO2 radicals during sampling into the cw-CRDS cell. It is known that HO2 radicals recombine easily by heterogeneous reaction on glass surfaces33, so we are left with the suspicion that this process is efficient enough to decrease the HO2 concentration below our detection limit.
Discussion
It has already been shown in an earlier work7 and it can be seen from Figure 1d, that the H2O2 mole fraction profile is in excellent agreement with the one predicted by the current model8 in the low temperature range (T<750K), at higher temperatures however the model overestimates the H2O2 mole fraction by up to a factor of 4. This is especially surprising since the agreement for the maximum mole fractions is generally very good for other species in this range of temperature. The following discussion aims therefore at trying to understand the deviation between experiments and predictions which is observed for the H2O2 mole fraction profile above 750 K. Two modifications to the current model will be discussed: (a) implementation of the recently reviewed rate constant for the unimolecular decomposition of H2O2 and (b) considering the possibility of heterogeneous destruction of H2O2 on hot reactor walls.
(a) Improvement of gas phase chemistry
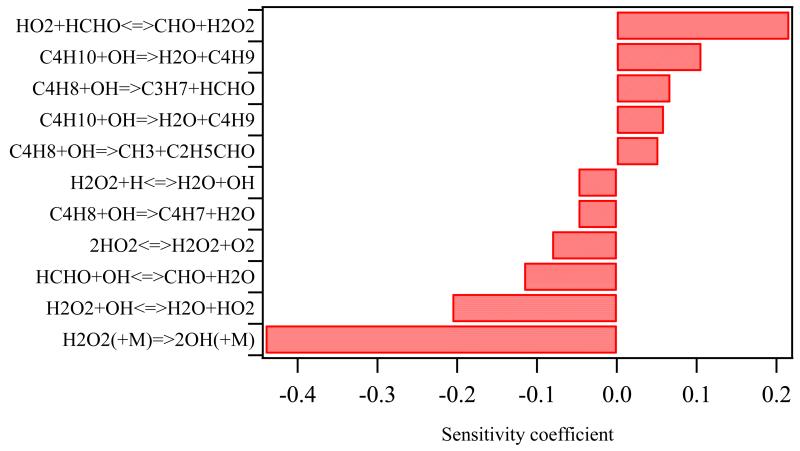
Figure 6 shows a sensitivity analysis on the influence of the rate parameters of gas phase reactions on the H2O2 mole fraction at 800 K. The most sensitive reaction on the consumption of H2O2 is the reaction: H2O2 (+M) ⇆ 2•OH (+M). Fortuitous, Troe9 has recently proposed a new value for this rate constant, decreasing it by a factor 2.7 at 800K at 1 atm compared to the value from Baulch et al.34, which was used in the initial model. The influence of this latter rate constant on the profiles of all species can be seen by comparing simulations obtained with the initial mechanism using the Baulch et al.34 value (dashed line in Figures 1, 2 and S1-S4) with profiles from the improved model incorporating the value by Troe9 (full line in Figures 1, 2 and S1-S4). The lower value from Troe induces a shift of around 20 K toward the higher temperatures for the consumption of n-butane and the formation of H2O2 as well as for the formation of all other products. This is in good agreement with experiments: the initial model tends to overestimate the reactivity in the high temperature range. However, the maximum value of the H2O2 mole fraction is barely influenced by this new rate constant and remains much too high compared to experiments. The influence of the kinetic parameters of the other reactions on both the consumption of n-butane and the H2O2 formation are all almost negligible and therefore it is concluded, that gas phase chemistry alone can not explain the strong overestimation of H2O2.
Figure 6.
Sensitivity analysis on the H2O2 mole fraction at 800 K.
(b) Heterogeneous loss of H2O2
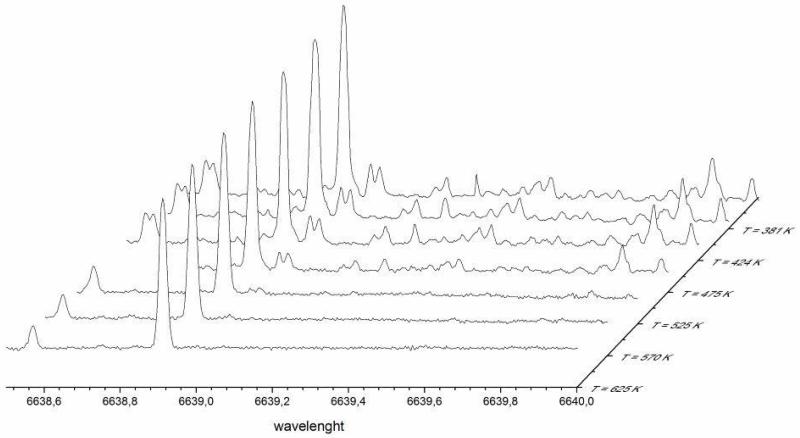
H2O2 is a thermally rather stable molecule: for example its decomposition rate at 800 K and 1 bar N2 is only around 0.7 s−1, thus H2O2 concentrations predicted by models stem mostly from the continuous formation of this species as a product of n-butane oxidation. On the other hand, H2O2 might decompose heterogeneously on the hot reactor walls. In order to test for this possibility, we have admitted H2O2 to the JSR by bubbling Helium through a 50% H2O2 / H2O solution, respecting the same residence time as in the n-butane experiments. We have measured its concentration at the exit of the JSR using cw-CRDS. The result is presented in Figure 7 as a 3-D plot of the absorption spectra obtained at different temperatures up to 625 K in the JSR. It can be clearly seen, that the H2O2 concentration strongly decreases with increasing temperature, while the H2O concentration (admitted together with H2O2 to the reactor) is constant, as can be seen from the stable H2O absorption lines at 6638.57 and 6638.9 cm−1. Above 600K, the H2O2 concentration falls below the detection limit, even though from gas phase kinetic considerations its concentration should be nearly stable. This is a clear hint that H2O2 is destroyed heterogeneously in a temperature dependent reaction and that this loss should be taken into account in the model in order to improve the agreement of experimentally obtained H2O2 profiles with model predictions.
Figure 7.
Destruction of H2O2 concentration when passed through heated JSR: an H2O2 / H2O mixture diluted in helium was passed through the JSR reactor with a residence time of 6 s. The spectrum was measured at different reactor temperatures: all lines are due to H2O2 except the two lines at 6638.57 and 6638.91 cm−1, which are due to H2O.
An earlier study by Porter et al.35 has already shown the influence of wall reactions of H2O2 and HO2 radicals and its significant influence on oxidation phenomena in the case of n-butane, confirming older experimental results obtained in static reactors coated with different types of oxides36. A simulation under our conditions using temperature independent wall reactions such as proposed by Porter et al. for both H2O2 and HO2 radicals would lead to no reactivity at all for n-butane for temperature below 950 K. A simulation using the same wall reactions as Porter et al. but only for H2O2 would lead to a displacement of the reactivity of n-butane of about 100 K toward higher temperatures, and to mole fraction of H2O2 reduced by more than a factor of 10 over the whole temperature range, i.e. much below the observed experimental profiles. Therefore, the wall reactions under the condition of a JSR are probably significantly more limited than those considered by Porter et al. Also, it is clear from the experimental observations (very good agreement in the low temperature range as well as temperature dependent H2O2 destruction presented in Figure 7) that the mechanism in this work exhibits strong temperature dependence and that a model including a temperature independent wall loss will not be able to reproduce the observations.
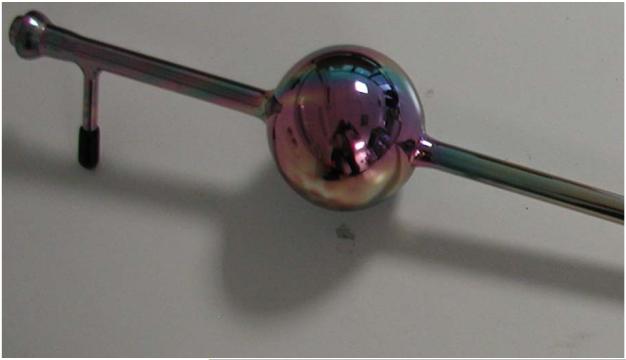
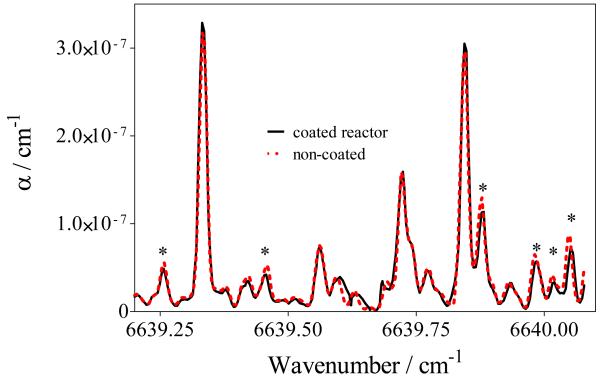
As a tentative to reduce possible wall reactions, we have used for some experiments a reactor such as shown in Figure 8. The walls of this reactor have been entirely covered by an inert coating: SilcoNert™ 2000, provided by SilcoTek. Such surface treatment is known to eliminate adsorption of active compounds on surfaces such as steel, glass, ceramic and carbon surfaces. Figure 9 presents two CRDS spectra: one was obtained using a reactor with the walls coated by the SilcoNert™ 2000 surface treatment (full black line) and one with uncoated walls (dashed red line). Characteristic H2O2 absorption features in this wavelength range are marked with a star, and it can be seen that no significant difference is observed between these two spectra.
Figure 8.
Photography of the JSR, coated by SilcoNert™ 2000
Figure 9.
CRDS spectra obtained with reactor walls fully covered by the SilcoNert™ 2000 surface treatment and with reactor walls without any special treatment.
In order to best reproduce the experimental H2O2 mole fraction profile, we have then included a temperature dependent wall destruction of H2O2 into the model. The rate constant of this possible wall reaction was adjusted in order to match the maximum H2O2 mole fraction observed in the experiments:
This rate constant is about ten times lower than that proposed by Porter et al.35. The activation energy used in this expression has no physical meaning but only indicates the temperature dependence of this process. The results of simulations using this wall reaction in addition to the improved gas-phase only model are shown as dotted line in Figures 1, 2 and S1 – S4. While the implementation of a wall reaction has a major impact on the H2O2 mole fraction at high temperature (see Figure 1d), its influence on the reactivity of n-butane and the formation of carbon containing products and radicals (including HO2 radicals) can be seen as only a slight shift (about 20 K) towards higher temperature between 800 and 850 K, thus improving even more the agreement between model and experimental results.
The experiment in Figure 7 can not be well reproduced with the same rate constant: a nearly complete loss of H2O2 is already observed experimentally at 625 K, while the above rate constant predicts only a decay of the H2O2 concentration during the 6 s residence time of 12%. But such comparison is not straightforward, because in the Figure_7 experiment the H2O2 has also to pass the preheating zone before entering the reactor, a zone with a large surface to volume ratio where a partial destruction of H2O2 can already take place.
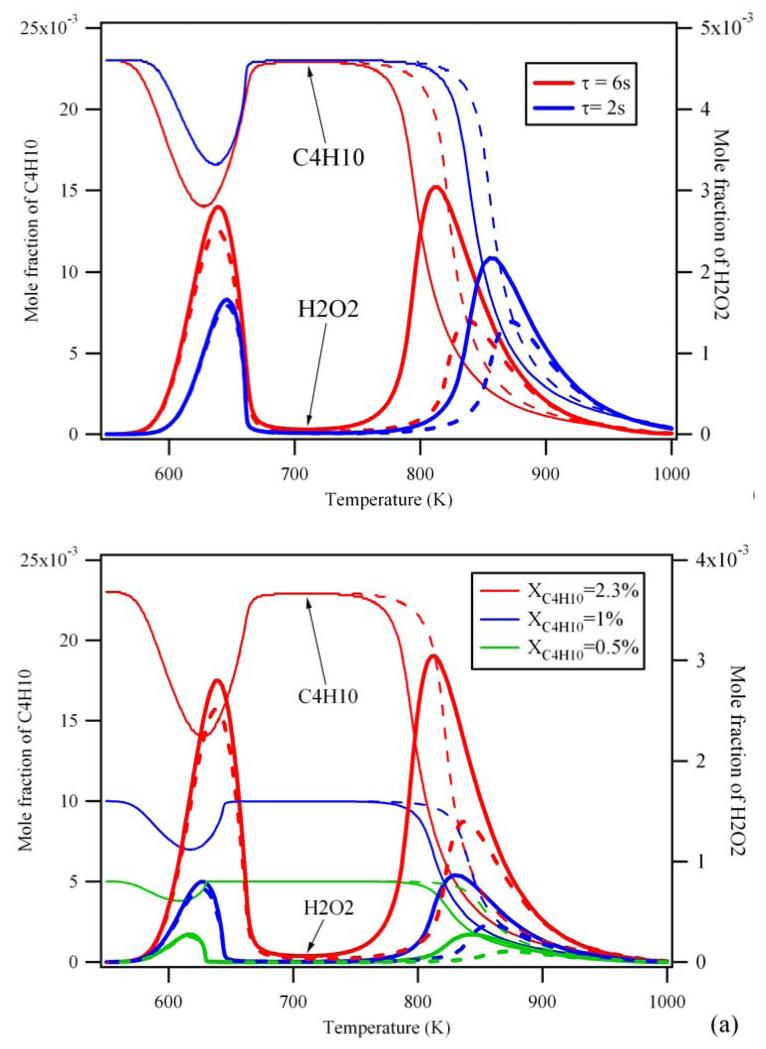
The present study has been carried out at a residence time within the JSR of 6 s, which is rather long: It can be seen from Figure 10a that under such conditions the impact of the wall loss on the H2O2 concentration is particularly high: the wall loss decreases the maximum H2O2 mole fraction by more than 50 %, while at a residence time of 2 s the concentration is decreased by only 37%. Not surprisingly, the wall loss seems rather independent of the inlet fuel concentration: it causes always the same minor shift in reactivity at around 800K while H2O2 concentration drops off by around a factor of 2 for all concentrations (see Figure 10b).
Figure 10.
Influence of the wall reactions for the simulated consumption of n-butane (thin lines) and the formation of H2O2 (thick lines) for (a) different fuel initial mole fractions for a residence time of 6s and (b) different residence times (τ) for an initial fuel mole fraction of 2.3%. Full lines are simulation with the initial gas-phase mechanism dotted lines are simulations considering wall reactions.
Wall destruction of H2O2 within the JSR, mainly significant above 800 K, is therefore a hypothesis which cannot be discarded. Fortunately, the influence of this wall reaction seems to remain very limited on the fuel reactivity and product formation and does not diminish the value of jet-stirred reactor experiments, an experimental technique that allows the analysis of a wide range of stable oxidation products and is an irreplaceable tool to validate detailed kinetic models.
Conclusion
New results on the low temperature oxidation of n-butane have been presented using two complementary detection techniques: cw-CRDS and GC. Two of the stable reaction products can be detected with both techniques: C2H4 and CH2O. While GC is much more adapted for a detection of C2H4, it has been observed that the quantification of CH2O with GC is not very reliable due to a long tail in the peak and co-elution with other species. A major breakthrough in the application of cw-CRDS to combustion systems is the quantification of H2O2, a key species in the development of auto-ignition. It has been observed that the temperature profile of this species is in excellent agreement with current models at low temperature, but that models overpredict its concentration at higher temperature. Gas phase reactions as reason for this disagreement have been excluded through sensitivity analysis and it is now suspected that H2O2 is destroyed through heterogeneous reactions on the hot reactor wall. The major impact of adding a temperature dependent wall loss reaction of H2O2 to the model is a shift in the reactivity of around 20 K in the high temperature range, inducing the same shift in the profiles of most oxidation products, which interestingly leads to a better agreement between model and experiment.
Supplementary Material
Acknowledgement
This work was supported by the European Commission through the “Clean ICE” Advanced Research Grant of the European Research Council and by the COST Action CM0901.
References
- 1.Herbinet O, Battin-Leclerc F, Bax S, Gall HL, Glaude P-A, Fournet R, Zhou Z, Deng L, Guo H, Xie M, Qi F. Phys. Chem. Chem. Phys. 2011;13:296–308. doi: 10.1039/c0cp00539h. [DOI] [PMC free article] [PubMed] [Google Scholar]
- 2.Griffiths JF, Hughes KJ, Porter R. Proc.Comb. Inst. 2005;30:1083–1091. [Google Scholar]
- 3.Guo H, Sun W, Haas FM, Farouk T, Dryer FL, Ju Y. Proc.Comb. Inst. 2013;34:573–581. [Google Scholar]
- 4.Zhao Z, Chaos M, Kazakov A, Dryer FL. Int. J. Chem. Kinet. 2008;40:1–18. [Google Scholar]
- 5.Yasunaga K, Gillespie F, Simmie JM, Curran HJ, Kuraguchi Y, Hoshikawa H, Yamane M, Hidaka Y. J. Phys. Chem. A. 2010;114:9098–9109. doi: 10.1021/jp104070a. [DOI] [PubMed] [Google Scholar]
- 6.Yasunaga K, Simmie JM, Curran HJ, Koike T, Takahashi O, Kuraguchi Y, Hidaka Y. Combust. Flame. 2011;158:1032–1036. [Google Scholar]
- 7.Bahrini C, Herbinet O, Glaude P-A, Schoemaecker C, Fittschen C, Battin-Leclerc F. Jounal of the American Chemical Society. 2012;134:11944–11947. doi: 10.1021/ja305200h. [DOI] [PMC free article] [PubMed] [Google Scholar]
- 8.Battin-Leclerc F, Herbinet O, Glaude PA, Fournet R, Zhou ZY, Deng LL, Guo HJ, Xie MF, Qi F. Proc.Comb. Inst. 2011;33:325–331. doi: 10.1016/j.proci.2010.05.001. [DOI] [PMC free article] [PubMed] [Google Scholar]
- 9.Troe J. Combust. Flame. 2011;158:594–601. [Google Scholar]
- 10.Bahrini C, Herbinet O, Glaude P-A, Schoemaecker C, Fittschen C, Battin-Leclerc F. Chem. Phys. Lett. 2012;534:1–7. doi: 10.1016/j.cplett.2012.03.012. [DOI] [PMC free article] [PubMed] [Google Scholar]
- 11.Bax S, Hakka MH, Glaude PA, Herbinet O, Battin-Leclerc F. Combust. Flame. 2010;157:1220–1229. doi: 10.1016/j.combustflame.2009.12.008. [DOI] [PMC free article] [PubMed] [Google Scholar]
- 12.Bahrini C, Parker A, Schoemaecker C, Fittschen C. Appl. Catal. B: Env. 2010;99:413–419. [Google Scholar]
- 13.Biet J, Hakka MH, Warth V, Glaude PA, Battin-Leclerc F. Energy Fuels. 2008;22:2258–2269. [Google Scholar]
- 14.Hakka MH, Glaude PA, Herbinet O, Battin-Leclerc F. Combust. Flame. 2009;156:2129–2144. doi: 10.1016/j.combustflame.2009.12.008. [DOI] [PMC free article] [PubMed] [Google Scholar]
- 15.Cord M, Sirjean B, Fournet R, Tomlin A, Ruiz-Lopez M, Battin-Leclerc F. J. Phys. Chem. A. 2012;116:6142–6158. doi: 10.1021/jp211434f. [DOI] [PMC free article] [PubMed] [Google Scholar]
- 16.Parker A, Jain C, Schoemaecker C, Szriftgiser P, Votava O, Fittschen C. Appl. Phys. B: Lasers and Optics. 2011;103:725–733. [Google Scholar]
- 17.Buda F, Bounaceur R, Warth V, Glaude P, Fournet R, Battin-Leclerc F. Combust. Flame. 2005;142:170–186. [Google Scholar]
- 18.Chakir A, Cathonnet M, Boettner JC, Gaillard F. Combust. Sci. Technol. 1989;65:207–230. [Google Scholar]
- 19.Minetti R, Ribaucour M, Carlier M, Fittschen C, Sochet LR. Combust. Flame. 1994;96:201–211. [Google Scholar]
- 20.Miller JA, Pilling MJ, Troe J. Proc.Comb. Inst. 2005;30:43–88. [Google Scholar]
- 21.Staak M, Gash EW, Venables DS, Ruth AA. J. Mol. Spectrosc. 2005;229:115–121. [Google Scholar]
- 22.Morajkar P, Schoemaecker C, Fittschen C. J. Mol. Spectrosc. 2012;281:18–23. [Google Scholar]
- 23.Campargue A, Wang L, Liu AW, Hu SM, Kassi S. Chem. Phys. 2010;373:203–210. [Google Scholar]
- 24.Wojdyr M. J. Appl. Cryst. 43. 2010;43:1126–1128. [Google Scholar]
- 25.Atkinson R, Baulch DL, Cox RA, Crowley JN, Hampson RF, Hynes RG, Jenkin ME, Rossi MJ, Troe J. Atmos. Chem. Phys. 2006;6:3625–4055. [Google Scholar]
- 26.Macko P, Romanini D, Mikhailenko SN, Naumenko OV, Kassi S, Jenouvrier A, Tyuterev G, Campargue A. J. Mol. Spectrosc. 2004;227:90–108. [Google Scholar]
- 27.Durry G, Zeninari V, Parvitte B, Le barbu T, Lefevre F, Ovarlez J, Gamache RR. J. Quant. Spectrosc. Radiat. Transfer. 2005;94:387–403. [Google Scholar]
- 28.Atkinson R, Baulch DL, Cox RA, Crowley JN, Hampson RF, Hynes RG, Jenkin ME, Rossi MJ, Troe J. Atmos. Chem. Phys. 2004;4:1461–1738. [Google Scholar]
- 29.Thiebaud J, Crunaire S, Fittschen C. J. Phys. Chem. A. 2007;111:6959–6966. doi: 10.1021/jp0703307. [DOI] [PubMed] [Google Scholar]
- 30.Amedro D, Miyazaki K, Parker A, Schoemaecker C, Fittschen C. JES. 2012;24:78–86. doi: 10.1016/s1001-0742(11)60723-7. [DOI] [PubMed] [Google Scholar]
- 31.Parker A, Amedro D, Schoemaecker C, Fittschen C. JEEM. 2011;10:107–114. [Google Scholar]
- 32.Amedro D, Parker AE, Schoemaecker C, Fittschen C. Chem. Phys. Lett. 2011;513:12–16. [Google Scholar]
- 33.Miyazaki K, Parker AE, Fittschen C, Monks PS, Kajii Y. Atmos. Meas. Tech. 2010;3:1547–1554. [Google Scholar]
- 34.Baulch DL, Cobos CJ, Cox RA, Frank P, Hayman G, Just T, Kerr JA, Murrells T, Pilling MJ, Troe J, Walker RW, Warnatz J. J. Phys. Chem. Ref. Data. 1994;23:847–1033. [Google Scholar]
- 35.Porter R, Glaude PA, Buda F, Battin-Leclerc F. Energy Fuels. 2008;22:3736–3743. [Google Scholar]
- 36.Cherneskey M, Bardwell J. Canadian Journal of Chemistry-Revue Canadienne De Chimie. 1960;38:482–492. [Google Scholar]
- 37.Ibrahim N, Thiebaud J, Orphal J, Fittschen C. J. Mol. Spectrosc. 2007;242:64–69. [Google Scholar]
Associated Data
This section collects any data citations, data availability statements, or supplementary materials included in this article.


