

Abstract
Purpose
The primary objective of this study was to investigate if changes in 18F-FLT kinetic parameters, taken at an early stage after start of therapy, could predict overall survival (OS) and progression-free survival (PFS) in patients with recurrent malignant glioma undergoing treatment with bevacizumab and irinotecan.
Experimental Design
High-grade recurrent brain tumors were investigated in 18 patients (8M, 10F), 26-76 yr. Each had 3 dynamic PET studies: at baseline, and after 2 weeks, and 6 weeks from the start of treatment. 2.0 MBq/kg of 18F-FLT was injected intravenously and dynamic PET images acquired for 1 hr. Factor analysis generated factor images from which blood and tumor uptake curves were derived. A 3-compartment, 2-tissue model was applied to estimate the tumor 18F-FLT kinetic rate constants using a metabolite and partial volume corrected input function. Different combinations of predictor variables were exhaustively searched in a discriminant function to accurately classify patients into their known OS and PFS groups. A leave-one-out cross-validation technique was used to assess the generalizability of the model predictions.
Results
In this study population, changes in single parameters such as standardized uptake value or influx rate constant did not accurately classify patients into their respective OS groups (<1yr and ≥1yr) [hit-ratios ≤ 78%]. However, changes in a set of 18F-FLT kinetic parameters could perfectly separate these two groups of patients [hit-ratio=100%] and were also able to correctly classify patients into their respective PFS groups (<100 days and ≥100 days) [hit-ratio=88%].
Conclusions
Discriminant analysis using changes in 18F-FLT kinetic parameters early during treatment appears to be a powerful method for evaluating the efficacy of therapeutic regimens.
Keywords: Recurrent Glioma, Discriminant Analysis, FLT-PET, Tracer Kinetic Modeling, Treatment Response Assessment
Introduction
In vivo imaging of cellular proliferation has tremendous potential for monitoring and predicting response to anticancer therapy. The thymidine nucleoside analog, 3′-deoxy-3′-[18F]-Fluoro-Thymidine (18F-FLT), was developed as a molecular imaging probe to assess cellular proliferation in vivo with positron emission tomography (PET) (1). Once 18F-FLT is transported into the cell, it is phosphorylated by thymidine kinase-1 (TK-1) and subsequently trapped inside the cell (2). TK-1 is a cytosolic enzyme that is expressed during the DNA synthesis stage of the cell cycle (2). The rate limiting step in 18F-FLT accumulation is phosphorylation by TK-1, causing 18F-FLT to accumulate in proportion to TK-1 activity (3). Compared to normal proliferating tissue, tumor cells have increased levels of TK-1, resulting in increased 18F-FLT uptake (4). The half-life of 18F makes 18F-FLT suitable for tracer kinetic analysis.
In a patient population with non-treated newly diagnosed high-grade gliomas, it was shown that kinetic modeling of 18F-FLT enabled determination of tumor proliferation in vivo via the metabolic influx constant Ki (4). In their study, Ki strongly correlated with the proliferation index as measured by Ki-67 immunostaining, whereas uptake of methyl-11C-L-methionine (11C-MET) or 18F-FLT failed to correlate with the in vitro proliferation marker Ki-67. Furthermore, an NCI-sponsored trial explored the capacity of 18F-FLT PET to distinguish recurrence from radiation necrosis in previously treated gliomas (5). In the NCI trial, it was shown that Ki and the phosophorylation rate constant k3 appeared to distinguish tumor recurrence from radiation necrosis, with the clinical diagnosis determined independently after the 18F-FLT PET scan (5). Standardized uptake values (SUVs) and visual analyses of 18F-FLT or 2-18F-Fluoro-deoxy-D-glucose (18F-FDG) images did not significantly separate the two groups in the NCI trial. Kinetic modeling with 18F-FLT and other molecular imaging probes in brain tumor patients have also been reported elsewhere (6-10).
In the evaluation of treatment response, 18F-FLT was used in a group of patients with recurrent glioma who received a combination of antiangiogenic and chemotherapy agents (11). A reduction of more than 25% in tumor SUV, defined as a metabolic response, was found to be the threshold with the best predictive power for overall survival (11). Treatment response in patients with brain tumors has also been assessed by other PET tracers (12-14) and with advanced magnetic resonance imaging (MRI) techniques (15, 16).
The primary purpose of this work was to investigate if changes in 18F-FLT kinetic parameters, taken at an early stage after the start of therapy, could predict overall survival (OS) and progression-free survival (PFS) in patients with recurrent malignant glioma undergoing treatment with bevacizumab and irinotecan. We hypothesized that there exists a group of kinetic parameter changes that when incorporated into a linear discriminant function, would be able to accurately distinguish short-term from long-term survivors. We also hypothesized that this set of parameter changes would provide more predictive information than 18F-FLT uptake changes alone.
Materials and Methods
Study Participants
The studied population consisted of 18 patients with recurrent high-grade glioma. Fifteen of the eighteen patients were from our previous study (10), and three were newly enrolled. The time period during which the data was collected was from July 2005 to June 2009. There were 8 men and 10 women, with a mean age of 54 ± 15 y (range 26-76 y) at the start of the study. All gliomas were confirmed by histopathology and graded using the World Health Organization scheme. Sixteen patients had glioblastoma multiforme (GBM; grade IV), one had anaplastic astrocytoma (AA; grade III), and one had anaplastic mixed glioma (AMG; grade III). Each patient had previously undergone surgical resection followed by adjuvant treatment with chemotherapy and/or radiation. The median number of prior treatments was one (range 1-3). An overview of the population data is shown in Table 1. In accordance with the procedures of the Office of the Human Research Protection Program at UCLA, written informed consent was obtained from all subjects.
Table 1.
Clinical characteristics of all patients.
| Patient No. | Sex | Age (years) | Pathology at Recurrence | WHO Grade at Recurrence | Initial Therapy | Prior Treatments | Time from Initial Diagnosis (days) | PFS (days) | OS (days) |
|---|---|---|---|---|---|---|---|---|---|
| 1 | M | 50 | AA | 3 | Chemotherapy/XRT | 2 | 332 | 29 | 59 |
| 2 | M | 69 | GBM | 4 | Chemotherapy/XRT | 1 | 76 | 81 | 81 |
| 3 | F | 65 | GBM | 4 | Chemotherapy/XRT | 2 | 578 | 78 | 107 |
| 4 | F | 59 | GBM | 4 | Chemotherapy/XRT | 1 | 322 | 42 | 169 |
| 5 | M | 64 | GBM | 4 | Chemotherapy/XRT | 1 | 178 | 70 | 234 |
| 6 | F | 37 | AMG | 3 | Chemotherapy/XRT | 1 | 160 | 155 | 260 |
| 7 | M | 37 | GBM | 4 | Chemotherapy | 2 | 4225 | 62 | 292 |
| 8 | M | 68 | GBM | 4 | Chemotherapy/XRT | 2 | 332 | 218 | 315 |
| 9 | F | 35 | GBM | 4 | XRT | 3 | 2804 | 65 | 318 |
| 10 | F | 54 | GBM | 4 | Chemotherapy/XRT | 1 | 91 | 226 | 343 |
| 11 | M | 45 | GBM | 4 | Chemotherapy/XRT | 1 | 132 | 74 | 344 |
| 12 | M | 26 | GBM | 4 | Chemotherapy | 3 | 462 | 96 | 364 |
| 13 | F | 40 | GBM | 4 | Chemotherapy/XRT | 1 | 462 | 44 | 366 |
| 14 | F | 47 | GBM | 4 | Chemotherapy/XRT | 1 | 160 | 176 | 374 |
| 15 | F | 70 | GBM | 4 | Chemotherapy/XRT | 1 | 362 | 184 | 395 |
| 16 | F | 61 | GBM | 4 | Chemotherapy/XRT | 2 | 719 | 137 | 400 |
| 17 | F | 62 | GBM | 4 | Chemotherapy/XRT | 1 | 316 | 273 | 709 |
| 18 | M | 76 | GBM | 4 | Chemotherapy/XRT | 1 | 134 | 978 | 978 |
Time from initial diagnosis is the number of days from initial diagnosis to start of treatment in current study.
GBM = glioblastoma multiforme; AA = anaplastic astrocytoma; AMG = anaplastic mixed glioma; XRT = radiation therapy.
Treatment
Patients were treated off-label with biweekly cycles of bevacizumab (10 mg/kg) and irinotecan (125 or 350 mg/m2 depending on concomitant use of enzyme-inducing anti-epileptic drugs). Bevacizumab is a recombinant humanized monoclonal antibody that binds to and inhibits the activity of vascular endothelial growth factor. Irinotecan is a chemotherapeutic agent that inhibits topoisomerase I, an enzyme that helps unwind DNA during replication. All 18 enrolled patients finished the first course of 6 weeks. No patient was lost to follow-up.
Patient Outcome
Patients had regular follow-up at the Neuro-Oncology Clinic, and the date of progression was diagnosed by the Neuro-Oncologist based on physical exam, clinical deterioration, and imaging. PFS was calculated from the date of baseline 18F-FLT PET to the date of disease progression. In data pooled from sixteen clinical trials that used various pharmaceuticals in treating patients for recurrent GBM (none of which included bevacizumab), the median PFS was 1.8 months (17). Since most tumors in our patient population were GBM (16/18 = 89%), we selected 100 days as a reasonable cutoff for patients with rapid recurrence versus usual disease progression. OS was calculated from the date of baseline 18F-FLT PET to the date of patient death. A cut-off of 1 year for OS (17) was used to distinguish short-term from long-term survivors.
18F-FLT Synthesis
18F-FLT was synthesized according to the method developed by Walsh et al. (18). The chemical and radiochemical purities of 18F-FLT were found to be >99%. The specific activity of 18F-FLT was >1000 Ci/mmol (>37 TBq/mmol). The final product was sterile and pyrogen free.
Imaging Protocol
The study protocol was approved by the UCLA Institutional Review Board, the UCLA Medical Radiation Safety Committee, and the UCLA Radioactive Drug Research Committee. A baseline 18F-FLT PET (study 1 [S1]) was performed within 1 week before the start of treatment, and follow-up 18F-FLT scans were performed at 2 weeks (study 2 [S2]), and then again at 6 weeks (study 3 [S3]) after the start of treatment. The experimental design is illustrated in Fig. 1. PET imaging was performed with an ECAT EXACT HR+ scanner (Siemens/CTI, Knoxville, TN). The intrinsic spatial resolution of the scanner was 4.5 mm full width at half maximum (FWHM) in the center of the field of view. Using a set of external rotating 68Ge/68Ga rod sources, a transmission scan was first acquired for 5 minutes in 2-D mode to correct for photon attenuation. Subsequently, 2.0 MBq/kg of 18F-FLT was injected intravenously as a bolus and a dynamic emission scan with twenty-three frames (8×15 sec, 2×30 sec, 2×60 sec, 11×5 min) was acquired in 3-D mode. PET emission data were reconstructed using ordered subset expectation maximization (6 iterations and 16 subsets) with a zoom factor of 2.5. A Gaussian kernel of 5 mm FWHM was used as a post-reconstruction smoothing filter. The spatial resolution of the final reconstructed images was 6.7 mm FWHM. The final reconstructed volume had a matrix size of 128×128 and consisted of 63 planes, resulting in a voxel size of 2.06×2.06×2.425 mm3.
Figure 1.
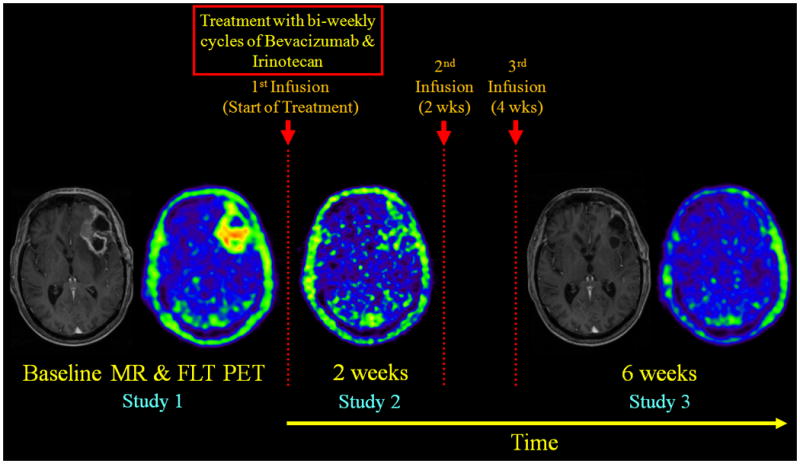
Experimental design used in this study. A baseline 18F-FLT PET was performed within 1 week before the start of treatment, and follow-up 18F-FLT PET scans were performed at 2 weeks, and then again at 6 weeks after the start of treatment. Shown above are summed 18F-FLT PET images (50-60 min) and their corresponding contrast-enhanced T1-weighted MRIs. No MRI was performed at 2 weeks. 18F-FLT PET images at 2- and 6-weeks were co-registered to the baseline PET, and the 6-week MRI was aligned to the co-registered baseline MRI. Images are displayed using the same color scale within each modality. The patient shown here was a long-term survivor.
Factor Analysis
Factor analysis (19, 20) generated factor images, from which blood and tumor uptake curves were derived. Briefly, the factor model assumes that in a dynamic image there are groups of voxels that have the same time behavior (21). In our implementation, three factor images (representing the brain vessels, tumor, and the rest) were generated. A 50% threshold of the maximum voxel in the vascular factor image (transverse and cavernous sinuses) was used to create a volume-of-interest (VOI) that would extract the blood time-activity curve (TAC) when overlaid on the dynamic PET image. The tumor TAC was extracted using a 75% threshold of the tumor factor image in order to get the most proliferative part of the tumor. Necrotic zones have low 18F-FLT uptake and, therefore, do not reach the threshold of 75% uptake of the tumor maximum. Areas with necrosis (e.g., centrally “cold” tumors) were thus explicitly excluded during the VOI creation. The effects of using varying isocontours have been investigated earlier (10). The measured blood and tumor TACs were then used for kinetic modeling analysis.
18F-FLT Compartmental Model
The standard 3-compartment, 2-tissue model for 18F-FLT is analogous to that of 18F-FDG and is illustrated in Supplementary Fig. S1. After intravenous injection, 18F-FLT is transported across the cell membrane by sodium-dependent (concentrative) and sodium-independent (equilibrative) nucleoside transporters (22). The transport of 18F-FLT from the plasma compartment (CP) into the exchangeable tissue compartment (CE), as it crosses the disrupted blood brain barrier (BBB), is represented by the rate constant K1 (mL·cm−3·min−1). The exchangeable tissue compartment represents 18F-FLT in its intact, non-phosphorylated state. 18F-FLT-glucuronide, a metabolite that accumulates in the blood over time when 18F-FLT is metabolized by the liver, does not cross into the exchangeable tissue compartment (i.e., it is restricted to the vascular space). Furthermore, it has been shown that there is no partitioning in the vascular space and that plasma and whole blood activity concentrations are the same (23, 24). The return of 18F-FLT from the exchangeable tissue compartment back into the plasma compartment is represented by the rate constant k2 (min-1).
At the intracellular level, 18F-FLT in the exchangeable compartment is phosphorylated by TK-1 to produce the nucleotide 18F-FLT-monophosphate and, to a limited degree, the di- and triphosphate forms as well (2). The metabolic trapping of 18F-FLT via the phosphorylation step is represented by the rate constant k3 (min-1). 18F-FLT nucleotides in the trapped compartment (CM) are not incorporated into DNA (2). However, 18F-FLT nucleotides in the trapped compartment can be dephosphorylated back into the exchangeable compartment, as represented by the rate constant k4 (min-1).
The differential equations that describe the rate of change of 18F-FLT concentration in each of the tissue compartments can be solved using Laplace transforms with their solutions shown in (25). Kinetic modeling yields four rate constants (K1 − k4) and an estimated fifth parameter Vb, which is the fraction of vascular space in the tumor VOI. For brain tumor regions where the BBB is disrupted, Vb contains some interstitial space as well. From these five estimated micro-parameters, certain physiologically important macro-parameters can be calculated, such as the influx rate constant [Ki = K1 · k3 / (k2 + k3)], the volume of distribution [Vd=K1 / (k2 + k3)], and the phosphorylated fraction [PF = k3 / (k2 + k3)]. PF is the fraction of 18F-FLT transported via K1 that ends up in the phosphorylated 18F-FLT pool. In addition, 18F-FLT uptake measurements (expressed as SUV) were calculated at early (from 10-25 min) and late time-points (from 50-60 min).
Metabolite and Partial Volume Corrections
Blood metabolites were not measured in this study. Metabolites in the blood were corrected for by subtracting a metabolite fraction from the blood TAC as explained in our previous publication (7). The equation for the metabolite fraction over time was calculated as 0.42×(1−e−0.029×t). A recovery coefficient of 0.7 was chosen to convert the image-based measured blood TAC to the input function (7). Since the tumors were relatively large (>15 mm) compared to the image resolution, the recovery coefficient of the output function was set to unity (7).
Statistical Analysis
The Mann-Whitney U-test was used for between-group comparisons for all absolute parameters (at each study time-point) and their relative changes (between each study time-point). For paired samples, the Wilcoxon signed ranks test was applied. Spearman correlations were computed to assess the strength of any linear relationships between two variables. All statistical analyses were performed using SPSS version 19.0 (IBM Corp). The results are reported as the mean ± standard deviation (unless otherwise noted) and differences are regarded as statistically significant if P < 0.05.
Discriminant Analysis
Given a common set of variables for two or more groups of individuals, discriminant analysis attempts to find linear combinations of those variables that best separate each group (26). These combinations are called discriminant (or classification) functions and have the form displayed below in Eq. 1.
| Eq. 1 |
where D is the discriminant score formed by the discriminant function, bn are the unstandardized discriminant coefficients, xn are the predictor variables, and C is a constant. The values of the coefficients are chosen so that the discriminant scores of individuals in any group have the smallest possible variance and, at the same time, the difference between the average discriminant scores of the two groups is as big as possible (26). A graphical representation of the predictive technique is shown in Supplementary Fig. S2.
In this study, a discriminant function was generated on the original sample of eighteen subjects for which group membership was known. All possible predictor combinations were exhaustively searched to maximize a test statistic called Wilks' lambda (27). To produce a nearly unbiased estimate of the proportion misclassified, a leave-one-out cross-validation procedure was performed whereby each subject was excluded and then classified using the discriminant function based on the remaining subjects (26). For each predictor combination, the classification accuracies of the original grouped cases and the cross-validated grouped cases were computed. Press's Q statistic was used to determine whether the discriminatory power of the classification model was statistically better than chance (27).
Results
Outcome Analysis
Table 1 summarizes the clinical characteristics of all patients. At the time of this writing, all patients had died and therefore all variables (clinical and imaging based) were known. Patients in the original sample (n = 18) were designated into two groups with regard to their OS and PFS and the cutoffs of 1 year and 100 days, respectively (as detailed under Patient Outcome). The groups for OS will be referred to from here on as Short-OS and Long-OS, and the groups for PFS will be referred to as Short-PFS and Long-PFS. The median OS and PFS for the entire sample were 330.5 days (11.0 months) and 88.5 days (2.95 months), respectively. The median OS for Short-OS (n = 12) and Long-OS (n = 6) was 276 and 398 days (9.2 and 13.3 months), respectively. The median PFS for Short-PFS (n = 9) and Long-PFS (n = 8) was 70 and 201 days (2.3 and 6.7 months), respectively. Patient 1 from Table 1 was not included in the PFS analysis since this person's tumor progressed before the 6-week PET measurement. OS and PFS were shown to be correlated (Spearman rho = 0.62, P<0.007).
Factor Analysis
Supplementary Fig. S3 shows the vascular and tumor factor images along with the measured blood and tumor TACs. 3-D movies of the factor images can be found in the Supplementary Data section.
Tumor Kinetics and SUV
Mean 18F-FLT SUVs for Short-OS and Long-OS at each of the three study time-points are shown as bar graphs in Supplementary Fig. S4. Similar graphs for the two patient groups are shown in Supplementary Fig. S5 for various kinetic parameters and Vb (unitless).
At each study time-point, detailed inspection of the absolute values of kinetic and SUV parameters revealed no significant group differences between Short-OS and Long-OS and between Short-PFS and Long-PFS; therefore relative changes were calculated and analyzed. The percent change in SUV from , S1→S3 and S2→S3 are shown for both Short-OS and Long-OS in Supplementary Table S1. The percent change in kinetic and derived parameters from S1→S3 are shown in Table 2, while those from S1→S2 and S2→S3 are shown in Supplementary Tables S2 and S3, respectively. From S1→S2, SUV (early and late) and Ki decreased for both Short-OS and Long-OS. However, from S2→S3, Short-OS increased in their SUV and Ki values while Long-OS continued to decrease in theirs. A slightly different scenario played out for k3 and PF. From S1→S2, k3 and PF increased for both Short-OS and Long-OS. However, from S2→S3, Short-OS continued to increase in their k3 and PF values while Long-OS decreased in theirs.
Table 2.
Percent change in 18F-FLT kinetic parameters (Baseline → 6 weeks).
| Patient No. | ΔK1 | Δk2 | Δk3 | Δk4 | ΔVb | ΔKi | ΔVd | ΔPF | |
|---|---|---|---|---|---|---|---|---|---|
| Short-OS | 1 | -52 | -29 | -30 | 14 | 9 | -52 | -32 | 0 |
| 2 | -28 | -24 | 47 | 126 | 265 | 12 | -23 | 56 | |
| 3 | 137 | 2 | -55 | -44 | 5 | 24 | 177 | -48 | |
| 4 | -60 | -42 | 86 | 176 | -7 | -22 | -58 | 94 | |
| 5 | -51 | -20 | 20 | 2 | -20 | -35 | -46 | 31 | |
| 6 | -8 | -26 | -26 | 8 | -22 | -7 | 24 | 0 | |
| 7 | -68 | -79 | 55 | -30 | -84 | 2 | -34 | 216 | |
| 8 | -71 | -61 | -64 | -77 | -10 | -72 | -23 | -4 | |
| 9 | -68 | -74 | 7 | 50 | 54 | -32 | -36 | 111 | |
| 10 | 13 | 354 | 281 | 159 | 0 | 2 | -73 | -9 | |
| 11 | -20 | 56 | 55 | -9 | -15 | -20 | -49 | 0 | |
| 12 | 39 | 40 | 60 | -20 | -29 | 53 | -4 | 11 | |
| Mean ± SD (n = 12) | -20 ± 60 | 8 ± 116 | 36 ± 91 | 30 ± 82 | 12 ± 86 | -12 ± 34 | -15 ± 65 | 38 ± 72 | |
| Long-OS | 13 | -40 | -48 | -56 | -50 | -53 | -48 | 20 | -12 |
| 14 | -50 | -62 | -63 | -43 | -39 | -50 | 35 | -1 | |
| 15 | 105 | 120 | -48 | -16 | -44 | -40 | 14 | -71 | |
| 16 | 5 | 174 | 90 | 3 | -62 | -22 | -59 | -25 | |
| 17 | -17 | 8 | -26 | -2 | -2 | -40 | -18 | -27 | |
| 18 | -90 | -84 | -21 | 25 | 21 | -74 | -67 | 160 | |
| Mean ± SD (n = 6) | -15 ± 67 | 18 ± 106 | -21 ± 57 | -14 ± 29 | -30 ± 32 | -46 ± 17 | -13 ± 43 | 4 ± 80 |
The Wilcoxon signed ranks test was used for evaluating the within-group effects. For Short-OS, significant paired sample differences were found for K1, Ki, Vd and SUV (early and late) from S1→S2, and for Vd and SUVearly from S1→S3. No significant paired sample differences were found from S2→S3 for Short-OS. For Long-OS, significant paired sample differences were found for Vb and SUV (early and late) from S1→S2, and for Ki and SUV (early and late) from S1→S3. No significant paired sample differences were found from S2→S3 for Long-OS.
For Short-PFS, significant paired sample differences were found for K1, Ki and SUV (early and late) from S1→S2, and for Ki and SUVlate from S2→S3. No significant paired sample differences were found from S1→S3 for Short-PFS. For Long-PFS, significant paired sample differences were found for K1, Vb, Ki, Vd and SUV (early and late) from S1→S2, and for Ki and SUV (early and late) from S1→S3. No significant paired sample differences were found from S2→S3 for Long-PFS.
When analyzing the relative changes between studies, several significant between-group differences were revealed using the Mann-Whitney U-test. The change in blood volume fraction (ΔVb) from S1→S2, the change in influx rate constant (ΔKi) from S1→S3, and the changes in k3, Ki and PF from S2→S3 were shown to be statistically significant between Short-OS and Long-OS. With regard to PFS, no significant group differences were found for all the various kinetic and SUV changes from S1→S2. However, the change in Ki from S1→S3, and the changes in k3, Ki and PF from S2→S3 were shown to be statistically significant between Short-PFS and Long-PFS.
Classification using SUV
Reductions in SUV (early and late) of more than 25% from S1→S2 and S1→S3 were used as one method (11) to classify patients into their known OS group membership (<1 yr or ≥1 yr). A reduction in SUVearly of more than 25% from S1→S2 yielded the best results with a classification accuracy (or hit-ratio) of 56% (10/18) (Fig. 2A).
Figure 2.

(A) Using a reduction in SUVearly of more than 25% after 2 weeks from the start of treatment correctly classified 10 out of 18 patients. With this SUV reduction criterion, seven patients in Short-OS would be misclassified as long-term survivors and one patient in Long-OS would be misclassified as a short-term survivor. (B) Discriminant analysis using changes in 18F-FLT kinetics was able to correctly classify all 18 patients in their true OS group. Note the complete separation of the discriminant scores between the two groups.
In another approach, when a change in SUV (early and late) from S1→S2, S1→S3 or S2→S3 was used as a single predictor variable in a discriminant function, ΔSUVearly from S2→S3 and ΔSUVlate from S2→S3 yielded the best results with hit-ratios of 78% (14/18) each. ΔSUVlate from S1→S3 yielded the next best classification result with a hit-ratio of 56% (10/18).
Classification using Kinetic Information
Table 3 summarizes the discriminant functions (DF1 and DF2) that best classify the eighteen patients into their respective OS (<1 yr or ≥1 yr) and PFS (<100 days or ≥100 days) groups using an optimal group of 18F-FLT kinetic parameter changes. The predictor variables are shown in descending rank order in terms of their standardized coefficients. None of the discriminating variables in DF1 and DF2 were found to be significantly correlated with each other.
Table 3.
Discriminant functions for classifying patients into their respective OS and PFS groups using 18F-FLT kinetic information.
| Discriminant Function for Overall Survival (DF1) | ||
|---|---|---|
| Predictor Variables | Unstandardized Coefficients | Standardized Coefficients |
| ΔK1 (S1→S2) | 3.994 | 1.101 |
| ΔKi (S1→S3) | -3.175 | -0.951 |
| ΔPF (S1→S2) | 1.311 | 0.940 |
| ΔVb (S1→S2) | -3.019 | -0.813 |
| Constant | -0.364 | — |
| Discriminant Function for Progression-Free Survival (DF2) | ||
| Predictor Variables | Unstandardized Coefficients | Standardized Coefficients |
| ΔPF (S2→S3) | 3.309 | 1.230 |
| ΔK1 (S2→S3) | 1.250 | 0.988 |
| ΔVb (S2→S3) | 0.640 | 0.637 |
| Constant | -0.740 | — |
The classification results showed that DF1 correctly predicted 100% (18/18) of the original sample into their appropriate OS groups (Wilks' λ = 0.264, χ2(4) =18.65, P = 0.001). With cross-validation, the classification accuracy was 94% (17/18). The discriminant scores of each individual using DF1 are shown in Fig. 2B. Furthermore, if a change in Ki was used as the only predictor variable in the discriminant function, ΔKi from S2→S3 yielded the best results with a hit-ratio of 78% (14/18). ΔKi from S1→S3 yielded the next best classification result with a hit-ratio of 72% (13/18).
For PFS, the results showed comparable performance. The classification results showed that DF2 correctly predicted 88% (15/17) of the original sample into their appropriate PFS groups (Wilks' λ = 0.402, χ2(3) = 12.30, P = 0.006). With cross-validation, the classification accuracy remained at 88%. The discriminant scores of each individual using DF2 are shown in Fig. 3. In addition, Press's Q statistic showed that the discriminant models of DF1 and DF2 performed significantly better than pure chance expectations (P < 0.005).
Figure 3.

Discriminant analysis using changes in 18F-FLT kinetics was able to correctly classify PFS group membership for 15 out of 17 patients. Patient 1 from Table 1 was not included in the analysis since tumor progression occurred before the 6-week PET measurement.
Discussion
In order to correctly predict a cancer patient's response to a certain treatment, it is prudent to collect as much biological/functional information about the patient's tumor before and after the start of treatment. Kinetic modeling in PET can provide such information. Instead of being limited to looking at just one part of the tumor biology, kinetic modeling with dynamic PET data can give us a better view of what's going on with the tumor dynamics as a whole. This is why PET is such a powerful tool in studying the biology of human disease (25, 28).
In this study, changes in 18F-FLT kinetic parameters, taken at an early stage after the start of therapy, were used in a linear discriminant function to stratify clinical outcome in eighteen recurrent brain tumor patients. We showed that with this method, we were able to accurately classify the patient population into their respective OS and PFS groups with classification accuracies of 100% and 88%, respectively. It was the relative changes in 18F-FLT kinetic parameters, not their absolute values that were of importance to the group classification. The leave-one-out cross-validation technique, which was a measure of the discriminant function's robustness, provided classification results that were also comparable. Taken together, these findings indicate that the proportion of variance in the discriminant functions explained by the predictor variables that define group membership was significantly high. What's more, the kinetic analysis is completely image-based and virtually operator-independent.
The discriminant functions for OS and PFS included a parsimonious group of predictor variables that produced excellent classification results. The changes in K1, PF and Vb from S1→S2 as well as the change in Ki (includes K1 and k3) from S1→S3 were shown to be a powerful set of predictor variables for classifying patients into their respective known OS groups. For predicting PFS group membership, the changes in PF, K1, and Vb from S2→S3 were shown to be a good set of classification variables. The predictor variables in the discriminant functions for OS and PFS were not the same, which seems reasonable because the cause of disease progression at 100 days is presumably different from the cause of death at 1 year. Additionally, the tumor cell biology could change during the course of therapy. The predictor variables were not highly correlated within each function, indicating that little redundant information was shared by them in the group classification.
The predictor variables in the discriminant functions have biological relevance as well. ΔKi (S1→S3) reflects the overall proliferation difference between the short-term and long-term survivors [ΔKi (S1→S3) decreases more in the long-term survivors] (10). Concerning a biological explanation for ΔK1 (S1→S2), ΔPF (S1→S2) and ΔVb (S1→S2), one could speculate on the following two levels.
Firstly, normalization of the neo-vascularization by bevacizumab. Patients responding more favorably are expected to show a larger decrease in Vb, which is what we found. Transient normalization of the tumor vasculature could also enhance the delivery of administered cytotoxic agents (29). It has been previously shown that TK-1 is up-regulated in response to DNA damage caused by genotoxic insults in tumor cells (30, 31). Irinotecan and its more potent metabolite, SN-38, are known to induce single-strand and double-strand DNA breaks (32). This may be the early scenario with the tumors of the long-term survivors before they eventually succumb to the cytotoxic effects of additional chemotherapy. This would explain the larger initial increase in ΔPF and Δk3 from S1→S2 for the long-term survivors.
Secondly, changes in the permeability of the vasculature and the tumor. Aggressive tumors most likely have a “leaky BBB” when compared to lower grade tumors. This explains why the baseline transport rate K1 was high. If the therapy is able to restore a more “normal” situation, the K1 value is expected to decrease as our data showed.
However, if the tumor has a K1 value for the therapeutic agent that decreases less from S1→S2, then the patient is expected to be a long-term survivor as the intra-cellular concentration of the drug is, on average, higher in patients with a favorable outcome. For the short-term survivors, the tumors have probably figured out how to get rid of the toxins (and 18F-FLT) by pumping them out or preventing them from entering the cell [thus, ΔK1 (S1→S2) decreases more]. In the above, it is assumed that changes in the transport rate constant K1, as measured by 18F-FLT, is similar for the chemotherapeutical agent. This assumption is based on previous studies which have shown that certain multidrug transporters in the BBB (e.g., MRP4 and BCRP) are known to transport camptothecin derivatives (such as irinotecan) and some nucleoside analogs like AZT and FLT (33, 34). The net effect on refractory tumors is that the initially observed change in Ki (from S1→S2) returns to its baseline value for the third study S3, whereas the patients who benefit from the therapy show a further decrease in Ki.
It is important to note that discriminant analysis can be determined at 6 weeks after the start of treatment, which can be months to over a year before final outcome. This offers the possibility that 18F-FLT PET could replace PFS as a surrogate end point for OS, considered the gold standard primary efficacy end point. However, further prospective studies would be needed to confirm this assertion. The results of this study show that kinetic modeling in PET can extract important molecular and biochemical information inherent to the tumor, which can be used to reliably distinguish patients who will respond favorably to a certain therapy (long-term survivors) from those who will not (short-term survivors).
In this patient population, changes in a single parameter, whether incorporated into a discriminant function as the sole predictor variable or using a more than 25% reduction criterion in the case of SUV, did not accurately classify patients into their known OS groups (hit-ratios ≤ 78%). The reason for this is that there is less information about the tumor biology using just one parameter change. A recent study (10) showed that a special subgroup of long-term survivors (n = 5) was found within their patient sample (n = 15) in which the SUV(early and late) for every patient in that group dropped by more than 25% [JCO 2007 criterion (11)] from S1→S2 and S1→S3. However, these single parameter changes (used in and of themselves) also misclassified the short-term survivors in their study (10), which is a situation that one may not be willing to tolerate. In contrast to these results, this paper shows that the misclassification error of the short-term survivors is greatly reduced when a select group of kinetic parameter changes are utilized in a linear discriminant function. By including more biological information about the tumor, the discriminant function provides greater confidence in the survival (and therefore treatment response) prediction for each patient.
Unlike the JCO paper (11), no PET criterion was defined beforehand to categorize the patient's response to treatment. Our current study dealt with outcome analysis. The OS of the patients was used to categorize the data. SUV and kinetic information could also be integrated in the discriminant function analysis. Our study was different from the NCI-sponsored trial (5) as well. In their study, no statistical tool or criterion was provided to predict OS or PFS. Their main focus was using baseline 18F-FLT kinetic parameters to distinguish recurrence from radiation necrosis. The treatment administered after the single 18F-FLT PET scan in the NCI trial was also different from our study.
Other investigators have similarly used advanced imaging and quantitative techniques to assess treatment response in patients with glioma. Studies from Galldiks et al. and Wyss et al. showed that after temozolomide chemotherapy, PET imaging with 11C-MET and 18F-labeled O-(2) fluoro-ethyl-L-tyrosine (FET) could detect response after 3 months in high-grade and low-grade gliomas (12, 14). From these findings, the deactivation of amino acid transport seemed to be an early indicator of chemotherapy response. Pope et al. (15) reported that for 41 bevacizumab-treated patients with recurrent GBM, apparent diffusion coefficient histogram analysis on “pre-treatment” diffusion-weighted MRI was able to predict a 6 month PFS or greater with 73% accuracy.
This was a small exploratory study with limitations. For example, the discriminant function used to predict OS group membership required kinetic information extracted from three dynamic PET studies. This may be inconvenient for the patient. If two imaging studies are done rather than three, the hit-ratio would drop from 100% to 89%, with the function using changes from S1→S3 performing better than those using changes from S1→S2 or S2→S3. A larger study is warranted to confirm the predictive efficacy of the discriminant functions presented in this paper. Furthermore, it is cautioned that if the estimated discriminant functions are used to classify individuals in the future, it is important that the future sample comes from a population similar to the one the discriminant functions were computed on.
Blood metabolites were not measured in this study but corrections were applied using a model approach. Patients treated with chemotherapy may have altered liver function that could affect the metabolism of 18F-FLT. If liver function is impaired, we would overestimate the true metabolite fraction, which would lead to a higher value in Ki. Since Ki is a composite parameter, this would lead to a higher value in K1 and k3 and to a lower value in k2. Underestimation of the true metabolite fraction would have the opposite effect. Nevertheless, this is a limitation of our study that still needs to be addressed in future experiments.
The cutoff points for PFS and OS were chosen as 100 days and 1 year, respectively based on the paper of Ballman et al. (17), where it was shown that these seemed as reasonable initial cutoffs for discriminant analysis. Previous results from an analysis of twelve phase II clinical trials conducted by the North American Brain Tumor Consortium showed that progression status at 2, 4, and 6 months (measured from time of registration) predicted subsequent survival time for patients with recurrent high-grade glioma (35). In our patient population, three patients had died within 3.5 months and four had died within 6 months. The median PFS and OS for the entire sample were shown to be 3 months and 11 months, respectively. Although not performed here, discriminant functions could just as well have been computed at other PFS and OS cutoff times, providing an even clearer interval of patient survival.
Future work can extend the statistical analysis to multiple linear regression, where the inputs will still be the relative changes in 18F-FLT kinetic parameters, but the output, instead of being a dichotomous categorical variable, will now be a continuous variable (i.e., each patient will get a numerical estimate of their survival time). Multimodality imaging parameters could also be implemented as added information about the tumor biology. Although we focused on recurrent brain tumor patients with 18F-FLT PET, the same methods presented in this study can be potentially applied to other molecular imaging probes and to other types of cancers undergoing different treatments, making the future of kinetic modeling in nuclear medicine and oncology exciting and promising.
Conclusions
Discriminant analysis using changes in 18F-FLT kinetics after the start of treatment appears to be a powerful method for evaluating the efficacy of therapeutic regimens and could potentially replace PFS as a surrogate end point for OS. This is advantageous because by being able to determine whether a specific treatment is working shortly after its administration, clinicians can personalize therapy for each patient and decrease possible harmful side effects. Kinetic modeling with dynamic PET data may play an integral role in a clinician's assessment of treatment response as it can extract pharmacokinetic signatures during the initial course of therapy that can be predictive of survival.
Supplementary Material
Translational Relevance.
Conventional magnetic resonance imaging (MRI) techniques are commonly used in the diagnosis and follow-up of patients with malignant glioma. However, in many situations, changes in contrast enhancement on standard MRI do not correlate with treatment response. Advanced imaging methods are therefore needed to overcome the limitations of conventional MRI. In this positron emission tomography study, we investigated if changes in 18F-FLT kinetic parameters, at 2 weeks and 6 weeks after the start of treatment, could predict overall survival and progression-free survival in patients with recurrent malignant glioma undergoing treatment with bevacizumab and irinotecan. This article shows that when a group of optimal kinetic parameter changes are incorporated into a linear discriminant function, one could accurately classify patients into their known survival groups. This method is advantageous because by reliably identifying short-term and long-term survivors at an early-stage during therapy, clinicians can discontinue ineffective treatment strategies and switch to more advanced treatment regimens that could improve patient outcome.
Acknowledgments
We are grateful to all the patients who participated in this study as well as to their families. Additionally, the authors would like to thank David Truong, Dat Vu, and Weber Shao for their computer and database support, the UCLA Cyclotron staff for help with 18F-FLT preparation, and the UCLA Nuclear Medicine staff for assistance with PET acquisition. This work was supported by the U.S. Department of Energy contract DE-FG02-06ER64249 and the NIH grant P50 CA086306.
References
- 1.Shields AF, Grierson JR, Dohmen BM, Machulla HJ, Stayanoff JC, Lawhorn-Crews JM, et al. Imaging proliferation in vivo with [F-18]FLT and positron emission tomography. Nature medicine. 1998;4:1334–6. doi: 10.1038/3337. [DOI] [PubMed] [Google Scholar]
- 2.Bading JR, Shields AF. Imaging of cell proliferation: status and prospects. J Nucl Med. 2008;49(2):64S–80S. doi: 10.2967/jnumed.107.046391. [DOI] [PubMed] [Google Scholar]
- 3.Salskov A, Tammisetti VS, Grierson J, Vesselle H. FLT: measuring tumor cell proliferation in vivo with positron emission tomography and 3′-deoxy-3′-[18F]fluorothymidine. Seminars in nuclear medicine. 2007;37:429–39. doi: 10.1053/j.semnuclmed.2007.08.001. [DOI] [PubMed] [Google Scholar]
- 4.Ullrich R, Backes H, Li H, Kracht L, Miletic H, Kesper K, et al. Glioma proliferation as assessed by 3′-fluoro-3′-deoxy-L-thymidine positron emission tomography in patients with newly diagnosed high-grade glioma. Clin Cancer Res. 2008;14:2049–55. doi: 10.1158/1078-0432.CCR-07-1553. [DOI] [PubMed] [Google Scholar]
- 5.Spence AM, Muzi M, Link JM, O'Sullivan F, Eary JF, Hoffman JM, et al. NCI-sponsored trial for the evaluation of safety and preliminary efficacy of 3′-deoxy-3′-[18F]fluorothymidine (FLT) as a marker of proliferation in patients with recurrent gliomas: preliminary efficacy studies. Mol Imaging Biol. 2009;11:343–55. doi: 10.1007/s11307-009-0215-2. [DOI] [PMC free article] [PubMed] [Google Scholar]
- 6.Jacobs AH, Thomas A, Kracht LW, Li H, Dittmar C, Garlip G, et al. 18F-fluoro-L-thymidine and 11C-methylmethionine as markers of increased transport and proliferation in brain tumors. J Nucl Med. 2005;46:1948–58. [PubMed] [Google Scholar]
- 7.Schiepers C, Chen W, Dahlbom M, Cloughesy T, Hoh CK, Huang SC. 18F-fluorothymidine kinetics of malignant brain tumors. European journal of nuclear medicine and molecular imaging. 2007;34:1003–11. doi: 10.1007/s00259-006-0354-5. [DOI] [PubMed] [Google Scholar]
- 8.Schiepers C, Chen W, Cloughesy T, Dahlbom M, Huang SC. 18F-FDOPA kinetics in brain tumors. J Nucl Med. 2007;48:1651–61. doi: 10.2967/jnumed.106.039321. [DOI] [PubMed] [Google Scholar]
- 9.Muzi M, Spence AM, O'Sullivan F, Mankoff DA, Wells JM, Grierson JR, et al. Kinetic analysis of 3′-deoxy-3′-18F-fluorothymidine in patients with gliomas. J Nucl Med. 2006;47:1612–21. [PubMed] [Google Scholar]
- 10.Schiepers C, Dahlbom M, Chen W, Cloughesy T, Czernin J, Phelps ME, et al. Kinetics of 3′-deoxy-3′-18F-fluorothymidine during treatment monitoring of recurrent high-grade glioma. J Nucl Med. 2010;51:720–7. doi: 10.2967/jnumed.109.068361. [DOI] [PubMed] [Google Scholar]
- 11.Chen W, Delaloye S, Silverman DH, Geist C, Czernin J, Sayre J, et al. Predicting treatment response of malignant gliomas to bevacizumab and irinotecan by imaging proliferation with [18F] fluorothymidine positron emission tomography: a pilot study. J Clin Oncol. 2007;25:4714–21. doi: 10.1200/JCO.2006.10.5825. [DOI] [PubMed] [Google Scholar]
- 12.Galldiks N, Kracht LW, Burghaus L, Thomas A, Jacobs AH, Heiss WD, et al. Use of 11C-methionine PET to monitor the effects of temozolomide chemotherapy in malignant gliomas. European journal of nuclear medicine and molecular imaging. 2006;33:516–24. doi: 10.1007/s00259-005-0002-5. [DOI] [PubMed] [Google Scholar]
- 13.Chen W. Clinical applications of PET in brain tumors. J Nucl Med. 2007;48:1468–81. doi: 10.2967/jnumed.106.037689. [DOI] [PubMed] [Google Scholar]
- 14.Wyss M, Hofer S, Bruehlmeier M, Hefti M, Uhlmann C, Bartschi E, et al. Early metabolic responses in temozolomide treated low-grade glioma patients. Journal of neuro-oncology. 2009;95:87–93. doi: 10.1007/s11060-009-9896-2. [DOI] [PubMed] [Google Scholar]
- 15.Pope WB, Kim HJ, Huo J, Alger J, Brown MS, Gjertson D, et al. Recurrent glioblastoma multiforme: ADC histogram analysis predicts response to bevacizumab treatment. Radiology. 2009;252:182–9. doi: 10.1148/radiol.2521081534. [DOI] [PubMed] [Google Scholar]
- 16.Dhermain FG, Hau P, Lanfermann H, Jacobs AH, van den Bent MJ. Advanced MRI and PET imaging for assessment of treatment response in patients with gliomas. Lancet neurology. 2010;9:906–20. doi: 10.1016/S1474-4422(10)70181-2. [DOI] [PubMed] [Google Scholar]
- 17.Ballman KV, Buckner JC, Brown PD, Giannini C, Flynn PJ, LaPlant BR, et al. The relationship between six-month progression-free survival and 12-month overall survival end points for phase II trials in patients with glioblastoma multiforme. Neuro Oncol. 2007;9:29–38. doi: 10.1215/15228517-2006-025. [DOI] [PMC free article] [PubMed] [Google Scholar]
- 18.Walsh JC, Padgett HC, Ysaguirre T, inventors; Siemens Medical Solutions USA, Inc. , assignee. Method for preparing radiolabeled thymidine having low chromophoric byproducts. United States patent 7419653. 2008
- 19.Wu HM, Hoh CK, Choi Y, Schelbert HR, Hawkins RA, Phelps ME, et al. Factor analysis for extraction of blood time-activity curves in dynamic FDG-PET studies. J Nucl Med. 1995;36:1714–22. [PubMed] [Google Scholar]
- 20.Schiepers C, Hoh CK, Dahlbom M, Wu HM, Phelps ME. Factor analysis for delineation of organ structures, creation of in- and output functions, and standardization of multicenter kinetic modeling. Proceedings SPIE. 1999;3661:1343–50. [Google Scholar]
- 21.Sitek A, Di Bella EV, Gullberg GT. Factor analysis with a priori knowledge--application in dynamic cardiac SPECT. Physics in medicine and biology. 2000;45:2619–38. doi: 10.1088/0031-9155/45/9/314. [DOI] [PubMed] [Google Scholar]
- 22.Paproski RJ, Ng AM, Yao SY, Graham K, Young JD, Cass CE. The role of human nucleoside transporters in uptake of 3′-deoxy-3′-fluorothymidine. Molecular pharmacology. 2008;74:1372–80. doi: 10.1124/mol.108.048900. [DOI] [PubMed] [Google Scholar]
- 23.Muzi M, Vesselle H, Grierson JR, Mankoff DA, Schmidt RA, Peterson L, et al. Kinetic analysis of 3′-deoxy-3′-fluorothymidine PET studies: validation studies in patients with lung cancer. J Nucl Med. 2005;46:274–82. [PubMed] [Google Scholar]
- 24.Muzi M, Mankoff DA, Grierson JR, Wells JM, Vesselle H, Krohn KA. Kinetic modeling of 3′-deoxy-3′-fluorothymidine in somatic tumors: mathematical studies. J Nucl Med. 2005;46:371–80. [PubMed] [Google Scholar]
- 25.Phelps ME. PET: molecular imaging and its biological applications. New York: Springer; 2004. [Google Scholar]
- 26.Afifi AA, Clark V, May S. Computer-aided multivariate analysis. 4th. Boca Raton, Fla: Chapman & Hall/CRC; 2004. [Google Scholar]
- 27.Chan YH. Biostatistics 303. Discriminant analysis. Singapore medical journal. 2005;46:54–61. quiz 2. [PubMed] [Google Scholar]
- 28.Phelps ME. Inaugural article: positron emission tomography provides molecular imaging of biological processes. Proceedings of the National Academy of Sciences of the United States of America. 2000;97:9226–33. doi: 10.1073/pnas.97.16.9226. [DOI] [PMC free article] [PubMed] [Google Scholar]
- 29.Jain RK, di Tomaso E, Duda DG, Loeffler JS, Sorensen AG, Batchelor TT. Angiogenesis in brain tumours. Nat Rev Neurosci. 2007;8:610–22. doi: 10.1038/nrn2175. [DOI] [PubMed] [Google Scholar]
- 30.Chen YL, Eriksson S, Chang ZF. Regulation and functional contribution of thymidine kinase 1 in repair of DNA damage. J Biol Chem. 2010;285:27327–35. doi: 10.1074/jbc.M110.137042. [DOI] [PMC free article] [PubMed] [Google Scholar]
- 31.Nimmagadda S, Shields AF. The role of DNA synthesis imaging in cancer in the era of targeted therapeutics. Cancer metastasis reviews. 2008;27:575–87. doi: 10.1007/s10555-008-9148-5. [DOI] [PMC free article] [PubMed] [Google Scholar]
- 32.Goodman LS, Brunton LL, Blumenthal DK, Murri N, Hilal-Dandan R. Goodman & Gilman's The pharmacological basis of therapeutics. 12th. New York: McGraw-Hill Medical; 2011. [Google Scholar]
- 33.Szakacs G, Paterson JK, Ludwig JA, Booth-Genthe C, Gottesman MM. Targeting multidrug resistance in cancer. Nat Rev Drug Discov. 2006;5:219–34. doi: 10.1038/nrd1984. [DOI] [PubMed] [Google Scholar]
- 34.Loscher W, Potschka H. Drug resistance in brain diseases and the role of drug efflux transporters. Nat Rev Neurosci. 2005;6:591–602. doi: 10.1038/nrn1728. [DOI] [PubMed] [Google Scholar]
- 35.Lamborn KR, Yung WK, Chang SM, Wen PY, Cloughesy TF, DeAngelis LM, et al. Progression-free survival: an important end point in evaluating therapy for recurrent high-grade gliomas. Neuro Oncol. 2008;10:162–70. doi: 10.1215/15228517-2007-062. [DOI] [PMC free article] [PubMed] [Google Scholar]
Associated Data
This section collects any data citations, data availability statements, or supplementary materials included in this article.