

Abstract
Activated microglia overexpressing interleukin-1 (IL-1) are prominent neuropathological features of Alzheimer’s disease. We used computerized image analysis to determine the number of IL-1α-immunoreactive (IL-1α+) microglia in cytoarchitectonic layers of parahippocampal gyrus (Brodmann’s area 28) of Alzheimer and control patients. For cortical layers I and II, the numbers of IL-1α+ microglia were similar in Alzheimer and control patients. For layers III–VI, the numbers of IL-1α+ microglia were higher than that seen in layers I–II for both Alzheimer and control patients. Moreover, for layers III–VI, the number of IL-1α+ microglia in Alzheimer patients was significantly greater than that in control patients (relative Alzheimer values of threefold for layer III–V and twofold for layer VI; P<0.05 in each case). The cortical laminar distribution of IL-1α+ microglia in Alzheimer patients correlated with the cortical laminar distribution of β-amyloid precursor protein-immunoreactive (β-APP+) neuritic plaques found in Alzheimer patients (r=0.99, P<0.005). Moreover, the cortical laminar distribution of IL-1α+ microglia in control patients also correlated with the cortical laminar distribution of β-APP+ neuritic plaques found in Alzheimer patients (r=0.91, P<0.05). These correlations suggest that pre-existing laminar distribution patterns of IL-1α+ microglia (i.e. that seen in control patients) are important in determining the observed laminar distribution of β-APP+ neuritic plaques in Alzheimer patients. These findings provide further support for our hypothesis that IL-1 is a key driving force in neuritic plaque formation in Alzheimer’s disease.
Keywords: Alzheimer’s disease, β-amyloid precursor protein, cerebral cortical layers, interleukin-1, microglia
Introduction
Elevated tissue levels of microglia-derived IL-1 have been implicated as an important pathogenic factor in the evolution of diffuse amyloid deposits into neuritic β-amyloid plaques in Alzheimer’s disease [7,8,10]. In addition, IL-1-immunoreactive (IL-1+) microglia show characteristic distribution patterns across brain regions in Alzheimer’s disease, and these patterns correlate with regional variations in the distribution of neuritic plaques [15].
The increased numbers of intensely IL-1+ microglia in Alzheimer’s disease are largely restricted to grey matter [8,15], where there is frequent association of these cells with neuritic β-amyloid plaques [7]. Neuritic plaques show distinct laminar patterns of distribution within the neocortex in Alzheimer’s disease, being most numerous in layers III–V [2,12]. This pattern of distribution has been attributed, in part, to corticocortical projection patterns, but the correlation is weak, suggesting the involvement of other, local factors in determining the observed distribution of neuritic plaques [12].
To assess a possible role for microglia in determining the cortical laminar distribution pattern of neuritic plaques in Alzheimer’s disease, we analysed the neocortical laminar distribution of IL-1+ microglia in Alzheimer and in control patients, and we compared these distributions with the distribution of β-amyloid precursor protein-immunoreactive (β-APP+) neuritic plaques. We find that the cortical laminar distribution of β-APP+ neuritic plaques in Alzheimer’s disease is correlated both with the cortical laminar distribution of IL-1+ microglia in Alzheimer patients and with the cortical laminar distribution of IL-1+ microglia in control patients.
Materials and methods
Patient information
Temporal lobe brain tissue was obtained post-mortem from nine clinically demented patients (one female, eight male; ages 65–88; post-mortem intervals [PMI] 10 ± 7 h [mean ± SD]) with neuropathological confirmation of Alzheimer’s disease according to CERAD criteria [9]. Control tissue samples were obtained from four patients (all male, ages 61–83; PMI 5 ± 2 h) who had no clinical or pathological evidence of neurological disease. Right cerebral hemispheres were fixed for 10–14 days in phosphate-buffered 20% formalin (8% formaldehyde). Tissue blocks of hippocampus and adjacent mesial temporal cortex were obtained from coronal slices of the cerebral hemisphere at the level of the lateral geniculate body, and were embedded in paraffin. Tissue sections, 10 μm thick, were either stained with cresyl violet to identify cortical layers, or used for immunohistochemistry.
Immunohistochemistry
Single and dual immunolabelling was performed as previously described [7,11]. The primary antibodies were a rabbit anti-human IL-1α antibody (Cistron, Pine Brook, NJ, USA), diluted 1:20, and a mouse anti-human β-APP antibody (Boehringer-Mannheim Biochemica, Indianapolis, IN, USA), diluted 1:10. The diluted antibodies were incubated on the tissue sections overnight at room temperature. Most IL-1α+ cells were identified as microglia based on their morphology and the fact that the majority were distinct from astrocytes immunoreactive for glial fibrillary acidic protein. In addition, these IL-1α+ cells bind lectin and lack neuron markers (neurofilaments) and oligodendrocyte markers (myelin basic protein).
Image analysis
Sections adjacent to those used for immunoreactions were stained with the Nissl technique (cresyl violet), and cytoarchitectonic layers in parahippocampal cortex (Brodmann’s area 28) were identified (Figure 1a). For the area chosen for analysis the cortical thicknesses were very uniform (1237 ± 39 μm [mean ± SD] for Alzheimer’s disease and 1241 ± 19 μm for controls). The distances of the various cytoarchitectonic layers from the pial surface was determined and used to identify these layers in the corresponding immunoreacted sections. Microscopical images of selected cortical fields (0.14 mm2/field) in immunoreacted tissue sections were captured using a CCD video camera attached to a Macintosh computer and were analysed using NIH image software (version 1.55). For these measurements, 256 grey levels were used at a resolution of 320×430 pixels, the background was subtracted, and noise was reduced.
Figure 1.

Full thickness cortical photomicrographs and computer generated images of Brodmann’s area 28 in Alzheimer’s disease showing laminar distributions of interleukin-1α-immunoreactive (IL-1α+) microglia and of β-amyloid precursor protein-immunoreactive (β-APP+) neuritic plaques. a, Nissl stain showing cytoarchitectonic layers. b, IL-1α immunohistochemistry of adjacent section showing laminar distribution of IL-1α+ microglia. c, Computer-generated depiction of the laminar distribution of IL-1α+ microglia (*) identified in b. d, β-APP immunohistochemistry of adjacent section showing laminar distribution of βAPP+ neuritic plaques. e, Computer-generated depiction of the laminar distribution of β-APP+ neuritic plaques (
 ) identified in d (the size of connotes the size of the βAPP+ neuritic plaques). Bars = 75 μm.
Statistical analysis
A 2-way ANOVA with one repeated measure, followed by Fisher’s test, was used to assess the significance of differences between numbers of IL-1α+ microglia in different cortical layers in Alzheimer’s disease, and between numbers of IL-1α+ microglia in Alzheimer and control tissue. Correlations between the numbers of IL-1α+ microglia in Alzheimer and control patients and the numbers of β-APP+ neuritic plaques in cortical layers in Alzheimer patients were assessed for significance using the non-parametric test of Spearman. In addition, correlations between the laminar distributions of IL-1α+ microglia and of β-APP+ neuritic plaques were assessed using regression analysis (see Figure 4).
Figure 4.

Correlations between the laminar distribution of IL-1α+ microglia in Alzheimer’s disease (AD) and the laminar distribution of β-APP+ neuritic plaques a, in Alzheimer’s disease and b, between the laminar distribution of IL-1α+ microglia in controls (note difference in scale) and the laminar distribution of β-APP+ neuritic plaques in Alzheimer’s disease. The distribution of βAPP+ neuritic plaques in Alzheimer patients was significantly correlated with the distribution of IL-1α+ microglia in both Alzheimer (r = 0.99, P < 0.005) and control (r = 0.91, P < 0.05) patients. Roman numerals indicate cerebral cortical cytoarchitectonic layers. Values expressed as mean ± SEM.
Results
Cortical laminar distribution of IL–1α+ microglia in control and Alzheimer tissue
Cresyl violet-stained sections were used to identify the six cortical layers (Figure 1a). In adjacent, immunoreacted sections of Alzheimer cortex, IL-1α+ microglia were found primarily in layers III–V (Figure 1b). These microglia were activated, i.e. enlarged and highly IL-1α-immunoreactive (Figure 2). There were significantly greater numbers of these microglia in layers III–VI of Alzheimer tissue than in layers I or II (Figure 1c, Figure 3). In addition, the IL-1α+ microglia present in control tissue were smaller and less intensely immunoreactive than those in Alzheimer tissue (Figure 2). A similar pattern of distribution was seen in control patients although the absolute number of microglia was significantly less than that in Alzheimer patients for layers III–VI. In contrast, the numbers of IL-1α+ microglia in layers I–II of controls were not significantly different from those of Alzheimer patients (Figure 3).
Figure 2.

Photomicrographs showing IL-1α+ microglia in cerebral cortical layer III of control (a,b) and in Alzheimer (AD) tissue (c,d). Sparse, small, weakly immunoreactive microglia are present in the control tissue while prominent, enlarged, intensely IL-1α+ microglia are found in Alzheimer tissue. Bar = 15 μm.
Figure 3.
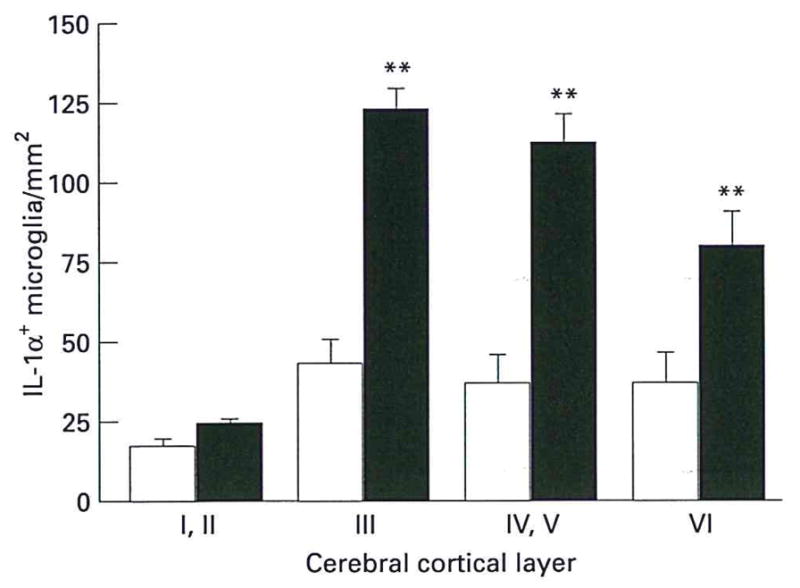
Numbers of IL-1α+ microglia in cerebral cortical layers of Alzheimer (filled bar) and control (open bar) patients, as determined by computerized image analysis. Starred values are significantly different from corresponding control values (P < 0.05). Values expressed as mean ± SEM.
Correlations between the laminar distributions of IL–1α+ microglia and of β–APP+ neuritic plaques in Alzheimer’s disease
The frequency of β-APP+ neuritic plaques in Alzheimer’s disease varied among architectonic layers (Figure 1d,e). Counts of individual plaques showed 3 ± 1, 23±4, 20 ± 2, and 14 ± 2 β-APP+ neuritic plaques/mm2 in layers I–II, III, IV–V, and VI, respectively. The numbers of β-APP+ neuritic plaques in layers III–VI were significantly greater than those in layers I and II (P<0.003 or better). The laminar distribution of IL-1α+ microglia in Alzheimer’s disease correlated significantly with the laminar distribution of β-APP+ neuritic plaques in Alzheimer’s disease (r=0.99, P=0.004; Figure 4a).
Correlation between the laminar distributions of IL–1α+ microglia in controls and of β–APP+ neuritic plaques in Alzheimer’s disease
The laminar distribution of IL-1α+ microglia in control patients showed a significant correlation with the laminar distribution of β-APP+ neuritic plaques in Alzheimer’s disease (r=0.91, P<0.05; Figure 4b).
Discussion
Our finding of a correlation between the cortical laminar distributions of IL-1+ microglia and β-APP+ neuritic plaques in Alzheimer’s disease is consistent with a role for IL-1 in neuritic plaque formation. We have previously shown that IL-1+ microglia are differentially distributed across brain regions, and that this distribution correlates with regional patterns of neuritic plaque distribution in Alzheimer’s disease [15]. IL-1 is overexpressed by activated, plaque-associated microglia early in plaque development, suggesting a seminal role for IL-1 in neuritic plaque formation [7]. IL-1 promotes β-APP expression [3,6] and processing [1] in neurons. Furthermore, IL-1 promotes astrocyte activation [4,5] and astrocytic overexpression of S100β [13]. S100β, in turn, has been implicated in the formation of dystrophic neurites, overexpressing β-APP, in amyloid deposits in Alzheimer’s disease [11,14].
Neuritic plaques in Alzheimer’s disease show a characteristic distribution pattern across cerebral cortical architectonic layers that reflects the projection fields of corticocortical neurons [12]. The correlation between this plaque distribution pattern and the corticocortical projection fields is, however, weak, suggesting that additional, local factors influence the cerebral cortical laminar distribution of neuritic plaques. Our finding of a correlation between the laminar distribution of β-APP+ neuritic plaques in Alzheimer patients and the laminar distribution of IL-1+ microglia in control patients suggests that the cerebral cortical laminar distribution of IL-1+ microglia may be the local pathogenic factor that acts in concert with corticocortical projection field patterns to determine the cortical laminar distribution of β-APP+ neuritic plaques in Alzheimer’s disease.
Acknowledgments
The authors thank S. Woodward and Xue Q. Zhou for their skilled technical assistance. This research was supported in part by NIH AG12411, AG 10208, and NS 27414.
References
- 1.Buxbaum JD, Oishi M, Chen HI, et al. Cholinergic agonists and interleukin 1 regulate processing and secretion of the Alzheimer β/A4 amyloid protein precursor. Proc Natl Acad Sci USA. 1992;89:10075–8. doi: 10.1073/pnas.89.21.10075. [DOI] [PMC free article] [PubMed] [Google Scholar]
- 2.Clinton J, Roberts GW, Gentleman SM, Royston MC. Differential pattern of β-amyloid protein deposition within cortical sulci and gyri in Alzheimer’s disease. Neuropathol Appl Neurobiol. 1993;19:277–81. doi: 10.1111/j.1365-2990.1993.tb00438.x. [DOI] [PubMed] [Google Scholar]
- 3.Forloni G, Demicheli F, Giorgi S, Bendotti C, Angeretti N. Expression of amyloid precursor protein mRNAs in endothelial, neuronal and glial cells: modulation by interleukin-1. Molec Brain Res. 1992;16:128–34. doi: 10.1016/0169-328x(92)90202-m. [DOI] [PubMed] [Google Scholar]
- 4.Giulian D, Lachman LB. Interleukin-1 stimulation of astroglial proliferation after brain injury. Science. 1985;228:497–9. doi: 10.1126/science.3872478. [DOI] [PubMed] [Google Scholar]
- 5.Giulian D, Woodward J, Young DG, Krebs JF, Lachman LB. Interleukin-1 injected into mammalian brain stimulates astrogliosis and neovascularization. J Neurosci. 1988;8:2485–90. doi: 10.1523/JNEUROSCI.08-07-02485.1988. [DOI] [PMC free article] [PubMed] [Google Scholar]
- 6.Goldgaber D, Harris HW, Hla T, et al. Interleukin 1 regulates synthesis of amyloid β-protein precursor mRNA in human endothelial cells. Proc Natl Acad Sci USA. 1989;86:7606–10. doi: 10.1073/pnas.86.19.7606. [DOI] [PMC free article] [PubMed] [Google Scholar]
- 7.Griffin WST, Sheng JG, Roberts GW, Mrak RE. Interleukin-1 expression in different plaque types in Alzheimer’s disease, significance in plaque evolution. J Neuropathol Exp Neurol. 1995;54:276–81. doi: 10.1097/00005072-199503000-00014. [DOI] [PubMed] [Google Scholar]
- 8.Griffin WST, Stanley LC, Ling C, et al. Brain interleukin-1 and S100 immunoreactivity are elevated in Down Syndrome and Alzheimer disease. Proc Natl Acad Sci USA. 1989;86:7611–5. doi: 10.1073/pnas.86.19.7611. [DOI] [PMC free article] [PubMed] [Google Scholar]
- 9.Mirra SS, Heyman A, McKeel D, et al. The consortium to establish a registry for Alzheimer’s disease (CERAD). Part II. Standardization of the neuropathological assessment of Alzheimer’s disease. Neurology. 1991;41:479–86. doi: 10.1212/wnl.41.4.479. [DOI] [PubMed] [Google Scholar]
- 10.Mrak RE, Sheng JG, Griffin WST. Glial cytokines in Alzheimer’s disease. Review and pathogenic implications. Hum Pathol. 1995;226:816–23. doi: 10.1016/0046-8177(95)90001-2. [DOI] [PMC free article] [PubMed] [Google Scholar]
- 11.Mrak RE, Sheng JG, Griffin WST. Correlation of astrocytic S100β expression with dystrophic neurites in amyloid plaques of Alzheimer’s disease. J Neuropathol Exp Neurol. 1996;55:273–9. doi: 10.1097/00005072-199603000-00002. [DOI] [PMC free article] [PubMed] [Google Scholar]
- 12.Rogers J, Morrison JH. Quantitative morphology and regional and laminar distributions of senile plaques in Alzheimer’s disease. J Neurosci. 1985;5:2801–8. doi: 10.1523/JNEUROSCI.05-10-02801.1985. [DOI] [PMC free article] [PubMed] [Google Scholar]
- 13.Sheng JG, Ito K, Skinner RD, et al. In vivo and in vitro evidence supporting a role for the inflammatory cytokine interleukin-1 as a driving force in Alzheimer pathogenesis. Neurobiol Aging. 1996;17:761–6. doi: 10.1016/0197-4580(96)00104-2. [DOI] [PMC free article] [PubMed] [Google Scholar]
- 14.Sheng JG, Mrak RE, Griffin WST. S100β protein expression in Alzheimer disease: potential role in the pathogenesis of neuritic plaques. J Neurosci Res. 1994;39:398–404. doi: 10.1002/jnr.490390406. [DOI] [PubMed] [Google Scholar]
- 15.Sheng JG, Mrak RE, Griffin WST. Microglial interleukin-1α expression in brain regions in Alzheimer’s disease: Correlation with neuritic plaque distribution. Neuropathol Appl Neurobiol. 1995;21:290–301. doi: 10.1111/j.1365-2990.1995.tb01063.x. [DOI] [PubMed] [Google Scholar]