

Abstract
Purpose
To demonstrate a multi-atlas segmentation approach to facilitating accurate and consistent delineation of low-contrast brachial plexuses on CT images for lung cancer radiotherapy.
Materials and Methods
We retrospectively identified 90 lung cancer patients with treatment volumes near the brachial plexus. Ten representative patients were selected to form an atlas group, and their brachial plexuses were delineated manually. We used deformable image registration to map each atlas brachial plexus to the remaining 80 patients. In each patient, a composite contour was created from 10 individual segmentations using the Simultaneous Truth and Performance Level Estimation (STAPLE) algorithm. This auto-delineated contour was reviewed and modified appropriately for each patient. We also performed 10 leave-one-out tests using the 10 atlases to validate the segmentation accuracy and demonstrate the contouring consistency using multi-atlas segmentation.
Results
The multi-atlas segmentation took less than 2 minutes to complete. Contour modification took 5 minutes compared with 20 minutes for manual contouring from scratch. The multi-atlas segmentation from the 10 leave-one-out tests had a mean 3D volume overlap of 59.2% ± 8.2% and a mean 3D surface distance of 2.4 mm ± 0.5 mm. The distances between the individual and average contours in the 10 leave-one-out tests demonstrated much better contouring consistency for modified contours than for manual contours. The auto-segmented contours did not require substantial modification, demonstrated by the good agreement between the modified and auto-segmented contours in the 80 patients. Dose volume histograms of auto-segmented and modified contours were also in good agreement, showing that editing auto-segmented contours is clinically acceptable in view of the dosimetric impact.
Conclusions
Multi-atlas segmentation greatly reduced contouring time and improved contouring consistency. Editing auto-segmented contours to delineate the brachial plexus proved to be a better clinical practice than manually contouring from scratch.
Keywords: brachial plexus, multi-atlas segmentation, deformable image registration, STAPLE
Introduction
The brachial plexus is an important organ-at-risk (OAR) in patients with lung or head and neck cancer who undergo intensity-modulated radiotherapy (IMRT). Radiotherapy-induced brachial plexopathy, although rare, can be very debilitating and difficult to treat; its onset is often rapid and may be irreversible. Dose delivered to this structure is critical, as recent studies have shown the correlation between dose escalation and brachial plexopathy. In general, most studies recommended keeping the maximum dose to the brachial plexus under 66 Gy, as side effects are severe and irreversible. Consensus contouring guidelines for the brachial plexus were only recently been published in two studies: one for head and neck cancer 2 and the other for thoracic cancer radiotherapy. 5 Nevertheless, the contouring process remains challenging. At most institutions, radiation treatment plans are based on non-contrast computed tomography (CT) images, making structures such as the brachial plexus very difficult to contour. Although the brachial plexus is visible on magnetic resonance (MR) images, 6 this image modality is usually unavailable for lung cancer treatment planning. The complicated routing of the brachial plexus also presents a challenge in contouring on axial slices. In addition, the anatomical variation and degree of mobility in this region of the body present further challenges for physicians and physicists when defining this critical structure prior to treatment. Therefore, manual contouring of the brachial plexus is a difficult process that requires clinical knowledge, time, and effort. Furthermore, manual contouring can be unreliable because of substantial observer variability, 7 especially for structures with inadequate image contrast like the brachial plexus.
Automatic segmentation has been shown as an effective tool in reducing contouring time and improving contouring consistency. 8–10 Recently, researchers developed auto-segmentation methods using multiple atlases to minimize the effects of observer variability. 11–14 The goal of these methods is to exploit the statistical information in the contoured atlas data for auto-segmentation of new patient images. Deformable image registration 15 is an important tool for mapping contours from atlases to new patients. The individual deformed contours from multiple atlases are then effectively combined to produce the best approximate to the true segmentation through various fusion approaches. 16–18
In this retrospective study, we implemented and evaluated automatic segmentation of the brachial plexus in 90 lung cancer patients using a multi-atlas approach. We first validated the accuracy of multi-atlas segmentation and compared it with that of single-atlas segmentation to show the importance of using multiple atlases. More importantly, we demonstrated that editing auto-segmented contours is a better clinical practice in terms of both time savings and contouring consistency than is manual contouring from scratch.
Materials and methods
Patient Data
Patients with unresectable non-small cell lung cancer (NSCLC) treated with definitive chemoradiation were retrospectively identified from an institutional database. We selected 90 patients with superior sulcus tumors or tumors involving the upper mediastinum or supraclavicular region who had received a dose of at least 55 Gy to 0.1 cm3 of the brachial plexus. Additional inclusion criteria were having at least 4 months of follow-up and having had either photon or proton therapy with IMRT. This study was approved by the institutional review board.
Treatment simulation and delivery had been performed with patients’ arms above their heads. Most of the patients underwent 4-dimensional (4D) CT scanning to account for respiratory motion. CT images were acquired first while the patients were free-breathing, with 4D images acquired immediately thereafter. The median dose to the target was 70 Gy (range: 56.0–87.5 Gy), and the median fraction dose was 2.0 Gy (range: 1.8–2.5 Gy). Margins were defined by the planning target volume (PTV) with 0.5cm to 1.0 cm expansion from the clinical target volume (CTV), which was typically equal to the gross tumor volume (GTV). All 90 simulation CT images had an in-slice resolution of 1.0 mm and slice spacing of 2.5 mm. Patients were ranked by their body mass index (BMI) and their height respectively. Five patients were selected from the BMI-ranked group and the other five patients were selected from the height-ranked group in order to represent various body and skeleton sizes. These 10 patients were also ensured to have good image quality and no abnormal anatomic representations owing to peculiar arm position or tumor invasion.
The brachial plexus contours of these 10 patients were delineated manually using Pinnacle Treatment Planning System (Philips Medical Systems, Bothell, WA), with the help of the published consensus guidelines and Netter’s Atlas of Human Anatomy 19. We identified C5 through T1 roots, which served as the medial borders of the brachial plexus. Also, the anterior and middle scalene muscles were used as landmarks, and the brachial plexus was contoured medially to laterally between these muscles. The superior border of the brachial plexus was defined as the neural foramina at C5 where the nerve was traced as it exited the foramina. Where no foramen was present, only the regions between the scalene muscles were contoured. Using the clavicle and first rib as landmarks, we used bony anatomy and the subclavian bundle to draw the brachial plexus distally. The inferior and lateral borders of the plexus terminated with the subclavian vascular bundle. The contours were drawn jointly by two thoracic radiation oncologists together in the same room so as each of the manual contours were reviewed by both oncologists. One thoracic radiologist, who specializes in thoracic radiology, was physically present at the time of contouring to review these manual contours. These 10 CT images and the manual contours constituted the atlases for automatic segmentation of the brachial plexus for the rest of 80 patients.
Multi-atlas segmentation
We developed a multi-atlas segmentation approach to automatically delineate the brachial plexus contours for the remaining 80 patients (Figure 1). The 10 atlases were applied separately to register the 80 patients using a deformable image registration algorithm. 15 We performed a rigid alignment as a preliminary step to minimize the global positional difference. The resultant displacement fields that characterized the individual deformable registrations were used to deform the brachial plexus contours in each atlas to obtain 10 individual segmentations for each patient. Finally, we used the Simultaneous Truth and Performance Level Estimation (STAPLE) algorithm 16 to combine the 10 individual segmentations. The STAPLE algorithm estimates a true segmentation and characteristic parameters describing the agreement between individual segmentations and the true segmentation simultaneously. Essentially, an Expectation-Maximization algorithm20 is used in the STAPLE algorithm by iterating an E-step, computing the expected value of the true segmentation and a log-likelihood function, and an M-step, estimating the characteristic parameters by maximizing the log-likelihood function. The output of the STAPLE algorithm is a fusion contour approximating the true segmentation. The contour fusion process allows us to minimize variations among segmentations obtained from different atlases and random errors in deformable image registration.
Figure 1.

The overall framework of multi-atlas segmentation for the brachial plexus. The three major components of the segmentation process are deformable registration, contour mapping, and contour fusion.
Quantitative evaluation metrics
The Hausdorff distance (HD) was used to measure the maximum Euclidean distance from point in one contour (R) to the nearest point in another contour (T) as
We evaluated this distance in 2D axial slices to highlight the locoregional differences. A large HD value indicated poor agreement of two contours in a CT slice. We also calculated the Dice similarity coefficient (DSC) for two volumes R and T, which was defined as the ratio of the volume of their intersection to their mean volume:
The DSC has a value between 0 and 1, with 1 indicating perfect agreement and 0 indicating no overlap. We used it to evaluate both 2D axial slices and 3D volume. In addition, we calculated a symmetric 3D mean surface distance (MSD) between two volumes R and T using the Euclidean distance mapping method 21:
Validation of multi-atlas segmentation
To validate the multi-atlas segmentation, we performed 10 leave-one-out tests on the 10 atlas patients. In each test, one patient was used as the test patient and the remaining nine patients were used as atlases to perform multi-atlas segmentation. We calculated the 3D-DSC and 3D-MSD between the manual and auto-segmented contours in the 10 tests. In addition, we compared the multi-atlas segmentation with the single-atlas segmentation using the best single registration result in the multi-atlas segmentation to demonstrate the necessity of using multiple atlases.
Modified contours versus manual contours
The auto-segmented contours in the multi-atlas segmentation were reviewed and modified jointly by two thoracic radiation oncologists to produce a set of clinically acceptable contours. We recorded the time required to modify the contours and compared it with the time required to manually contour the brachial plexus. In each of the 10 leave-one-out tests, the modified contours of the 9 atlases were mapped to the test patient using the deformation fields generated by deformable registrations in the multi-atlas segmentation. “Average” contours, representing the consensus of more than 4 individual contours, were constructed for both 9 deformed manual contours and 9 modified contours using the majority voting fusion technique. They were used to evaluate the variations among individual contours in different atlases to show the contouring consistency. We computed the means and standard deviations of 3D-DSC and 3D-MSD between the individual contours and the average contours in both cases for comparison.
Evaluation in 80 patients
We applied the multi-atlas segmentation to automatically delineate the brachial plexus in the remaining 80 patients. The resulting auto-segmented contours were reviewed and modified jointly by two thoracic radiation oncologists. We calculated the 2D-HDs and 2D-DSCs between modified and auto-segmented contours in all axial slices for each patient and used the median 2D-HD and 2D-DSC values as the assessment for each patient. We also calculated the 3D-DSCs and 3D-MSDs between the modified and auto-segmented contours. These values showed how much corrections were needed for the auto-segmented contours for clinical use. In addition, we calculated the dose volume histograms of the brachial plexuses in the 80 patients for the auto-segmented and modified contours. We then determined the correlations between the doses in modified contours and those in auto-segmented contours at 10%, 20%, 50%, and 90% of the brachial plexus volume for the 80 patients.
Results
Multi-atlas segmentation
Multi-atlas segmentation was performed on a PC with an eight-core CPU (2 Intel Xeon X5472 quad-core processors at 3GHz) and 8GB of memory. Multithread computing was enabled in this method. For single-atlas segmentation, the computation time was about 10 seconds, with a region of interest of about 250×150×50 voxels. Contour fusion required about 4 seconds. The overall segmentation time using 10 atlases for one patient was about 110 seconds.
Panel (A) of figure 2 shows the 3D surface of the brachial plexus overlaid on a digitally reconstructed radiograph. The blue one (first column) was rendered from the manual contours drawn with no reference. The red one (second column) was rendered from auto-segmented contours and the green one (third column) was rendered from modified contours. It can be observed that the modified contours and auto-segmented contours are smoother than the original manual contours at the transition between axial slices. Panel (B) of figure 2 shows the 2D contour comparison of the manual (blue), auto-segmented (red), and modified (green) contours on three representative axial slices. The auto-segmented contours were close to the manual contours; only small modifications were required to produce clinically acceptable contours.
Figure 2.
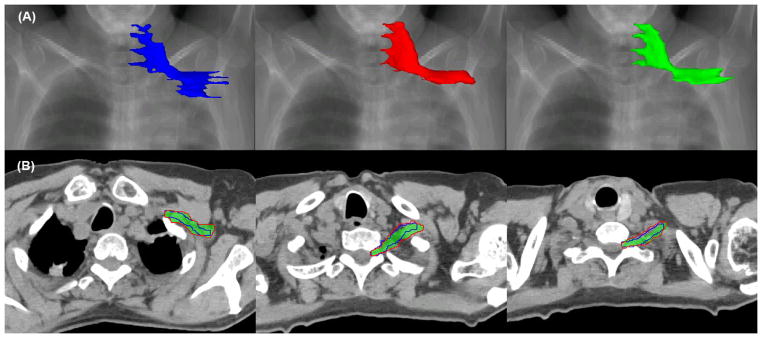
Comparison of manual (blue), auto-segmented (red), and modified (green) contours in the (A) 3D surface view and (B) 2D axial slice view.
Validation of multi-atlas segmentation
Table 1 shows the results of multi-atlas segmentation and best single-atlas segmentation in the 10 leave-one-out tests. The multi-atlas segmentation resulted in a 3D-DSC of 59.2% ± 8.2% and a 3D-MSD of 2.4 mm ± 0.5 mm, whereas the best single-atlas segmentation had a 3D-DSC of 45.3%±5.8% and a 3D-MSD of 2.9 mm ± 0.5 mm. Furthermore, the best atlases for these 10 tests were not from a same atlas. These results clearly demonstrated that no atlas can be applied universally to all patients with satisfactory segmentation accuracy. Figure 3 shows large inter-subject variability in different atlases and that the auto-segmented contour (red) produced using multi-atlas segmentation better agrees with the manual contour than does any individual contour produced using the single-atlas segmentation.
Table 1.
Results of multi-atlas segmentation compared with best single-atlas segmentation for 10 leave-one-out tests. 3D-DSC and 3D-MSD measure the difference between the auto-segmented and manual contours.
| Test no. | Multi-atlas segmentation | Best single-atlas segmentation | ||
|---|---|---|---|---|
|
| ||||
| 3D-DSC (%) | 3D-MSD (mm) | 3D-DSC (%) | 3D-MSD (mm) | |
| 1 | 67.3 | 1.6 | 51.7 | 2.6 |
| 2 | 58.8 | 2.2 | 42.3 | 2.7 |
| 3 | 64.4 | 2.0 | 45.3 | 2.7 |
| 4 | 53.6 | 3.0 | 44.4 | 3.7 |
| 5 | 65.6 | 2.0 | 47.6 | 3.5 |
| 6 | 53.2 | 2.5 | 49.6 | 2.7 |
| 7 | 41.1 | 3.1 | 34.0 | 3.3 |
| 8 | 61.3 | 2.8 | 38.0 | 3.5 |
| 9 | 59.4 | 2.7 | 50.6 | 2.5 |
| 10 | 67.2 | 2.1 | 49.3 | 2.2 |
|
| ||||
| Mean | 59.2 | 2.4 | 45.3 | 2.9 |
| SD | 8.2 | 0.5 | 5.8 | 0.5 |
Abbreviations: 3D-DSC = three-dimensional Dice similarity coefficient; 3D-MSD = three-dimensional mean surface distance; SD = standard deviation.
Figure 3.
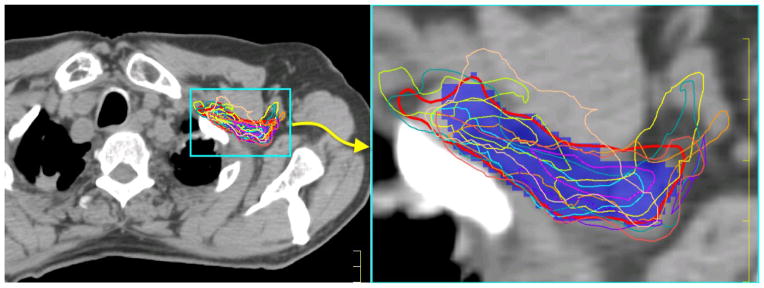
Comparison of multi-atlas segmentation and single-atlas segmentation. The blue colorwash is the original manual contour, the thick red contour is the multi-atlas segmentation, and the thin contours of various colors are nine single-atlas segmentations.
Modified contours versus manual contours
The time required to edit auto-segmented contours averaged 5 minutes per patient (range: 3–6 minutes), compared with an average of 20 minutes (range: 16–25 minutes) to manually contour the brachial plexus. Table 2 shows the 3D-DSCs and 3D-MSDs between the individual contours and the average contours in the 10 leave-one-out tests. The modified contours had 3D-DSC values ranging from 71.4% ± 3.9% to 75.6% ± 3.3% and 3D-MSD values from 1.4mm ± 0.4mm to 1.7mm ± 0.4mm, compared with those values for manual contours ranging from 45.8% ± 11.1% to 50.2% ± 13.5% and from 2.7mm ± 0.7mm to 3.5mm ± 1.3mm. These values demonstrated much better contouring consistency and less inter-subject variability with editing from auto-segmented contours than with manual contouring from scratch. This demonstrates that editing from auto-segmented contours is perhaps a better clinical practice in terms of both time savings and contouring consistency than is manual contouring from scratch.
Table 2.
Comparison of inter-subject variations for modified contours and manual contours. 3D-DSC and 3D-MSD measure the distance between 9 individual contours and the average contours.
| Test no. | Modified Contours | Manual Contours | ||
|---|---|---|---|---|
|
| ||||
| 3D-DSC (%) | 3D-MSD (mm) | 3D-DSC (%) | 3D-MSD (mm) | |
|
| ||||
| Mean ± SD | Mean ± SD | Mean ± SD | Mean ± SD | |
| 1 | 74.7 ± 6.2 | 1.6 ± 0.3 | 49.3 ± 11.8 | 3.4 ± 0.9 |
| 2 | 71.4 ± 3.9 | 1.4 ± 0.4 | 45.9 ± 10.9 | 3.0 ± 0.8 |
| 3 | 72.3 ± 5.3 | 1.6 ± 0.4 | 46.5 ± 14.2 | 3.5 ± 1.0 |
| 4 | 75.0 ± 6.9 | 1.4 ± 0.4 | 49.8 ± 10.2 | 2.7 ± 0.7 |
| 5 | 74.4 ± 7.5 | 1.6 ± 0.3 | 49.4 ± 12.1 | 3.0 ± 1.0 |
| 6 | 75.6 ± 3.3 | 1.6 ± 0.3 | 49.0 ± 12.3 | 3.3 ± 1.2 |
| 7 | 73.4 ± 8.5 | 1.5 ± 0.3 | 50.2 ± 13.5 | 3.2 ± 0.9 |
| 8 | 72.9 ± 4.7 | 1.7 ± 0.4 | 47.4 ± 10.8 | 3.3 ± 0.8 |
| 9 | 71.6 ± 6.0 | 1.4 ± 0.4 | 46.8 ± 11.2 | 3.0 ± 0.9 |
| 10 | 72.6 ± 6.4 | 1.6 ± 0.4 | 45.8 ± 11.1 | 3.5 ± 1.3 |
Abbreviations: 3D-DSC = three-dimensional Dice similarity coefficient; 3D-MSD = three-dimensional mean surface distance; SD = standard deviation.
Evaluation in 80 patients
Figure 4 shows the results of median 2D-HDs, median 2D-DSCs, 3D-MSDs, and 3D-DSCs between the modified and auto-segmented contours in the 80 patients. The mean of median 2D-HDs was 4.6 mm and that of median 2D-DSCs was 86%, which demonstrates good overlap between the modified and auto-segmented contours. Of note, about 20 of the 80 patients had a median 2D-HD of 0 (or median 2D-DSC of 100%), demonstrating that at least half of the slices in those patients required no contour modification. The good agreement between modified and auto-segmented contours is further validated by a mean 3D-MSD of 1.6 mm and 3D-DSC of 77%.
Figure 4.

Results of median 2D slice-wise Hausdorff distance (HD), median 2D slice-wise Dice similarity coefficient (DSC), 3D mean surface distance (3D-MSD), and 3D Dice similarity coefficient (3D-DSC) between modified and auto-segmented contours in the 80 patients. The horizontal line represents the mean value in these patients.
Figure 5 is a scatter plot of the dose at 10%, 20%, 50%, and 90% of the brachial plexus volume in these 80 patients. The dashed blue line indicates the linear regression of the scatter plot. This line is close to the solid red line, which denotes an equal dose to modified and auto-segmented contours. The closer the lines are to each other, the lower the impact on the dosimetric parameters. The results shown in Figure 5 demonstrated reasonable dosimetric agreement for such a small-volume structure near a dose-gradient region.
Figure 5.

Scatter plot of the dose at 10%, 20%, 50%, and 90% of the brachial plexus volume in the 80 patients. The x-axis denotes the dose to modified contours and the y-axis denotes the dose to auto-segmented contours. The dashed blue line indicates the linear regression of the scatter plot. The solid red line denotes an equal dose to modified and auto-segmented contours.
Discussion
Brachial plexus contouring on non-contrast CT continues to be challenging. In this study, we demonstrated that computer-aided auto-segmentation followed by physician editing is a more effective approach in terms of time savings and contouring consistency than traditional methods in contouring difficult structures such as the brachial plexus. Due to the nature of 3D segmentation, contours created by automatic segmentation positioned the brachial plexus in the correct location; only minor modifications were required to make them acceptable (mostly because of patient’s arm position). In the cases with invasive tumors that distorted the anatomy of the brachial plexus, more modifications were needed, but there cases were rare. Similar studies also showed that editing auto-segmented contours is an effective approach to head and neck and breast contouring.
When a structure of interest is small (such as the brachial plexus) and has low contrast, observer variations play a more important role in contouring. 22 The multi-atlas segmentation used in this study reduced inter-subject variability in brachial plexus contouring. It is a known issue that the DSC value is sensitive to the volume of the structure to be measured. When the volume is small, the DSC value may be low even if there is a small discrepancy between two volumes. For a volume with irregular and elongated shape, the discrepancy can be further exaggerated in DSC value. Considering the small volume (mean, 22.3 cm3 for the 10 atlases) and elongated shape of the brachial plexus, the 3D-DSC of 59.2% ± 8.2% for multi-atlas segmentation could be regarded as a good volume agreement.
We applied this multi-atlas segmentation technique to a retrospective study to analyze the dose response for brachial plexopathy. The clinical results are reported by Amini, et al 4. We also developed a software tool for this multi-atlas segmentation technique and put it into clinical use in our institution to automatically contour the brachial plexus. The goal of this paper is to present the underlying technical implementation and validation of multi-atlas segmentation and prove its benefits in clinical practice.
We observed that patient’s arm position can substantially affect the shape and direction of the brachial plexus on CT images. Most of the disagreements in the deformed contours occurred when the arm position was different from the individual atlas. Multi-atlas segmentation can minimize the impact of arm position; however, it still requires individual’s attention to make them more accurate.
We have shown that multi-atlas segmentation was able to reduce inter-subject variability and that editing from the auto-segmented contours was able to improve contouring consistency. The results shown in Table 2 also imply the improved intra-observer variability when editing from the auto-segmented contours. Nevertheless, direct evidence supporting improved intra- or inter-observer variability with the use of multi-atlas segmentation is still lacking. More constructive experiments are needed to demonstrate this point, and this will be our future study.
Atlas creation is an important consideration in multi-atlas segmentation. In current practice, atlas creation is performed offline by physicists and scientists with manual reviews of patient data and CT images. Atlas selection criteria included patient characteristics such as age, weight, height, and CT image quality, such as no obvious anatomic variations or significant artifacts or noise in the regions of interest. Online automatic atlas selection is possible, provided that an atlas database is available and that a rapid matching algorithm can select optimal atlas candidates on the fly. It is still unknown how much benefit an online atlas selection process will provide, which will be a subject of our future study.
Conclusions
In conclusion, we demonstrated that multi-atlas segmentation can be effectively used to delineate the brachial plexus on CT images. We validated the accuracy of multi-atlas segmentation and demonstrated its potential benefits in clinical practice. Also, we showed that editing from auto-segmented contours may be a better clinical practice than manual contouring from scratch in terms of both time savings and contouring consistency.
Acknowledgments
The authors would like to thank Ann M. Sutton and Don Norwood from the Department of Scientific Publication for reviewing the manuscript. This work was made possible through the generosity of the family of M. Adnan Hamed to the MD Anderson Thoracic Radiation Oncology program, a grant from Varian Medical Systems, and the MD Anderson Cancer Center support grant CA016672.
Footnotes
Conflict of Interest: The authors declare no conflicts of interest.
Publisher's Disclaimer: This is a PDF file of an unedited manuscript that has been accepted for publication. As a service to our customers we are providing this early version of the manuscript. The manuscript will undergo copyediting, typesetting, and review of the resulting proof before it is published in its final citable form. Please note that during the production process errors may be discovered which could affect the content, and all legal disclaimers that apply to the journal pertain.
References
- 1.Schierle C, Winograd JM. Radiation-Induced Brachial Plexopathy: Review. Complication Without a Cure. J reconstr Microsurg. 2004;20:149–152. doi: 10.1055/s-2004-820771. [DOI] [PubMed] [Google Scholar]
- 2.Hall WH, Guiou M, Lee NY, et al. Development and Validation of a Standardized Method for Contouring the Brachial Plexus: Preliminary Dosimetric Analysis Among Patients Treated With IMRT for Head-and-Neck Cancer. International Journal of Radiation Oncology*Biology*Physics. 2008;72:1362–1367. doi: 10.1016/j.ijrobp.2008.03.004. [DOI] [PubMed] [Google Scholar]
- 3.Eblan MJ, Corradetti MN, Lukens JN, et al. Brachial Plexopathy in Apical Non-Small Cell Lung Cancer Treated With Definitive Radiation: Dosimetric Analysis and Clinical Implications. International Journal of Radiation Oncology*Biology*Physics. 2013;85:175–181. doi: 10.1016/j.ijrobp.2012.03.051. [DOI] [PubMed] [Google Scholar]
- 4.Amini A, Yang J, Williamson R, et al. Dose constraints to prevent radiation-induced brachial plexopathy in patients treated for lung cancer. Int J Radiat Oncol Biol Phys. 2012;82:e391–e398. doi: 10.1016/j.ijrobp.2011.06.1961. [DOI] [PMC free article] [PubMed] [Google Scholar]
- 5.Kong F-M, Ritter T, Quint DJ, et al. Consideration of Dose Limits for Organs at Risk of Thoracic Radiotherapy: Atlas for Lung, Proximal Bronchial Tree, Esophagus, Spinal Cord, Ribs, and Brachial Plexus. International Journal of Radiation Oncology*Biology*Physics. 2010 doi: 10.1016/j.ijrobp.2010.07.1977. [DOI] [PMC free article] [PubMed] [Google Scholar]
- 6.Truong MT, Nadgir RN, Hirsch AE, et al. Brachial Plexus Contouring with CT and MR Imaging in Radiation Therapy Planning for Head and Neck Cancer. RadioGraphics. 2010;30:1095–1103. doi: 10.1148/rg.304095105. [DOI] [PubMed] [Google Scholar]
- 7.Collier DC, Burnett SS, Amin M, et al. Assessment of consistency in contouring of normal-tissue anatomic structures. Journal of Applied Clinical Medical Physics. 2003;4:17–24. doi: 10.1120/jacmp.v4i1.2538. [DOI] [PMC free article] [PubMed] [Google Scholar]
- 8.Reed VK, Woodward WA, Zhang L, et al. Automatic Segmentation of Whole Breast Using Atlas Approach and Deformable Image Registration. International Journal of Radiation Oncology*Biology*Physics. 2009;73:1493–1500. doi: 10.1016/j.ijrobp.2008.07.001. [DOI] [PMC free article] [PubMed] [Google Scholar]
- 9.Chao KSC, Bhide S, Chen H, et al. Reduce in Variation and Improve Efficiency of Target Volume Delineation by a Computer-Assisted System Using a Deformable Image Registration Approach. International Journal of Radiation Oncology*Biology*Physics. 2007;68:1512–1521. doi: 10.1016/j.ijrobp.2007.04.037. [DOI] [PubMed] [Google Scholar]
- 10.Wang H, Garden AS, Zhang L, et al. Performance Evaluation of Automatic Anatomy Segmentation Algorithm on Repeat or Four-Dimensional Computed Tomography Images Using Deformable Image Registration Method. International Journal of Radiation Oncology*Biology*Physics. 2008;72:210–219. doi: 10.1016/j.ijrobp.2008.05.008. [DOI] [PMC free article] [PubMed] [Google Scholar]
- 11.Yang J, Zhang Y, Zhang L, et al. Automatic Segmentation of Parotids from CT Scans Using Multiple Atlases. MICCAI Workshop - Head & Neck Autosegmentation Challenge. 2010:323–330. [Google Scholar]
- 12.Ramus L, Malandain G. Multi-atlas Based Segmentation: Application to the Head and Neck Region for Radiotherapy Planning. MICCAI Workshop - Head & Neck Autosegmentation Challenge 2010. 2010:281–288. [Google Scholar]
- 13.Chen A, Niermann KJ, Deeley MA, et al. Evaluation of multiple-atlas-based strategies for segmentation of the thyroid gland in head and neck. Physics in medicine and biology. 2012;57:93–111. doi: 10.1088/0031-9155/57/1/93. [DOI] [PMC free article] [PubMed] [Google Scholar]
- 14.Klein S, van der Heide UA, Lips IM, et al. Automatic segmentation of the prostate in 3D MR images by atlas matching using localized mutual information. Medical Physics. 2008;35:1407–1417. doi: 10.1118/1.2842076. [DOI] [PubMed] [Google Scholar]
- 15.Wang H, Dong L, Lii MF, et al. Implementation and validation of a three-dimensional deformable registration algorithm for targeted prostate cancer radiotherapy. International Journal of Radiation Oncology*Biology*Physics. 2005;61:725–735. doi: 10.1016/j.ijrobp.2004.07.677. [DOI] [PubMed] [Google Scholar]
- 16.Warfield SK, Zou KH, Wells WM. Simultaneous truth and performance level estimation (STAPLE): an algorithm for the validation of image segmentation. IEEE Transactions on Medical Imaging. 2004;23:903–921. doi: 10.1109/TMI.2004.828354. [DOI] [PMC free article] [PubMed] [Google Scholar]
- 17.Langerak TR, van der Heide UA, Kotte ANTJ, et al. Label Fusion in Atlas-Based Segmentation Using a Selective and Iterative Method for Performance Level Estimation (SIMPLE) IEEE Transactions on Medical Imaging. 2010;29:2000–2008. doi: 10.1109/TMI.2010.2057442. [DOI] [PubMed] [Google Scholar]
- 18.Sabuncu MR, Yeo BTT, Van Leemput K, et al. A Generative Model for Image Segmentation Based on Label Fusion. IEEE Transactions on Medical Imaging. 2010;29:1714–1729. doi: 10.1109/TMI.2010.2050897. [DOI] [PMC free article] [PubMed] [Google Scholar]
- 19.Netter FH. Atlas of human anatomy. 4. Philadelphia, PA: Saunders/Elsevier; 2006. [Google Scholar]
- 20.Dempster AP, Laird NM, Rubin DB. Maximum likelihood from incomplete data via the EM algorithm. Journal of the Royal Statistical Society, Series B. 1977;39:1–38. [Google Scholar]
- 21.Danielsson P-E. Euclidean Distance Mapping. Computer Graphics and Image Processing. 1980;14:227–248. [Google Scholar]
- 22.Yi SK, Hall WH, Mathai M, et al. Validating the RTOG-Endorsed Brachial Plexus Contouring Atlas: An Evaluation of Reproducibility Among Patients Treated by Intensity-Modulated Radiotherapy for Head-and-Neck Cancer. International Journal of Radiation Oncology*Biology*Physics. 2012;82:1060–1064. doi: 10.1016/j.ijrobp.2010.10.035. [DOI] [PubMed] [Google Scholar]
- 23.Aljabar P, Heckemann RA, Hammers A, et al. Multi-atlas based segmentation of brain images: Atlas selection and its effect on accuracy. NeuroImage. 2009;46:726–738. doi: 10.1016/j.neuroimage.2009.02.018. [DOI] [PubMed] [Google Scholar]