

Abstract
Objective
Elevated circulating levels of branched chain and aromatic amino acids (BCAA/AAAs) are associated with insulin resistance and incident type 2 diabetes (T2D). BCAA/AAAs decrease acutely during an oral glucose tolerance test (OGTT), a diagnostic test for T2D. It is unknown whether changes in BCAA/AAAs also signal an early response to commonly used medical therapies for T2D.
Materials and Methods
A liquid chromatography-mass spectrometry approach was used to measure BCAA/AAAs in 30 insulin sensitive (IS) and 30 insulin resistant (IR) subjects before and after: 1) one dose of a sulfonylurea medication, glipizide, 5 mg orally; 2) two days of twice daily metformin 500 mg orally; and 3) a 75-gram OGTT. Percent change in BCAA/AAAs was determined after each intervention.
Results
Following glipizide, which increased insulin and decreased glucose in both subject groups, BCAA/AAAs decreased in the IS subjects only (all P<0.05). Following metformin, which decreased glucose and insulin in only the IR subjects, 4 BCAA/AAAs increased in the IR subjects at or below P=0.05, and none changed in the IS subjects. Following OGTT, which increased glucose and insulin in all subjects, BCAA/AAAs decreased in all subjects (P<0.05).
Conclusions
BCAA/AAAs changed acutely during glipizide and metformin administration, and the magnitude and direction of change differed by the insulin resistance status of the individual and the intervention. These results indicate that BCAA/AAAs may be useful biomarkers for monitoring the early response to therapeutic interventions for T2D.
Keywords: branched chain amino acids, aromatic amino acids
Introduction
Metformin and sulfonylureas are recommended therapies for T2D by the American Diabetes Association and the European Association for the Study of Diabetes [1]. Yet, approximately 20-30% of individuals who start these medications experience treatment failure within 5 years [2]. Biomarkers that change acutely in response to T2D therapies may help identify individuals that are responding to or failing a specific medication.
Circulating levels of branched chain amino acids (BCAAs: valine, leucine, isoleucine) and aromatic amino acids (AAAs: phenylalanine, tyrosine) are elevated in individuals with risk factors for T2D, including obesity [3] and insulin resistance [4-7] and are elevated in non-diabetic individuals who later develop diabetes [7, 8]. Furthermore, BCAA/AAAs decrease during a standard, 75-gram, 2-hour oral glucose tolerance test (OGTT), which is a diagnostic test for T2D [9, 10].
These prior studies demonstrate that BCAA/AAAs may be informative with regard to identifying individuals at risk for T2D. Whether changes in these same amino acids signal a response to common therapies for T2D is unknown. The goal of these experiments was to test whether BCAA/AAAs could be used as biomarkers for the acute response to metformin or glipizide, a sulfonylurea medication.
Methods
Study Participants and Clinical Characteristics
Data for these analyses were obtained from an ongoing pharmacology perturbation study. The study enrolled adult male or non-pregnant females with risk factors for T2D (hyperlipidemia, hypertension, polycystic ovarian syndrome, family history of T2D). Subjects were excluded if they were 1) taking medications to treat diabetes or known to affect glycemic parameters; 2) pregnant, nursing, or fertile women who were not practicing a form of birth control; 3) known to have liver or kidney disease, coronary artery disease, porphyria, or allergic reactions to sulfonamides; or 4) scheduled for radiographic or angiographic studies requiring iodinated contrast dye during or within one week of completion of the study.
The protocol was approved by the local institutional review board, and informed consent was obtained from all study participants. From the first 168 subjects who completed the study protocol, we selected 60 for measurement of circulating amino acids: 30 were chosen from the pool with the lowest level of insulin resistance by homeostatic model assessment of insulin resistance (HOMA-IR; named “insulin sensitive”, IS) and 30 were chosen from the pool with the highest level of HOMA-IR (named “insulin resistant”, IR) as has been done previously [5, 6] to assure a varied spectrum of insulin resistance status among participants. All participants were of European ancestry.
Protocol and Laboratory Measurements
For all participants, medical history was obtained and weight, height, and vital signs were measured at enrollment. The study protocol was as follows:
Visit 1. After an overnight fast of at least 8 hours, blood was drawn prior to any interventions in the Clinical Research Center (CRC) to establish baseline measurements for Visit 1. Participants then received one 5 mg dose of glipizide by mouth, and blood was drawn 30, 60, 90, and 120 minutes later. Plasma glucose was measured at each time point with a hexokinase assay (Roche, Indianapolis, IN). Insulin international units were determined at each time point using a radio-immunoassay (Beckman Coulter, Fullerton, CA). Blood in EDTA-treated tubes for measurement of amino acids was obtained at baseline and 120 minutes after glipizide administration and frozen immediately at -80°C. At the end of data collection for Visit 1, all participants were provided a high carbohydrate meal and were discharged from the CRC.
Interim Period. No interventions occurred for the next six days (a “wash-out” period for glipizide), and participants were instructed to continue their usual diet, exercise patterns, and any prescribed medications. Then, in preparation for Visit 2, participants began a course of 4 × 500 mg doses of metformin by mouth. Participants self-administered 3 of the 4 metformin doses, starting two evenings before Visit 2 and taking 1 dose approximately every 12 hours.
Visit 2. After an overnight fast of at least 8 hours, participants returned to the CRC, and received the 4th dose of metformin by mouth. One hour later, blood was drawn to measure values of glucose, insulin, and amino acids for the baseline of Visit 2. Then, participants underwent a 2-hour 75-g OGTT. Blood was drawn for measurement of insulin and glucose 30, 60, and 120 minutes later. Blood for measurement of amino acids was collected 120 minutes after the start of the OGTT.
Measurement of Amino Acids
Plasma samples were queued for analysis in a blinded, random order. The samples were processed for analysis in two batches (80 and 160 samples in each batch). Reference pooled plasma samples were analyzed with the study samples and were placed in the analysis queue at the initiation and after intervals of 30 study samples. Measurement of amino acids was performed as previously described [8]. Briefly, a hydrophilic interaction liquid chromatography (HILIC) method was used for analysis of BCAAs and AAAs. LC-MS peak areas were integrated and relative quantitative information was used in these analyses. The signal-to-noise ratio (S/N) of the amino acid peak area was greater than 30 in every sample (average S/N=122, s.d.=51.8), and therefore exceeded thresholds typically used to define limits of detection (S/N >3) and quantitation (S/N>10). All LC-MS analyses were performed using a 4000 QTRAP triple quadrupole mass spectrometer (AB SCIEX; Foster City, CA) coupled to either an 1100 or 1200 Series pump (Agilent Technologies; Santa Clara, CA) and an HTS PAL autosampler (Leap Technologies; Carrboro, NC) equipped with a column heater.
Internal standard peak areas were monitored for quality control and individual samples with peak areas differing from the group by more than two standard deviations were re-analyzed. MultiQuant software (Version 1.1; AB SCIEX; Foster City, CA) was used for automated peak integration and amino acid peaks were manually reviewed for quality of integration and compared against a known standard to confirm identity. Analysis of reference, pooled human plasma samples processed and analyzed with the second batch of study samples (9-10 reference samples) showed that the analytes had coefficient of variation (CV) < 10%.
Statistical Analysis
Analyses were conducted using SAS software (version 9.3, SAS Institute; Cary, NC) and GraphPad Prism (version 5.00 for Windows; San Diego, CA). The incremental Area under the curve (AUC) from baseline for insulin during glipizide, glucose during OGTT, and insulin during OGTT were calculated using the trapezoidal method: (sum of [1/2 (value at time point A + time point B) * (difference in time between A and B)] from 0 to 120 minutes) minus [value at time 0 * 120 minutes]. The incremental area over the curve (AOC) from baseline for glucose during glipizide was calculated by subtracting the AUC from the total area under baseline: [value at time 0 *120 minutes] - (sum of [1/2 (value at time point A + time point B) * (difference in time between A and B)] from 0 to 120 minutes). HOMA-IR was calculated at Visit 1 prior to any interventions and at Visit 2 at one hour after the last dose of metformin had been taken using the following formula: [fasting glucose (mg/dL) * fasting insulin (uU/L)/405].
Median and interquartile range were provided for all quantitative variables, and Wilcoxon rank sum tests were used to compare the two groups of subjects or changes in variables within a group over time, respectively.
Results
By study design, IS participants had lower measures of HOMA-IR than did IR participants (P<0.0001, Table 1); a histogram of the HOMA-IR distribution in the IS and IR participants is shown in Figure 1. As expected, IS participants had lower fasting glucose, fasting insulin, BMI, and blood pressure measurements than IR participants (all P<0.005, Table 1). Consistent with prior findings [4-6], average fasting BCAA/AAAs were lower in the IS group than in the IR group (P<0.005 for all, Figure 2).
Table 1.
Characteristics of study participants at baseline
| IS | IR | P-value | |
|---|---|---|---|
|
| |||
| N | 30 | 30 | |
| Male : Female (N:N) | 14:16 | 17:13 | 0.45 |
| Age (yrs) | 53.5 [31.3,61.0] | 54.5 [44.75,64.50] | 0.47 |
| BMI (kg/m2) | 27.5 [23.8,31.2] | 35.8 [29.9, 39.85] | <0.0001 |
| Family history of DM (N) | 15 | 17 | 0.71 |
| Systolic BP (mmHg) | 113.0 [104.8, 122.8] | 131.0 [117.5,140.0] | 0.001 |
| Diastolic BP (mm/Hg) | 68.0 [60.0, 74.5] | 82.0 [70.0, 88.5] | 0.001 |
| HOMA-IR (mg*uU/dl *L) | 0.88 [0.68, 1.21] | 4.94 [3.05,8.80] | <0.0001 |
| Fasting Glucose (mg/dL) | 86.0 [82.3, 94.8] | 103.0 [95.0,129.0] | <0.0001 |
| Fasting Insulin (uU/L) | 3.9 [3.2, 5.4] | 20.0 [13.0,27.4] | <0.0001 |
Shown are median [interquartile range] for quantitative traits; P-values are for Wilcoxon Rank Sum Tests.
Abbreviations: IS, insulin sensitive participants; IR, insulin resistant participants; BMI: body mass index; Family history of DM: first degree relative with diabetes mellitus; BP: blood pressure; HOMA-IR: homeostatic model assessment of insulin resistance
Figure 1.
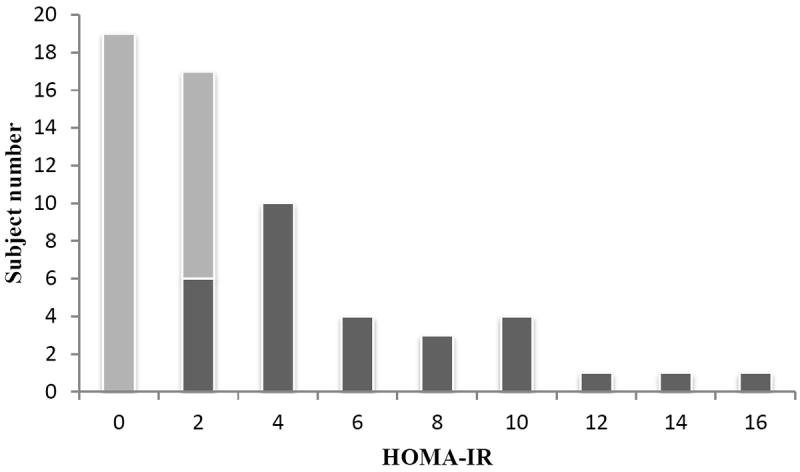
Shown are subject counts for insulin sensitive (IS) participants (white bars) and for insulin resistant (IR) participants (gray bars) for each increment of HOMA-IR.
Figure 2.
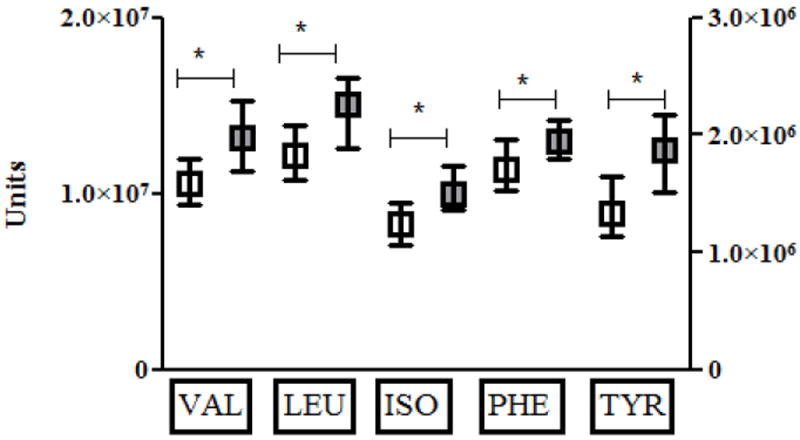
Shown are median (box) and interquartile range (whiskers) for insulin sensitive (IS, white) and insulin resistant subjects (IR, gray) for valine (VAL), leucine (LEU), isoleucine (ILE), phenylalanine (PHE), and tyrosine (TYR) at baseline prior to interventions. Values are in arbitrary units on the left Y-axis for all amino acids except TYR, which are provided in arbitrary units on the right Y-axis. Statistically significant comparisons are marked by asterix and connecting bar.
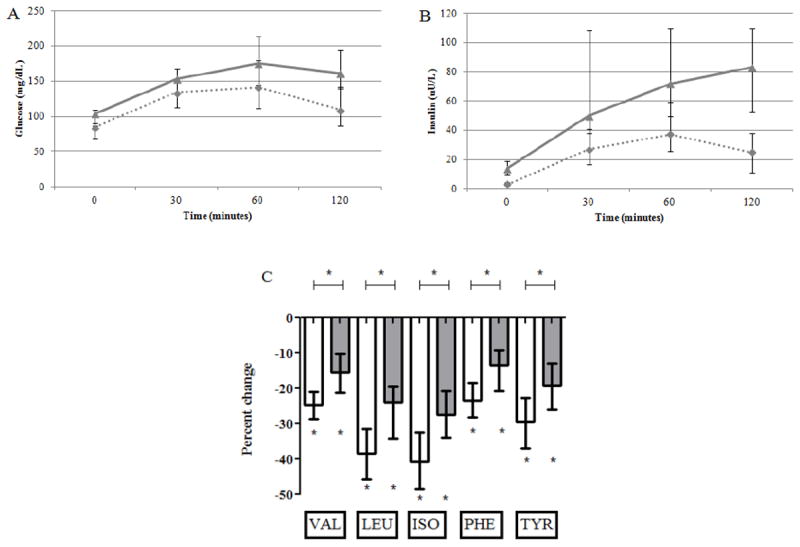
Insulin and glucose levels during the glipizide intervention are shown in Figure 3. Following glipizide administration, glucose levels fell and insulin levels rose in all participants, as expected. Comparisons between the IS and IR groups showed that the incremental glucose AOC (6203 [5363, 6870] vs. 8213 [6529, 9533] min*mg/dL, P<0.0001) and the incremental insulin AUC (435 [311,992] vs. 1620 [668, 2355] min* μU/L, P=0.002) during glipizide were smaller in the IS than in the IR participants. Median percent change in BCAA/AAAs following glipizide is also shown in Figure 3. All BCAA/AAAs decreased in IS participants (P<0.005 for valine, leucine, isoleucine, and P<0.05 for phenylalanine and tyrosine). However, the change in BCAA/AAAs was not significant in the IR participants (P>0.05 for all). The magnitude of change in valine and tyrosine was significantly different between the IS and IR groups (P<0.05 for both).
Figure 3.
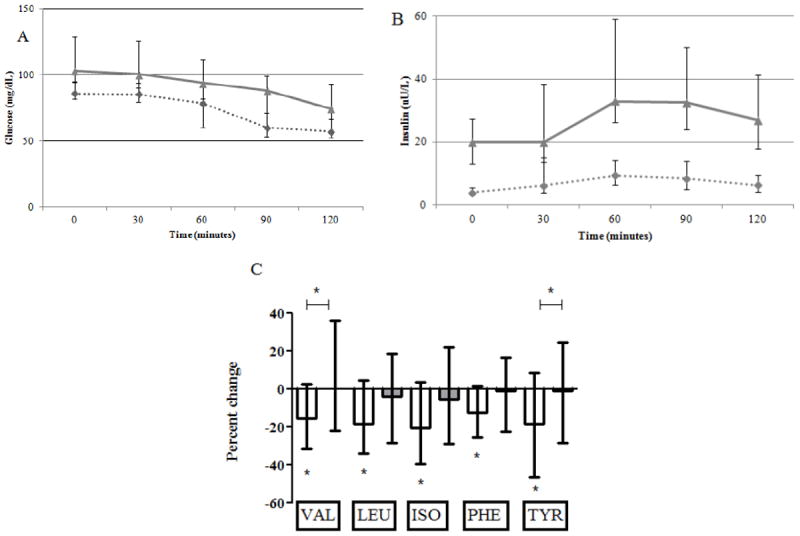
Shown are median and interquartile ranges for glucose (panel A), insulin (panel B), and percent change in BCAA/AAAs (panel C) during the glipizide intervention. Results for insulin sensitive (IS) participants are shown as dashed lines (panels A and B) or white bars (panel C), and results for insulin resistant (IR) participants are shown as gray lines (panels A and B) or gray bars (panel C). Statistically significant changes are marked by asterix and statistically significant comparisons are marked by asterix and connecting bar.
Changes in glucose and insulin levels after the metformin intervention are shown in Figure 4. Following metformin administration, fasting glucose levels decreased in the IR participants (-7.0 [-14.0, -1.75] mg/dL, P=0.0001) but not in the in the IS participants (-2.0 [-6.0, 3], P=0.11) relative to values at the Visit 1 baseline; this difference in glucose change between the two groups was statistically significant (P=0.006). Following metformin administration, fasting insulin levels decreased in the IR participants (-5.0 [-9.3, -1.3] uU/L, P=0.0007) but not the IS participants (-1.1 [-1.62, 0.4], P=0.1) relative to values at the Visit 1 baseline; this difference in insulin change between the two groups was statistically significant (P=0.0004). Similar to what was observed for insulin following metformin, HOMA-IR decreased significantly in the IR participants (-1.7 [-3.0, -0.4], P=0.0003) but not in the IS participants (-0.2 [-0.47, 0.07], P=0.05) relative to values at the Visit 1 baseline, and this difference in HOMA-IR change between the two groups was statistically significant (P<0.0001). Median percent change in BCAA/AAAs following metformin is also shown in Figure 4. No BCAA/AAAs changed significantly in the IS participants (all P>0.05). However, in the IR participants, there was a significant increase in leucine (P=0.02) and isoleucine (P=0.007) and there was a trend toward increase in valine and tyrosine (P=0.056 for both) relative to values at the Visit 1 baseline. The only significant difference in the magnitude of change in BCAA/AAAs between the IS and IR groups during the metformin intervention was for tyrosine (P=0.04).
Figure 4.
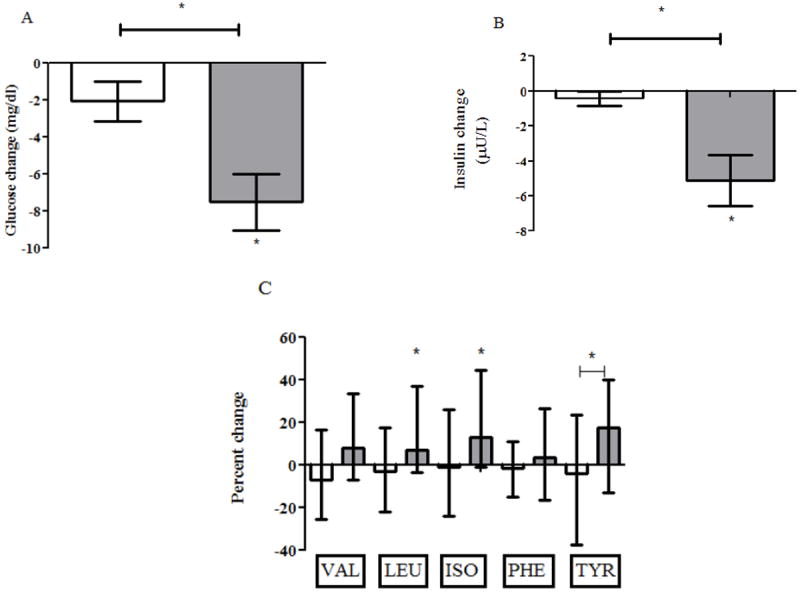
Shown are median and interquartile ranges for change in glucose (panel A), change in insulin (panel B), and percent change in BCAA/AAAs (panel C) during the metformin intervention. Results for insulin sensitive (IS) participants are shown as white bars, and results for insulin resistant (IR) participants are shown as gray bars. Statistically significant changes are marked by asterix and statistically significant comparisons are marked by asterix and connecting bar.
Following OGTT, both glucose and insulin levels rose in all participants, as expected (Figure 5). The incremental glucose AUC during OGTT (4830 [2711, 7339] vs. 7080 [4946, 8366 min*mg/dL, P=0.01) and incremental insulin AUC (1362 [894, 2579] vs. 2985 [2324, 4365] min*μU/L, P=0.003) were smaller in the IS than in the IR participants. Median percent change in BCAA/AAAs following OGTT is also shown in Figure 5. All amino acids decreased during the OGTT intervention in both the IS and IR participants (P<0.005 for all), and the decrease was greater in the IS than the IR participants for all amino acids (P<0.005 for valine, leucine, isoleucine, and phenylalanine and P=0.006 for tyrosine).
Figure 5.
Shown are median and interquartile ranges for glucose (panel A), insulin (panel B), and percent change in BCAA/AAAs (panel C) during the OGTT intervention. Results for insulin sensitive (IS) participants are shown as dashed lines (panels A and B) or white bars (panel C), and results for insulin resistant (IR) participants are shown as gray lines (panels A and B) or gray bars (panel C). Statistically significant changes are marked by asterix and statistically significant comparisons are marked by asterix and connecting bar.
Discussion
Our principal finding is that BCAA/AAAs changed acutely following glipizide and metformin administration. These results expand from prior studies demonstrating decreases in BCAA/AAAs during the acute hyperinsulinemic challenges of an insulin clamp [3], an intravenous glucose tolerance test [4], and an OGTT [9, 10]. We validated that BCAA/AAAs decreased during an OGTT in both IS and IR individuals and demonstrated for the first time that BCAA/AAAs can be used as biomarkers for the acute response to medical therapies for T2D.
Importantly, our results also showed that the direction and magnitude of change in these amino acids varies depending upon the therapeutic intervention and on the insulin resistance status of the individual receiving the intervention. Notably, BCAA/AAAs decreased following glipizide but increased during metformin, both of which are recommended treatments for T2D [1]. In addition, BCAA/AAAs decreased more in IS than in IR individuals following the hyperinsulinemic challenges of glipizide or OGTT even though IS participants experienced smaller excursions in glucose and insulin.
These findings have potential translational implications for the use of BCAA/AAAs in monitoring early responses to T2D therapies. Specifically, either an increase or decrease in BCAA/AAAs may signal a positive effect of a diabetes treatment. While elevated levels of BCAA/AAAs under static conditions, such as fasting, have been associated with undesirable metabolic states, such as obesity, insulin resistance, elevated fasting glucose levels, and increased risk of T2D [3-7, 11-14], we show that acute increases in BCAA/AAAs during metformin therapy, which lowered both glucose and insulin, may signal an improvement in glycemic metabolism.
The mechanism underlying these observations remains speculative and warrants further investigation. One hypothesis is that circulating levels of BCAA/AAAs reflect insulin action and change in response to the intracellular effects of insulin; these effects are reduced in the setting of insulin resistance. Thus, IS individuals experience larger decreases in BCAA/AAAs in response to acute hyperinsulinemia than do IR individuals; and individuals experience a rise in BCAA/AAAs when treated with a medication that improves their insulin sensitivity and lowers their fasting insulin. Similarly, in this model, obese individuals who have higher insulin levels also have higher BCAA/AAA levels, because their intracellular metabolic state is one of relative insulin insufficiency. Countering this hypothesis, one study has shown that gastric bypass surgery, which lowers insulin levels and HOMA-IR and improves T2D control in the setting of weight loss, decreases BCAA/AAAs [15]. This suggests that other factors, such as hormones not measured in our experiments, may have important influences on BCAA/AAA changes during medical or surgical interventions for T2D.
Our experiments leveraged mass-spectrometry based technology in well-phenotyped human subjects to characterize changes in BCAA/AAAs in IS and IR individuals following two, commonly used medical interventions for T2D and an OGTT. Still, we recognize weaknesses in our approach. First, we used HOMA-IR and not insulin clamp techniques to identify IS and IR participants. HOMA-IR has been used as an estimate of insulin resistance in prior BCAA/AAA studies [5, 6], and participants in our study had similar HOMA-IR values as IS (0.74-2.5) and IR (3.02-5.73) subjects in those studies. Therefore, use of HOMA-IR in our experiments allows comparison to findings in other studies that also used HOMA-IR. Second, we examined the change in BCAA/AAAs after acute perturbations only. It remains unknown whether the acute changes in BCAA/AAAs will correspond to long-term response or failure to a medical treatment. However, these results now provide additional justification for studying the change in BCAA/AAAs during longer-term treatment interventions for T2D.
In conclusion, we have found that BCAA/AAAs change acutely during glipizide and metformin, two medical therapies for T2D. These results indicate that BCAA/AAAs may be useful biomarkers for monitoring the acute effects and potential efficacy of T2D treatments. If our findings are validated in longer-term studies, changes in BCAA/AAAs may be used to identify those individuals who are more likely to respond to or fail specific medications for treatment of T2D.
Acknowledgments
We thank the participants in SUGARMGH and the MGH Clinical Research Center staff.
Funding
GAW, Massachusetts General Hospital, receives support from NIH training grant DK007028, from the Scholars in Clinical Science program of Harvard Catalyst- The Harvard Clinical and Translational Science Center (Award #UL1 RR 025758 and financial contributions from Harvard University and its affiliated academic health care centers), and the American Diabetes Association Merck Clinical and Translational Post-doctoral Fellowship. Metabolite profiling was partially funded by a Doris Duke Charitable Foundation Award (to DA). JCF, Massachusetts General Hospital, is supported by R01 DK088214.A1 from NIDDK.
Abbreviations
- T2D
type 2 diabetes mellitus
- BCAAs
branched chain amino acids
- AAAs
aromatic amino acids
- BMI
body mass index
- HOMA-IR
homeostatic model assessment of insulin resistance
Footnotes
Author contributions
GAW formulated the hypothesis, carried out analyses, and wrote the manuscript under the guidance of REG and JCF. JCF designed the SUGARMGH protocol. JD recruited subjects, carried out the study protocol, carried out analyses, contributed to discussion, and reviewed/edited the manuscript. ASW recruited subjects, carried out the study protocol, contributed to discussion, and reviewed/edited the manuscript. EPR performed metabolite profiling under the guidance of CBC, contributed to discussion, and edited/reviewed the manuscript. AD performed metabolite profiling under the guidance of CBC. CBC oversaw metabolite profiling, contributed to discussion, and reviewed/edited the manuscript. RJA, RRF, AMH, SQK, KRL recruited subjects, carried out the study protocol, and reviewed the manuscript. LKB, BC, and CH contributed to discussion and reviewed the manuscript. DA helped formulate hypothesis, contributed to discussion, and reviewed the manuscript. JL, RMM, ES reviewed the manuscript. AT performed genotyping analyses and reviewed the manuscript. MSH, RWG, TJW contributed to discussion and reviewed/edited the manuscript.
Financial Disclosures: J.C.F. has received consulting honoraria from Lilly and Pfizer.
Publisher's Disclaimer: This is a PDF file of an unedited manuscript that has been accepted for publication. As a service to our customers we are providing this early version of the manuscript. The manuscript will undergo copyediting, typesetting, and review of the resulting proof before it is published in its final citable form. Please note that during the production process errors may be discovered which could affect the content, and all legal disclaimers that apply to the journal pertain.
References
- 1.Inzucchi SE, Bergenstal RM, Buse JB, et al. Management of hyperglycemia in type 2 diabetes: A patient-centered approach: Position statement of the american diabetes association (ada) and the european association for the study of diabetes (easd) Diabetes Care. 2012;35(6):1364–79. doi: 10.2337/dc12-0413. [DOI] [PMC free article] [PubMed] [Google Scholar]
- 2.Kahn SE, Haffner SM, Heise MA, et al. Glycemic durability of rosiglitazone, metformin, or glyburide monotherapy. The New England Journal of Medicine. 2006;355(23):2427–43. doi: 10.1056/NEJMoa066224. [DOI] [PubMed] [Google Scholar]
- 3.Felig P, Marliss E, Cahill GF., Jr Plasma amino acid levels and insulin secretion in obesity. The New England Journal of Medicine. 1969;281(15):811–6. doi: 10.1056/NEJM196910092811503. [DOI] [PubMed] [Google Scholar]
- 4.Huffman KM, Shah SH, Stevens RD, et al. Relationships between circulating metabolic intermediates and insulin action in overweight to obese, inactive men and women. Diabetes Care. 2009;32(9):1678–83. doi: 10.2337/dc08-2075. [DOI] [PMC free article] [PubMed] [Google Scholar]
- 5.Newgard CB, An J, Bain JR, et al. A branched-chain amino acid-related metabolic signature that differentiates obese and lean humans and contributes to insulin resistance. Cell Metabolism. 2009;9(4):311–26. doi: 10.1016/j.cmet.2009.02.002. [DOI] [PMC free article] [PubMed] [Google Scholar]
- 6.Tai ES, Tan ML, Stevens RD, et al. Insulin resistance is associated with a metabolic profile of altered protein metabolism in chinese and asian-indian men. Diabetologia. 2010;53(4):757–67. doi: 10.1007/s00125-009-1637-8. [DOI] [PMC free article] [PubMed] [Google Scholar]
- 7.Stancakova A, Civelek M, Saleem NK, et al. Hyperglycemia and a common variant of gckr are associated with the levels of eight amino acids in 9,369 finnish men. Diabetes. 2012;61(7):1895–902. doi: 10.2337/db11-1378. [DOI] [PMC free article] [PubMed] [Google Scholar]
- 8.Wang TJ, Larson MG, Vasan RS, et al. Metabolite profiles and the risk of developing diabetes. Nature Medicine. 2011;17(4):448–53. doi: 10.1038/nm.2307. [DOI] [PMC free article] [PubMed] [Google Scholar]
- 9.Shaham O, Wei R, Wang TJ, et al. Metabolic profiling of the human response to a glucose challenge reveals distinct axes of insulin sensitivity. Molecular and Systems Biology. 2008;4:214. doi: 10.1038/msb.2008.50. [DOI] [PMC free article] [PubMed] [Google Scholar]
- 10.Ho JE, Larson MG, Vasan RS, et al. Metabolite profiles during oral glucose challenge. Diabetes. 2013 doi: 10.2337/db12-0754. [DOI] [PMC free article] [PubMed] [Google Scholar]
- 11.Batch BC, Shah SH, Newgard CB, et al. Branched chain amino acids are novel biomarkers for discrimination of metabolic wellness. Metabolism. 2013;62(7):961–9. doi: 10.1016/j.metabol.2013.01.007. [DOI] [PMC free article] [PubMed] [Google Scholar]
- 12.Magkos F, Bradley D, Schweitzer GG, et al. Effect of roux-en-y gastric bypass and laparoscopic adjustable gastric banding on branched-chain amino acid metabolism. Diabetes. 2013 doi: 10.2337/db13-0185. [DOI] [PMC free article] [PubMed] [Google Scholar]
- 13.Wurtz P, Soininen P, Kangas AJ, et al. Branched-chain and aromatic amino acids are predictors of insulin resistance in young adults. Diabetes Care. 2013;36(3):648–55. doi: 10.2337/dc12-0895. [DOI] [PMC free article] [PubMed] [Google Scholar]
- 14.McCormack SE, Shaham O, McCarthy MA, et al. Circulating branched-chain amino acid concentrations are associated with obesity and future insulin resistance in children and adolescents. Pediatric Obesity. 2013;8(1):52–61. doi: 10.1111/j.2047-6310.2012.00087.x. [DOI] [PMC free article] [PubMed] [Google Scholar]
- 15.Laferrere B, Reilly D, Arias S, et al. Differential metabolic impact of gastric bypass surgery versus dietary intervention in obese diabetic subjects despite identical weight loss. Science Translational Medicine. 2011;3(80):80re2. doi: 10.1126/scitranslmed.3002043. [DOI] [PMC free article] [PubMed] [Google Scholar]