

Abstract
Objective
To evaluate changes in peripapillary and macular choroidal thickness and volume after the water-drinking test (WDT) using swept-source optical coherence tomography (SS-OCT).
Design
Prospective, cross-sectional observational study.
Participants
Fifty-six eyes of 28 healthy volunteers.
Methods
Participants underwent a 3-dimensional optic disc and macula scanning protocol with a prototype SS-OCT (Topcon Inc., Tokyo, Japan) at baseline and 15, 30, 45, and 120 minutes after the start of the WDT. The WDT consisted of drinking 1000mL of water within five minutes. Objective measurements of the choroid were obtained with automated segmentation of the choroidal boundaries.
Main Outcome Measures
Choroidal thickness and volume.
Results
Mean (standard deviation) age of participants was 35.6 ± 9.1 years. Intraocular pressure (IOP) increased from 14.9 ± 2.7 mmHg at baseline to a peak of 16.8 ± 3.0 mmHg at 15 minutes after the WDT (p<0.001). Mean baseline choroidal thickness and volume were 181.3 ± 50.8 μm and 6.19 ± 1.80 mm3 at the optic disc and 217.4 ± 43.6 μm and 7.83 ± 1.55 mm3 at the macula. Following the WDT, peripapillary and macular choroidal thickness increased by a maximum of 5.7% (P < 0.001) and 4.3% (P < 0.001) respectively. Choroidal volumes increased by 6.4% (P < 0.001) and 3.9% (P < 0.001), respectively. There was no association between change in IOP and peripapillary (P = 0.27) or macular (P = 0.09) choroidal thickness.
Conclusions
Using automated segmentation of SS-OCT measurements, significant increases in choroidal thickness and volume are observed after the WDT in healthy subjects.
Primary open-angle glaucoma (POAG) comprises a group of chronic neurodegenerative diseases characterized by progressive thinning of the retinal nerve fiber layer (RNFL) and neuroretinal rim within the optic nerve head (ONH).1 Intraocular pressure (IOP) is a major risk factor for the development and progression of glaucoma, and reducing IOP is the current mainstay of glaucoma therapy.2 IOP, however, is a dynamic parameter with significant changes over the 24-h period.3 Extent of IOP fluctuations and its circadian peak have been suggested to be independent predictors of glaucoma progression.4, 5 A shortcoming of current glaucoma management is the reliance on static tonometry, which provides one-point measurements of IOP. These techniques consequently miss a majority of IOP peaks, especially when they occur outside of office hours.
Different strategies have previously been suggested to estimate the magnitude of peaks in IOP. One such approach is the water-drinking test (WDT), which consists of ingestion of 1000 mL of water (or 10 mL/kg of body weight) within a period of 5 to 15 minutes. It has been proposed that the WDT could be used as a practical provocative test to estimate peak diurnal IOP, supported by the theory that it may act as an indirect tool to measure outflow facility.6 The WDT has subsequently been used to compare the quality of diurnal pressure control between different therapeutic interventions in glaucoma.7, 8 Results of the WDT have also been shown to correlate well with visual field progression and the severity of glaucomatous damage. 9, 10
The current understanding of the physiology behind the WDT is incomplete, however, theories involving both inflow and outflow mechanisms have been proposed. The inflow theory postulates that changes in the blood-ocular osmotic pressure gradient could lead to hydration of the vitreous and increased aqueous production but this has not been confirmed.11 The outflow theory stipulates that water consumption leads to increased episcleral venous pressure (EVP), secondary to an increase in central and peripheral venous pressure, with resulting transient negative aqueous outflow.12 This would then lead to increased IOP due to reduced outflow facility from a decreased pressure gradient across the trabecular meshwork. Other investigators have theorized an additional mechanism involving engorgement of the choroidal vasculature, supported by ultrasonography measurements of a composite of retina-choroid-sclera tissue thickness after the WDT.13 Ultrasonography is, however, of limited utility for quantification of the choroid due to its low resolution, significant operator-dependence in image acquisition and interpretation, and lack of reproducibility because of its inability to track the same point across multiple sample captures.
The use of enhanced depth imaging (EDI) in spectral-domain (SD) OCT has enabled better evaluation of deep ocular structures,14 and has been shown to be able to detect choroidal changes after the WDT.15 Recently, a new generation of high-penetration OCTs has been introduced that may have the potential to further improve the understanding of temporal changes in the choroidal layer.16 These Fourrier-domain OCTs use a long wavelength light source of 1060-nm and are based on an alternative approach to image acquisition, called “swept-source” (SS-OCT). SS-OCTs employ a tunable laser (i.e., one whose wavelength of operation can be altered in a controlled manner) and photodetectors instead of a silicone-based, line-scan, charge coupled device camera used in SD-OCT systems.17 SS-OCT systems have the potential for superior imaging of the choroid due to their longer wavelength, potentially higher detection efficiency, and lower dispersion.17 In the absence of automated segmentation software for SS-OCT systems, previous investigators16, 18–20 have employed manual (mostly single-point) measurement techniques using in-built calibers to evaluate choroidal thickness. Given the high anatomical variability of the choroid, these are impractical for clinical use, are highly dependent on location of measurement, and may further be subject to operator effects.
The current study used a prototype SS-OCT system to objectively evaluate changes in choroidal thickness and volume around the optic disc and the macula in healthy subjects after the WDT. For this purpose, a new automated choroid segmentation providing demarcation of choroidal borders was applied.
MATERIALS AND METHODS
The study adhered to the tenets of the Declaration of Helsinki, was compliant with the Health Insurance Portability and Accountability Act (HIPAA) regulations, and was approved by the Institutional Review Board of the University of California, San Diego. Written informed consent was obtained from all participating subjects. This study was registered at http://clinicaltrials.gov (NCT 01507584; accessed March 29, 2013).
Subjects
Twenty-eight healthy volunteers were recruited from university employees and their families at the Shiley Eye Center, University of California San Diego. Exclusion criteria included myopia ≤ -5 diopters, presence of ocular disease, and presence of systemic conditions (such as kidney and heart disease) preventing acute water overload. Subjects had to have a normal visual field test (using Statpac II, Swedish interactive thresholding algorithm 24-2, Zeiss-Humphrey Field Analyzer, Carl Zeiss Meditec, Inc., Dublin, CA), open angles and deep anterior chamber, and no clinical signs of glaucomatous optic neuropathy on slit lamp fundus examination.
Water-Drinking Test
Subjects had been instructed to refrain from food and fluid intake three hours preceding the WDT. Immediately before the WDT, the following baseline examinations were performed on all subjects: measurement of blood pressure and heart rate, axial length (IOL Master, Carl Zeiss Meditec Inc., Dublin, CA), central corneal thickness (CCT; Pachette 2, DGH Technology Inc., Exton, PA), slit lamp examination including GAT (Haag-Streit, Koeniz, Switzerland). Three consecutive SS-OCT scans (Topcon Inc., Tokyo, Japan) were then taken with the optic disc and macula protocols from each eye. The WDT was then performed under standard conditions and consisted of ingesting 1000 mL of water in 5 minutes. Subjects then underwent repeat examinations (CCT, Goldmann applanation tonometry (GAT), and SS-OCT) 15, 30, 45, and 120 minutes after the start of the WDT, with the sequence of tests as listed.
Swept-Source Optical Coherence Tomography
Images of the optic disc and the macular region were obtained using a prototype SS-OCT system (Topcon Inc, Tokyo, Japan). The SS-OCT has an acquisition rate of 100,000 A-scans per second operated at the 1-μm wavelength region. This instrument uses a wavelength-sweeping laser with a tuning range of approximately 100 nm as light source and has a center wavelength of 1050 nm, yielding a 8 μm axial resolution in tissue. These features allow penetration of deeper tissue through the retinal pigment epithelium (RPE) into the choroid.
Two different scan protocols were used for evaluation of the choroidal thickness and volume. First, a 3-dimensional (3D) imaging data set was acquired with a 6 × 6-mm raster scan centered on the optic disc (optic disc protocol) and composed of 256 B-scans each composed of 256 A-scans (total 65,536 axial scans/volume) with an acquisition time of 1.0 seconds. The resulting scan provides a 3D image of the optic disc and surrounding area. Second, the same 3D imaging data set was obtained covering an area of 6 × 6-mm centered on the fovea (macula protocol). Both scan protocols used the choroidal reference position. The centering of scans was achieved by an internal-fixation and confirmed by a fundus camera integrated in the instrument.
Examinations were performed by one of two experienced examiners, who scanned all participants. Measurements of both eyes of each study participant were taken through undilated pupils. To be included, all images had to have an image quality score greater or equal to 45 (out of a maximum of 157.6; as per manufacturer recommendation). Quality assurance checks were done in a masked fashion separate from the time of image acquisition and images that had segmentation algorithm failures, motion artifacts, or were poorly focused were also excluded from the analysis. Failure of the automated chorioscleral interface (CSI) segmentation line was defined when corroboration with visual inspection differed in more than 25% of the scan area.
Choroidal Thickness and Volume Measurement
Segmentation data was produced utilizing the SS-OCT segmentation software (version 1.43) and exported using the manufacturer’s OCT-Batch (version 4.3.0.118) utility. The resulting data files consisted of the boundary depth information for 9 layers for each a-scan, with the values for each b-scan in a separate file. A script was developed that combined the b-scans of each exam into a single thickness file, converted from pixel space to microns, and, using the boundary depth of the first layer (ILM), computed the depths of each subsequent layer. The thickness files for the 3D volume scans were then processed using MATLAB (version 2012a; MathWorks Inc., Natick, MA) to compute the average thickness and total volume over the entire scan area for each layer. The SS-OCT segmentation software outputs zero for the boundary depths when scanning over the optic disc. We used this information to exclude the optic disc region in the 3D-volume average thickness calculations. Scans were then analyzed to determine the average thickness values in each of the 9 layers for each b-scan. Automated measurements of choroidal thickness and choroidal volume were thus obtained for all subjects. Figure 1 shows examples of SS-OCT scans of the optic disc and macula with and without the automated segmentation lines.
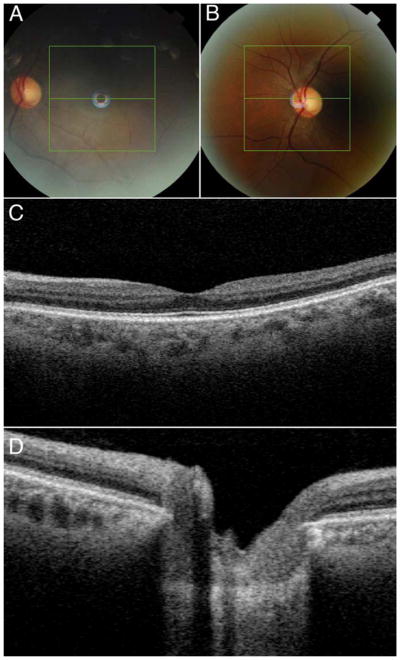
Figure 1 (A – F).

Partial 3-dimensional (3D) images of an undilated healthy eye obtained with swept-source optical coherence tomography (SS-OCT) using the instrument’s cropping function. Green line indicates center of scan and shadowline indicates plane of image cropping. Scan of the optic disc (A) and macula (D) showing unsegmented (A and D) and segmented Bruch’s membrane (BM) and chorio-scleral interface (CSI) (B and E). Images on the right show the boundaries of the BM (color line) and CSI (dark line), respectively. The choroidal thickness was calculated as the distance between the two segments.
Statistical Analysis
The minimum required sample size for the study was calculated based on the change in choroidal thickness observed with WDT in a pilot study. Considering a mean baseline macular choroidal thickness of 250.0 ± 32.0 μm, 52 eyes would be needed to detect a 5% change in choroidal thickness with a power of 80% and 95% confidence level. Data are presented as means and standard deviations (SD).
Initially, the associations between variables were graphically evaluated using scatterplots, ordinary least-squares regression and locally weighted scatterplot smoothing (LOWESS) plots. Subsequently, univariable and multivariable analyses were performed for factors related to choroidal thickness and choroidal volume. As measurements from both eyes of the same subject are likely to correlate, statistical methods are required that account for the fact that both eyes of an individual were included in the analysis. For this purpose, we used generalized estimating equations with robust standard errors (Huber-White sandwich variance estimator) to adjust for potential correlations. Peak choroidal measurements after the WDT were defined in two ways: 1) as the highest measured choroidal thickness and volume and 2) as the choroidal thickness and volume occurring at the moment of peak IOP. All tests were two-sided and a P-value less than 0.05 was considered statistically significant. All statistical analyses were performed with commercially available software (Stata version 10.0; StataCorp, College Station, TX, USA).
RESULTS
This prospective study recruited 56 eyes of 28 healthy subjects. SS-OCT scans were not available for three subjects for the following reasons: inability to obtain good quality scans due to small pupil (N = 1) and data lost due to device failure (N = 2). Therefore, the analysis set constituted 50 eyes of 25 subjects. Table 1 shows the demographic and clinical characteristics of the study subjects. All subjects successfully performed the WDT within the required 5 minutes. No adverse events relative to the water ingestion were recorded. SS-OCT images of sufficient quality were available in 100% of eyes (50 eyes) at baseline, 92% (46 eyes) at 15 minutes, 86% (43 eyes) at 30 minutes, 92% (46 eyes) at 45 minutes, and 78% (39 eyes) at 120 minutes after start of the WDT using the optic disc protocol. For the macula protocol, corresponding numbers were 100% (50 eyes), 96% (48 eyes), 90% (45 eyes), 92% (46 eyes), and 78% (39 eyes). Reasons for unavailability of scans were: subject fatigue, device failure, insufficient image quality, and failure of the CSI segmentation line.
Table 1.
Demographic and Ocular Characteristics of 25 Study Participants
| Characteristic | No. (%)* |
|---|---|
|
| |
| Age, yrs (mean ± SD) | 35.6 ± 9.1 |
| Gender | |
| Male | 12 (48) |
| Female | 13 (52) |
| Ancestry | |
| Caucasian | 16 (64) |
| Hispanic | 5 (20) |
| Asian | 2 (8) |
| Other | 2 (8) |
| SER, D (mean ± SD) | −0.9 ± 1.5 |
| Axial length, mm (mean ± SD) | 24.2 ± 1.0 |
| CCT, μm (mean ± SD) | 551.7 ± 38.7 |
| IOP, mmHg (mean ± SD) | 14.9 ± 2.7 |
| Blood pressure, mmHg (mean ± SD) | |
| Diastolic | 73.4 ± 8.2 |
| Systolic | 122.6 ± 10.3 |
| Heart rate, bpm (mean ± SD) | 73.2 ± 13.7 |
| Body Mass Index, (mean ± SD) | 23.9 ± 4.4 |
Where applicable.
CCT = central corneal thickness; D = diopters; IOP = intraocular pressure; SD = standard deviation; SER = spherical equivalent refraction.
On average, IOP increased from 14.9 ± 2.7 mmHg at baseline to 16.8 ± 3.0 mmHg at 15 minutes, 16.3 ± 3.3 mmHg at 30 minutes, 15.9 ± 2.7 mmHg at 45 minutes, and 13.6 ± 3.0 mmHg at 120 minutes (Figure 2). Peak IOP after the WDT occurred at 15 minutes in 46%, at 30 minutes in 32%, at 45 minutes in 14%, and at 120 minutes in 8%. Mean baseline peripapillary and macular choroidal thickness were 181.3 ± 50.8 μm and 217.4 ± 43.6 μm, respectively. Summary statistics for mean peripapillary and macular choroidal thickness and volume measurements after the WDT are shown in Table 2. Following the WDT, there was an increase from baseline peripapillary choroidal thickness to maximum choroidal thickness of 10.3 ± 8.5 μm (5.7%; P < 0.001) and to the thickness measured at peak IOP of 4.7 ± 1.6 μm (2.6%; P < 0.001). The corresponding increase in peripapillary choroidal volume from baseline to maximum volume and to the volume at peak IOP were 0.40 ± 0.06 mm3 (6.4%; P < 0.001) and 0.16 ± 0.06 mm3 (2.6%; P = 0.007), respectively. The post WDT increase in macular choroidal thickness was 9.4 ± 14.4 μm (4.3%; P < 0.001) at its maximum and 2.6 ± 13.7 μm (1.2%; P = 0.201) at the time of peak IOP. The increase in macular choroidal volume was 0.31 ± 0.60 mm3 (3.9%; P < 0.001) and 0.15 ± 0.11 mm3 (1.9%; P < 0.01), respectively.
Figure 2 (A–D).
Fundus photos at the macula (A) and optic disc (B) and corresponding 2-dimensional images show the location of image centering (green horizontal line) (C–D).
Table 2.
Mean choroidal thickness and volume before and after the water-drinking test (WDT) measured at the optic disc and at the macula.
| Time | Choroidal thickness (μm) | Choroidal volume (mm3) | ||
|---|---|---|---|---|
|
| ||||
| Optic disc scan | Macula scan | Optic disc scan | Macula scan | |
|
| ||||
| Baseline | 181.3 ± 50.8 | 217.4 ± 43.6 | 6.19 ± 1.80 | 7.83 ± 1.55 |
| WDT – 15 minutes | 184.3 ± 49.7 | 216.2 ± 41.6 | 6.29 ± 1.72 | 7.76 ± 1.49 |
| WDT – 30 minutes | 184.1 ± 51.4 | 220.8 ± 46.0 | 6.26 ± 1.78 | 7.92 ± 1.65 |
| WDT – 45 minutes | 182.6 ± 51.9 | 216.8 ± 43.1 | 6.22 ± 1.80 | 7.78 ± 1.55 |
| WDT – 120 minutes | 178.8 ± 55.2 | 214.1 ± 44.5 | 6.08 ± 1.91 | 7.68 ± 1.60 |
Peak peripapillary choroidal thickness after the WDT occurred at 15 minutes in 26%, at 30 minutes in 32%, at 45 minutes in 23%, and at 120 minutes in 19% of eyes. Within the macular region, the same changes were seen in 39%, 21%, 21%, and 19% of eyes, respectively. In 38% of eyes (19/50) peak IOP and peak peripapillary choroidal thickness occurred at the same time-point compared to 42% for macular choroidal thickness. This correspondence was seen in 30% and 38% for peripapillary and macular choroidal volume measurements, respectively. When plotting the maximum change in IOP from baseline against maximum change in peripapillary and macular choroidal thickness, there was no association between the two variables (peripapillary thickness, R2 = 0.077; P = 0.27; macular thickness, R2 = 0.030; P = 0.09) (Figure 3). Table 3 shows associations between baseline choroidal thickness and relevant demographic and ocular parameters.
Figure 3.

Box plot showing intraocular pressure (IOP) changes after the waterdrinking test (WDT). Values on x-axis indicate minutes after the start of the WDT.
Table 3.
Association between choroidal thickness (dependent variable) and demographic and ocular parameters in a multivariable regression model for both scan protocols.
| Average choroidal thickness | Coefficient (RSE) | P Value | |
|---|---|---|---|
| Optic disc | Age (year) | −1.04 (1.29) | 0.42 |
| CCT (μm) | −0.03 (0.30) | 0.92 | |
| Axial length (mm) | −26.35 (11.86) | 0.02 | |
| SER (D) | 8.31 (7.63) | 0.28 | |
|
| |||
| Macula | Age (year) | −1.77 (0.86) | 0.04 |
| CCT (μm) | 0.27 (0.15) | 0.06 | |
| Axial length (mm) | −17.63 (8.98) | 0.04 | |
| SER (D) | 10.90 (5.65) | 0.05 | |
Abbreviations:
CCT = central corneal thickness; D = diopters; RSE = robust standard error; SER = spherical equivalent refraction.
Image Quality
Mean image quality was 128.3 ± 15.3 (range: 47.8–147.3) on optic disc scans and 135.5 ± 10.9 (range: 100.7 – 152.2) on macula scans. There was no correlation between image quality and peripapillary and macular choroidal thickness measurements at baseline (R2 = 0.015; P = 0.320) and (R2 = 0.001; P = 0.866), respectively. No significant correlations were seen at other points in time (data not shown). The same associations were seen between image quality and peripapillary and macular choroidal volumes (data not shown).
DISCUSSION
Although the use of the WDT as a predictive test for peak circadian IOP has been studied widely in recent years, its physiology is not fully understood.11 In the present study, we used SS-OCT with a novel automated segmentation software to measure choroidal thickness and volume before and after the water-drinking test in healthy individuals. We showed that there is a consistent and statistically significant increase of peripapillary and macular choroidal thickness and volume after the WDT. However, with both the magnitude of choroidal increase being relatively small and the absence of an association between IOP rise and choroidal increase, it seems unlikely that changes occurring within the choroid would be the primary mechanism behind the rise in IOP after this provocative test. To the best of our knowledge, our study was the first to use automated segmentation of the choroid to obtain operator-independent and objective measurements of thickness and volume.
Two previous groups have studied changes in choroidal thickness following the WDT. De Moraes et al.,13 used ultrasonography to measure changes of the ocular shell (e.g., a composite of retina-choroid-sclera-episcleral tissue) after the WDT in a group of glaucoma patients. They hypothesized that, except for the choroid, all other structures would not change in thickness after water ingestion. Under this assumption, they found a significant increase of 200 μm in “choroidal thickness” (measured 7 mm nasal to the optic disc) after the WDT, while IOP increased by 3.5 mmHg with peak IOP at 30 minutes. Interestingly, there was a moderate correlation between peak choroidal thickness and peak ocular pulse amplitude, which preceded peak IOP by 15 minutes. Based on these findings, it was hypothesized that increased choroidal volume due to hemodynamic forces may play a role in the mechanism of IOP elevation by resulting in a pressure gradient that is transmitted to intraocular compartments. Their finding of a doubling of choroidal thickness following the WDT differs from the present study in which only a 4.3–5.7% increase was observed. Possible explanations could be differences in subjects (glaucoma vs. healthy), instruments, and location of measurements. Also, it is possible that the discrepant results are due to an increase in EVP after the WDT by leading to its engorgement or even hyper-hydration of the scleral tissue, which would violate their hypothesis.
More recently, Arora K et al.,15 evaluated macular choroidal thickness changes in a group of patients with open angle and angle-closure glaucoma using manual EDI SD-OCT measurements of B-scans. In all, they found a statistically insignificant increase in choroidal thickness (2.54 ± 14.32 μm, P = 0.10) at 30 minutes after the WDT and no association between change in IOP and choroidal thickness (P = 0.97). There was however a statistically significant increase in choroidal thickness in eyes with angle closure. There was no correlation between the percentage increase in choroidal thickness and percentage increase in IOP. The authors, therefore, concluded that choroidal changes did not fully explain the WDT-related rise in IOP. However, the fact that they obtained a single SD-OCT scan at 30 minutes after WDT and did not measure IOP at 15 minutes after the water load may have precluded the detection of peak choroidal thickness and IOP occurring before or after these time-points. Similar to Arora et al., in our study, using in a multivariable model, there was no statistically significant association between age, CCT, axial length, spherical equivalent refraction and change in choroidal thickness after WDT (Data not shown).
Other mechanisms for the WDT have been proposed. D iestelhorst et al.,12 repeatedly studied aqueous humor dynamics in 19 healthy subjects and demonstrated that the WDT causes a transient period of negative aqueous outflow. They hypothesized that a WDT-related rise in EVP would temporarily reduce outflow facility after the WDT and this relationship has been previously shown.21 However, due to the unavailability of objective measurement techniques for EVP until recently,22 no study has been conducted to study EVP changes after the WDT. Based on these findings, Goldberg and Clement,23 have suggested that the WDT may be of clinical utility by “unmasking” pathologic EVP effects. Another contributory mechanism for the WDT response may be the effect on adrenergic stimulation. It has been shown that sympathetic activity occurs as a result of fluid ingestion with a increase in plasma levels of noradrenalin.24 This effect may be pronounced in glaucoma patients who have a component of autonomic dysfunction.25
A strength of the present study is the use of automated segmentation for measurement of the choroid using the SS-OCT. Previous studies that used SD-OCT15, 26–36 and SS-OCT19, 37 instruments obtained manual choroidal thickness estimates mostly in the subfoveal region, either in a point-to-point manner or as an average over a B-scan. Measurements from single A-scans, however, are problematic as the choroid is an irregular structure with focal thinning or thickening (Figure 1). The limitation of manual measurements was demonstrated by Ikuno et al.,38 who reported moderate interobserver correlation coefficients (ICCs) of 0.6–0.8 using both EDI SD-OCT and SS-OCT. Maul et al., using average thickness over 6 mm of a B-scan obtained interobserver ICCs of 0.97–0.98. Several recent SD-OCT studies applied more objective methods for choroidal thickness measurements.26, 39, 40 Shin et al.,39 proposed a novel method for creating a Early Treatment Diabetic Retinopathy Study (ETDRS) – style topographic map of choroidal thickness by modifying the six radial scan protocol used with SD-OCT. Delineation of the choroid was achieved by displacing the inbuilt reference line of the retinal boundary to the chorio-scleral interface in each of the 6 radial B-scans. This method, however, was time-consuming (167 seconds per eye) and not fully automated as it involved manual adjustment of boundaries. Chhablani et al.,40 proposed a similar approach using the EDI SD-OCT retinal segmentation software (Spectralis, Heidelberg Engineering, Heidelberg, Germany) to demarcate the choroid. They reported mean foveal choroidal thickness of 264.15 μm (grader 1) and 263.83 μm (grader 2) with high agreement between graders (concordance correlation coefficients, 0.996). Roberts et al.,26 examined peripapillary choroidal thickness in healthy and glaucomatous Caucasian individuals. Using Spectralis SD-OCT, the distance between the automated segmentation line of the inner choroidal border (at Bruch’s membrane) and a manually delineated outer choroidal boundary was calculated. The ETDRS-map technique was also used by other investigators to analyze SS-OCT images. Hirata et al.,20 reported mean macular choroidal thickness and volume of 191.5 ± 74.2 μm and 5.41 ± 2.09 mm3 in 31 healthy Japanese subjects. They assessed reproducibility of measurements between two graders in a subset of subjects and reported ICCs between 0.945 and 0.980. Our study overcame these limitations by using automated segmentation of inner and outer borders of the choroid. Currently, manual measurements of choroidal thickness are the (imperfect) gold standard. In a separate study, we validated the automated choroid segmentation by comparison with manual measurements by two masked graders and found intraclass correlation coefficients (ICC) of 0.82–0.91 (Personal communication).
The present study has some limitations. First, we only investigated choroidal changes in healthy subjects, while glaucoma patients would be expected to present a more pronounced response to the WDT due to impaired aqueous outflow. Second, we used a prototype SS-OCT system, which may account for the relatively high frequency of missing scans due to device failures. At present, however, this device is the system that provides the highest resolution of the choroid in addition to automated segmentation. The fact that scans were obtained through undilated pupils reflects a real-world scenario in a busy clinic setting but may have contributed to lower image quality. However, strong agreement of choroidal measurements between SD-OCT instruments and between SD-OCT31 and SS-OCT38 has been shown. Although the variability of measurements (as indicated by SDs) was high, it was lower than previously reported. For instance, Usui et al.,37 reported average macular choroidal thickness was 280.3 ± 106.1 compared to 221.7 ± 42.9 in our study. Finally, since the study sample size was calculated for choroidal thickness changes after WDT as the primary outcome, it may have been underpowered to detect an association between change in IOP and in choroidal thickness and volume. However, a perfect linear correlation between choroidal expansion and IOP would only be expected in a closed, non-deformable system, which is not the case with eye. Therefore, the lack of association between choroidal measurements and IOP rise is an expected event among eyes with a normal aqueous outflow facility and may be seen at different degrees (and significance) based on how damaged the ocular drainage system is.7, 13, 15
In summary, our study objectively demonstrated that despite a statistically significant increase in peripapillary choroidal thickness and volume after the WDT in healthy subjects, this phenomenon was of a small magnitude. It is unclear whether the observed choroidal change can, by itself, explain the WDT-related increase in IOP. We have also shown that SS-OCT coupled with automated segmentation and analysis software can be used as a practical tool for evaluation of the choroid.
Figure 4.

Scatterplot with locally weighted smoothing (LOWESS, dashed line) showing the association between maximum intraocular pressure (IOP) change and maximum change in choroidal thickness measured at the optic disc, after the waterdrinking test.
A swept-source optical coherence tomograph with automated segmentation of the choroid was able to objectively measure an increase in choroidal thickness and volume after the water-drinking provocative test.
Acknowledgments
Financial support: Supported in part by NEI R01021818 (FAM), an unrestricted grant from Research to Prevent Blindness (New York, N.Y.) to the Department of Ophthalmology at the University of California San Diego, Velux Foundation, Zurich, Switzerland (KM) and Swiss Foundation for the Prevention of Blindness, Zurich, Switzerland (KM).
Footnotes
Financial disclosures: K Mansouri, Research and financial support from Sensimed AG; FA Medeiros, Research and financial support from Carl Zeiss Meditec, Inc., Pfizer, Inc. Reichert, Inc., Depew, NY; N Marchase, none; AJ Tatham, none; Auerbach D, none; RN Weinreb, Research and financial support from Carl Zeiss Meditec, Inc., Dublin, CA; Heidelberg Engineering, GmbH, Heidelberg, Germany; Optovue, Inc., Fremont, CA; Topcon Medical Systems, Inc., Livermore, CA; Nidek, Aichi, Japan.
Publisher's Disclaimer: This is a PDF file of an unedited manuscript that has been accepted for publication. As a service to our customers we are providing this early version of the manuscript. The manuscript will undergo copyediting, typesetting, and review of the resulting proof before it is published in its final citable form. Please note that during the production process errorsmaybe discovered which could affect the content, and all legal disclaimers that apply to the journal pertain.
References
- 1.Mansouri K, Leite MT, Medeiros FA, et al. Assessment of rates of structural change in glaucoma using imaging technologies. Eye (Lond) 2011;25:269–77. doi: 10.1038/eye.2010.202. [DOI] [PMC free article] [PubMed] [Google Scholar]
- 2.Weinreb RN, Khaw PT. Primary open-angle glaucoma. Lancet. 2004;363:1711–20. doi: 10.1016/S0140-6736(04)16257-0. [DOI] [PubMed] [Google Scholar]
- 3.Mansouri K, Weinreb RN, Liu JH. Effects of aging on 24-hour intraocular pressure measurements in sitting and supine body positions. Invest Ophthalmol Vis Sci. 2012;53:112–6. doi: 10.1167/iovs.11-8763. [DOI] [PubMed] [Google Scholar]
- 4.Asrani S, Zeimer R, Wilensky J, et al. Large diurnal fluctuations in intraocular pressure are an independent risk factor in patients with glaucoma. J Glaucoma. 2000;9:134–42. doi: 10.1097/00061198-200004000-00002. [DOI] [PubMed] [Google Scholar]
- 5.Musch DC, Gillespie BW, Niziol LM, et al. CIGTS Study Group. Intraocular pressure control and long-term visual field loss in the Collaborative Initial Glaucoma Treatment Study. Ophthalmology. 2011;118:1766–73. doi: 10.1016/j.ophtha.2011.01.047. [DOI] [PMC free article] [PubMed] [Google Scholar]
- 6.Brubaker RF. Targeting outflow facility in glaucoma management. Surv Ophthalmol. 2003;48(suppl):S17–20. doi: 10.1016/s0039-6257(03)00003-1. [DOI] [PubMed] [Google Scholar]
- 7.Mansouri K, Orguel S, Mermoud A, et al. Quality of diurnal intraocular pressure control in primary open-angle patients treated with latanoprost compared with surgically treated glaucoma patients: a prospective trial. Br J Ophthalmol. 2008;92:332–6. doi: 10.1136/bjo.2007.123042. [DOI] [PubMed] [Google Scholar]
- 8.Medeiros FA, Pinheiro A, Moura FC, et al. Intraocular pressure fluctuations in medical versus surgically treated glaucomatous patients. J Ocul Pharmacol Ther. 2002;18:489–98. doi: 10.1089/108076802321021036. [DOI] [PubMed] [Google Scholar]
- 9.Susanna R, Jr, Hatanaka M, Vessani RM, et al. Correlation of asymmetric glaucomatous visual field damage and water-drinking test response. Invest Ophthalmol Vis Sci. 2006;47:641–4. doi: 10.1167/iovs.04-0268. [DOI] [PubMed] [Google Scholar]
- 10.Susanna R, Jr, Vessani RM, Sakata L, et al. The relation between intraocular pressure peak in the water drinking test and visual field progression in glaucoma. Br J Ophthalmol. 2005;89:1298–301. doi: 10.1136/bjo.2005.070649. [DOI] [PMC free article] [PubMed] [Google Scholar]
- 11.Spaeth GL. The water drinking test. Indications that factors other than osmotic considerations are involved. Arch Ophthalmol. 1967;77:50–8. doi: 10.1001/archopht.1967.00980020052011. [DOI] [PubMed] [Google Scholar]
- 12.Diestelhorst M, Krieglstein GK. The effect of the water-drinking test on aqueous humor dynamics in healthy volunteers. Graefes Arch Clin Exp Ophthalmol. 1994;232:145–7. doi: 10.1007/BF00176783. [DOI] [PubMed] [Google Scholar]
- 13.De Moraes CG, Reis AS, Cavalcante AF, et al. Choroidal expansion during the water drinking test. Graefes Arch Clin Exp Ophthalmol. 2009;247:385–9. doi: 10.1007/s00417-008-0969-2. [DOI] [PubMed] [Google Scholar]
- 14.Spaide RF, Koizumi H, Pozzoni MC. Enhanced depth imaging spectral-domain optical coherence tomography. Am J Ophthalmol. 2008;146:496–500. doi: 10.1016/j.ajo.2008.05.032. [DOI] [PubMed] [Google Scholar]
- 15.Arora KS, Jefferys JL, Maul EA, Quigley HA. Choroidal thickness change after water drinking is greater in angle closure than in open angle eyes. Invest Ophthalmol Vis Sci. 2012;53:6393–402. doi: 10.1167/iovs.12-10224. [DOI] [PMC free article] [PubMed] [Google Scholar]
- 16.Ikuno Y, Kawaguchi K, Nouchi T, Yasuno Y. Choroidal thickness in healthy Japanese subjects. Invest Ophthalmol Vis Sci. 2010;51:2173–6. doi: 10.1167/iovs.09-4383. [DOI] [PubMed] [Google Scholar]
- 17.Yasuno Y, Hong Y, Makita S, et al. In vivo high-contrast imaging of deep posterior eye by 1-microm swept source optical coherence tomography and scattering optical coherence angiography. [Accessed July 21, 2013];Opt Express [serial online] 2007 15:6121–39. doi: 10.1364/oe.15.006121. Available at: http://www.opticsinfobase.org/oe/abstract.cfm?uri=oe-15-10-6121. [DOI] [PubMed] [Google Scholar]
- 18.Jirarattanasopa P, Ooto S, Tsujikawa A, et al. Assessment of macular choroidal thickness by optical coherence tomography and angiographic changes in central serous chorioretinopathy. Ophthalmology. 2012;119:1666–78. doi: 10.1016/j.ophtha.2012.02.021. [DOI] [PubMed] [Google Scholar]
- 19.Usui S, Ikuno Y, Miki A, et al. Evaluation of the choroidal thickness using high-penetration optical coherence tomography with long wavelength in highly myopic normal-tension glaucoma. Am J Ophthalmol. 2012;153:10–6. doi: 10.1016/j.ajo.2011.05.037. [DOI] [PubMed] [Google Scholar]
- 20.Hirata M, Tsujikawa A, Matsumoto A, et al. Macular choroidal thickness and volume in normal subjects measured by swept-source optical coherence tomography. Invest Ophthalmol Vis Sci. 2011;52:4971–8. doi: 10.1167/iovs.11-7729. [DOI] [PubMed] [Google Scholar]
- 21.Friberg TR, Sanborn G, Weinreb RN. Intraocular and episcleral venous pressure increase during inverted posture. Am J Ophthalmol. 1987;103:523–6. doi: 10.1016/s0002-9394(14)74275-8. [DOI] [PubMed] [Google Scholar]
- 22.Sit AJ, Ekdawi NS, Malihi M, McLaren JW. A novel method for computerized measurement of episcleral venous pressure in humans. Exp Eye Res. 2011;92:537–44. doi: 10.1016/j.exer.2011.03.018. [DOI] [PubMed] [Google Scholar]
- 23.Goldberg I, Clement CI. The water drinking test. Am J Ophthalmol. 2010;150:447–9. doi: 10.1016/j.ajo.2010.06.035. [DOI] [PubMed] [Google Scholar]
- 24.Cryer PE, Haymond MW, Santiago JV, Shah SD. Norepinephrine and epinephrine release and adrenergic mediation of smoking-associated hemodynamic and metabolic events. N Engl J Med. 1976;295:573–7. doi: 10.1056/NEJM197609092951101. [DOI] [PubMed] [Google Scholar]
- 25.Clark CV, Mapstone R. Systemic autonomic neuropathy in open-angle glaucoma. Doc Ophthalmol. 1986;64:179–85. doi: 10.1007/BF00159992. [DOI] [PubMed] [Google Scholar]
- 26.Roberts KF, Artes PH, O’Leary N, et al. Peripapillary choroidal thickness in healthy controls and patients with focal, diffuse, and sclerotic glaucomatous optic disc damage. Arch Ophthalmol. 2012;130:980–6. doi: 10.1001/archophthalmol.2012.371. [DOI] [PubMed] [Google Scholar]
- 27.Rahman W, Chen FK, Yeoh J, et al. Repeatability of manual subfoveal choroidal thickness measurements in healthy subjects using the technique of enhanced depth imaging optical coherence tomography. Invest Ophthalmol Vis Sci. 2011;52:2267–71. doi: 10.1167/iovs.10-6024. [DOI] [PubMed] [Google Scholar]
- 28.Chen FK, Yeoh J, Rahman W, et al. Topographic variation and interocular symmetry of macular choroidal thickness using enhanced depth imaging optical coherence tomography. Invest Ophthalmol Vis Sci. 2012;53:975–85. doi: 10.1167/iovs.11-8771. [DOI] [PubMed] [Google Scholar]
- 29.Ding X, Li J, Zeng J, et al. Choroidal thickness in healthy Chinese subjects. Invest Ophthalmol Vis Sci. 2011;52:9555–60. doi: 10.1167/iovs.11-8076. [DOI] [PubMed] [Google Scholar]
- 30.Tan CS, Ouyang Y, Ruiz H, Sadda SR. Diurnal variation of choroidal thickness in normal, healthy subjects measured by spectral domain optical coherence tomography. Invest Ophthalmol Vis Sci. 2012;53:261–6. doi: 10.1167/iovs.11-8782. [DOI] [PubMed] [Google Scholar]
- 31.Branchini L, Regatieri CV, Flores-Moreno I, et al. Reproducibility of choroidal thickness measurements across three spectral domain optical coherence tomography systems. Ophthalmology. 2012;119:119–23. doi: 10.1016/j.ophtha.2011.07.002. [DOI] [PMC free article] [PubMed] [Google Scholar]
- 32.Ho J, Branchini L, Regatieri C, et al. Analysis of normal peripapillary choroidal thickness via spectral domain optical coherence tomography. Ophthalmology. 2011;118:2001–7. doi: 10.1016/j.ophtha.2011.02.049. [DOI] [PMC free article] [PubMed] [Google Scholar]
- 33.Yamashita T, Yamashita T, Shirasawa M, et al. Repeatability and reproducibility of subfoveal choroidal thickness in normal eyes of Japanese using different SD-OCT devices. Invest Ophthalmol Vis Sci. 2012;53:1102–7. doi: 10.1167/iovs.11-8836. [DOI] [PubMed] [Google Scholar]
- 34.Maul EA, Friedman DS, Chang DS, et al. Choroidal thickness measured by spectral domain optical coherence tomography: factors affecting thickness in glaucoma patients. Ophthalmology. 2011;118:1571–9. doi: 10.1016/j.ophtha.2011.01.016. [DOI] [PMC free article] [PubMed] [Google Scholar]
- 35.Mwanza JC, Hochberg JT, Banitt MR, et al. Lack of association between glaucoma and macular choroidal thickness measured with enhanced depth-imaging optical coherence tomography. Invest Ophthalmol Vis Sci. 2011;52:3430–5. doi: 10.1167/iovs.10-6600. [DOI] [PMC free article] [PubMed] [Google Scholar]
- 36.Margolis R, Spaide RF. A pilot study of enhanced depth imaging optical coherence tomography of the choroid in normal eyes. Am J Ophthalmol. 2009;147:811–5. doi: 10.1016/j.ajo.2008.12.008. [DOI] [PubMed] [Google Scholar]
- 37.Usui S, Ikuno Y, Akiba M, et al. Circadian changes in subfoveal choroidal thickness and the relationship with circulatory factors in healthy subjects. Invest Ophthalmol Vis Sci. 2012;53:2300–7. doi: 10.1167/iovs.11-8383. [DOI] [PubMed] [Google Scholar]
- 38.Ikuno Y, Maruko I, Yasuno Y, et al. Reproducibility of retinal and choroidal thickness measurements in enhanced depth imaging and high-penetration optical coherence tomography. Invest Ophthalmol Vis Sci. 2011;52:5536–40. doi: 10.1167/iovs.10-6811. [DOI] [PubMed] [Google Scholar]
- 39.Shin JW, Shin YU, Lee BR. Choroidal thickness and volume mapping by a six radial scan protocol on spectral-domain optical coherence tomography. Ophthalmology. 2012;119:1017–23. doi: 10.1016/j.ophtha.2011.10.029. [DOI] [PubMed] [Google Scholar]
- 40.Chhablani J, Barteselli G, Wang H, et al. Repeatability and reproducibility of manual choroidal volume measurements using enhanced depth imaging optical coherence tomography. Invest Ophthalmol Vis Sci. 2012;53:2274–80. doi: 10.1167/iovs.12-9435. [DOI] [PMC free article] [PubMed] [Google Scholar]