Abstract
Prior studies exploring the spatial distributions of ventilation and perfusion have partitioned the lung into discrete regions not constrained by anatomical boundaries and may blur regional differences in perfusion and ventilation. To characterize the anatomical heterogeneity of regional ventilation and perfusion, we administered fluorescent microspheres to mark regional ventilation and perfusion in 5 Sprague-Dawley rats and then using highly automated computer algorithms, partitioned the lungs into regions defined by anatomical structures identified in the images. The anatomical regions ranged in size from the nearacinar to the lobar level. Ventilation and perfusion were well correlated at the smallest anatomical level. Perfusion and ventilation heterogeneity were relatively less in rats compared to data previously published in larger animals. The more uniform distributions may be due to a smaller gravitational gradient and/or the fewer number of generations in the distribution trees before reaching the level of gas exchange, making regional matching of ventilation and perfusion less extensive in small animals.
Keywords: Regional pulmonary blood flow, Regional ventilation, Ventilation-perfusion matching, Gas exchange, Functional unit of gas exchange, Imaging
1. INTRODUCTION
The lung efficiently exchanges respiratory gases through the tight matching of regional ventilation (V̇A) and perfusion (Q̇) at the level of the alveoli and capillaries. This local matching is remarkable given the heterogeneous spatial distributions of ventilation and perfusion (Glenny and Robertson, 1990; Robertson, 1999). While the mechanisms for the wide variations in regional V̇A and Q̇ have been reasonably well determined and reviewed (Glenny and Robertson, 2011), the mechanisms matching local V̇A and Q̇ require further investigation.
Prior studies exploring the spatial distributions of V̇A and Q̇ have used a number of different schemes to partition the lung into discrete regions. Initial studies used collimated scintillation counters at fixed vertical positions in human subjects (Ball et al., 1962; West, 1962). Reed and Wood (Reed and Wood, 1970) and then Greenfield (Greenleaf et al., 1974) used microspheres to measure blood flow and sampled dog lungs at fixed locations along a Cartesian coordinate system. Most recently, other investigators have used computerized tomography (CT) (Hoffman and Chon, 2005), single photon emission tomography (SPECT) (Petersson et al., 2004), positron emission tomography (PET) (Treppo et al., 1997) and magnetic resonance imaging (MRI) (Hopkins et al., 2007) to visualize the spatial distributions of V̇A and Q̇. All of these studies partition the lungs into voxels within 3-dimensional orthogonal coordinate systems and therefore do not respect the anatomical partitions of the lung. Fractal theory (Mandelbrot, 1983) has highlighted that this approach imposes man made geometries onto a biological structure that may have its own natural geometry.
Through embryological development, the lung is partitioned into a hierarchy of anatomical units from right and left lungs, into lobes, segments, sub-segments and acini. Airway and vascular development occur in concert with the parenchyma so that any given lung unit is served by a single airway and vascular pathway. In the final construction, the lung can be partitioned into distinct anatomical units, each supplied by a dedicated airway and vascular pathway.
One problem arising from sampling the lung along a fixed coordinate system is that sampled regions may overlap anatomical units and contain lung from different vascular and airway distributions. Another concern created by sampling from fixed coordinate systems is that lung regions may also contain large airways, vascular structures and parenchyma. Hence, sampling schemes that virtually dissect the lung regardless of anatomical partitions can potentially blur real or create artificial heterogeneity in V̇A and Q̇. The observed matching of regional ventilation and perfusion could also be distorted.
Gas exchange in the lung is dependent on both the heterogeneities of V̇A and Q ˙ but also the spatial correlation between them (Wilson and Beck, 1992). Prior studies have revealed a range of heterogeneities V̇A and Q ˙ depending on the size of the animals studied, methods used to acquire the data and normalization methods. Similarly the local correlation of ventilation and perfusion has varied among different studies. Our prior study using randomly sampled spherical volumes in a rat lung reported relatively poor matching between ventilation and perfusion (r = 0.49 ± 0.23) (Robertson et al., 2010). All of these prior studies have used geometrically defined regions of interest that may not accurately characterize the heterogeneities of ventilation and perfusion.
To investigate the importance of partitioning the lung into anatomically correct units, we measured regional ventilation and perfusion in mechanically ventilated rats using an imaging cryomicrotome and then developed computer algorithms to virtually dissect the lung parenchyma along anatomical boundaries. Regional ventilation and perfusion were mapped using fluorescent aerosols and microsphere, respectively. This allows us to report the heterogeneity for ventilation and perfusion and their matching within anatomical lung regions. We also compare our findings to those obtained through virtual dissection independent of anatomical partitions.
2. METHODS
2.1 Animal preparation and Imaging
The University of Washington Animal Care Committee approved the experimental protocol. Five male Sprague-Dawley rats weighing between 257 and 290 g were anesthetized by intraperitoneal injection of 80 mg/kg Ketamine and 10 mg/kg Xylazine, sufficient to prevent withdrawal of paw after pinch. A tracheostomy was performed, and an internal jugular vein and carotid artery were cannulated. The animals were mechanically ventilated at a rate of 44 ± 6 breaths/min with a tidal volume of ~3 mL, utilizing a piston pump ventilator. The fluorescent aerosol was generated by an in-line ultrasonic aerosol-generating system (Microstat Ultrasonic Nebulizer, Mountain Medical Equipment, Littleton, CO) that creates 1 – 2 μm mass median diameter droplets that are then passed through a drying column before entry into the trachea. The inhaled particles were characterized by an aerosol spectrometer (Grimm Aerosol NanoCheck, Germany) to size and count the particles and an aeroTrak 9000 (TSI, Shoreview, MN) that measures the particle lung deposition surface area. Scanning electron microscopy demonstrated that the generated particles were 1 – 2.5 μm in diameter. The fluorescent microsphere aerosol was generated from 2 mL of a 2.5% suspension of 0.04 μm diameter red fluorescent microspheres (Molecular Probes, Eugene, OR) in distilled water and was administered to the rats for 3–5 min. Regional perfusion to rat lungs was marked during aerosol administration by intravenous injection of 40,000 scarlet fluorescent microspheres 15 μm in diameter. A 0.15 mL arterial blood sample was obtained at the end of the aerosol administration. The rats were then deeply anesthetized with an intraperitoneal injection of Ketamine/Xylazine), their chests widely opened and exsanguinated. The pulmonary artery and left atrium were cannulated. The lungs were removed from the chest, filled via the trachea with Optimal Cutting Temperature media (OCT, Sakura Finetek Inc., Torrance, CA) until they appeared inflated to total lung capacity. To fill the non-capillary vessels, blood was injected. The filled lung was frozen, suspended in a mixture of 99.25% OCT and 0.75% India ink, and frozen in the OCT mixture.
The Imaging CryoMicrotome (Barlow Scientific, Inc., Olympia WA) is a device that determines the spatial distribution of fluorescence and fluorescent microspheres at the microscopic level. Details of the instrument configuration have been previously reported (Bernard et al., 2000) but the instrument has been improved through a number of modifications. The instrument consists of a Redlake MegaPlus II ES 3200 (San Diego, CA) with a resolution of 2,184 × 1,472 pixels, a computer (Dell Computer Corp., Round Rock, Texas), metal halide lamp (PE300BF Cermax, Excelitas Technologies, Fremont, CA), excitation filterchanger wheel, emission filter-changer wheel, and a cryostatic-microtome. Fluorescence images are acquired with a 180-mm Micro-Nikkor lens (Nikon, Corp., Tokyo, Japan). The lens is fine-focused for each emission filter with a custom-built stepper motor/gearing system to control for chromatic aberrations. Computer control of the microtome motor, emission and excitation filter wheels, fine-focus, and image capture and display is accomplished through an application written in LabVIEW (8.2, National Instruments Inc., Austin TX).
The lungs were mounted in the cryomicrotome so that 24 μm thick transverse sections (Z planes) were serially obtained from base to apex. The camera was moved an appropriate distance from the sample block so that the pixel size matched the slice thickness, providing isotropic voxels. Following every cryomicrotome cut, fluorescent emission images of the lung block were acquired for each of the two fluorescent colors (aerosol and microspheres), a full range excitation and emission image to define the lung parenchyma and an autofluorescence pairing (excitation = 485 nm, emission = 530 nm) to highlight the airway walls.
2.2 Image Processing and Identification of Anatomical Units
The objective of the image processing is to identify anatomical units at different scales of size. For each spectrum channel acquired, the images from the transverse slices are combined into a single 3-dimensional volume. The precise registration of the serial sections in the x and y directions and the uniform thickness of the transverse sections in the z direction can be demonstrated though coronal reconstructions from the transverse images shown in 1.
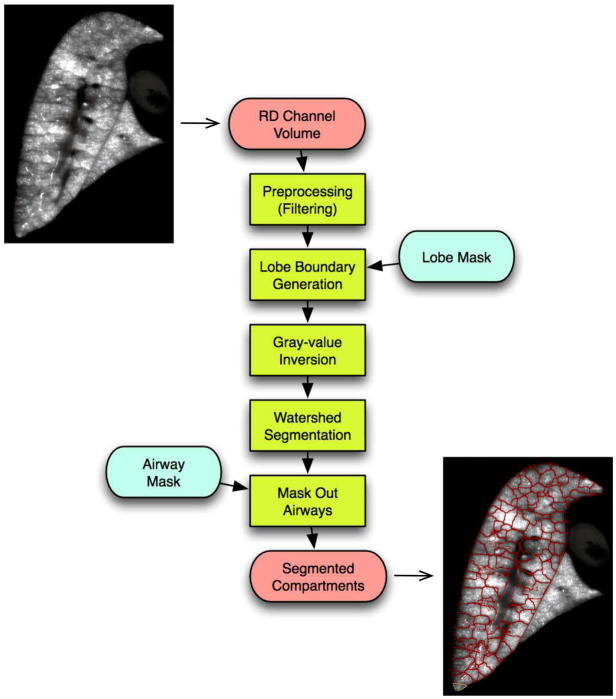
Near-acinar regions: Inspection of the aerosol images reveals structure that suggests anatomical units centered on small airways (figure 2). It appears that the aerosol fluorescence has deposited within regions demarcated by walls that have less fluorescence. We interpret this structure as representing the smallest functional unit because they have volumes approximating acinar regions (Mercer and Crapo, 1987; Rodriguez et al., 1987; Yeh et al., 1979). The partitions are automatically segmented using the algorithm depicted in figure 3, which is based on the Watershed segmentation algorithm (Vincent and Soille, 1991). The individual processing steps are as follows.
Figure 2.
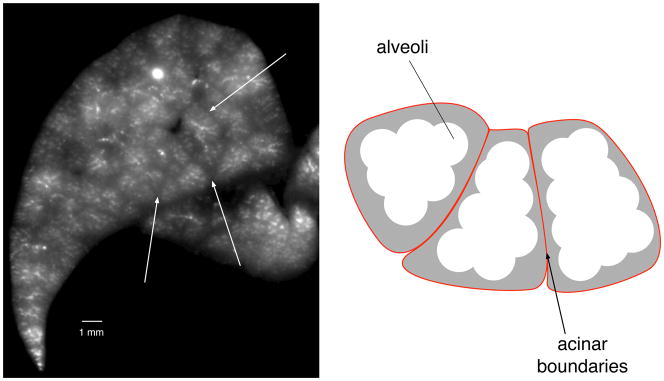
Identification of near-acinar partitions. Left: Image of aerosol fluorescence outlining structures in a transverse section through the left lung. White arrows point to boundaries between partitions that have less fluorescence. Right: cartoon illustrating alveoli that contain fluorescent aerosol (white) and the structural tissue (grey) around the acinii that demarcate the groups of alveoli within each acinus. The boundaries of each ancinus are indicated by the red lines.
Figure 3.
Algorithm to automatically partition fluorescent aerosol image into small compartments that are near-acinar in size.
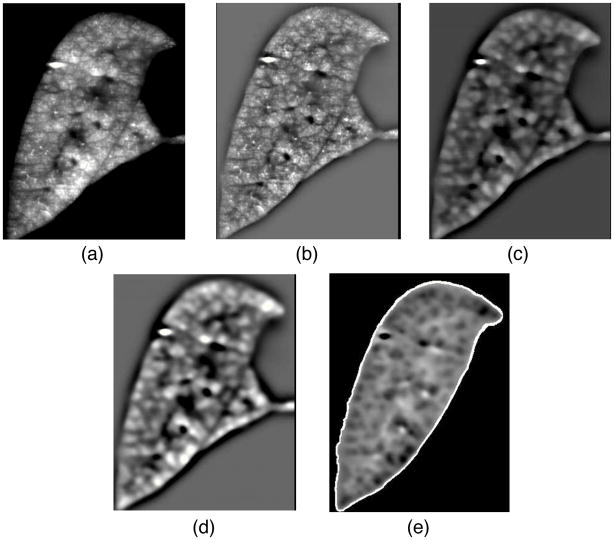
The input image is preprocessed by means of different filter operations. First, a high-pass filter, implemented by subtracting the original image by a Gaussfiltered (σ= 800 μm) version of the original, is used to reduce the low frequency gray value variations within the lobes (Fig. 4b), which can be caused by inhomogeneous lighting, for example. Second, subsequent median-filtering with a kernel size of 9 × 9 × 9 is utilized to suppress small bright gray-value peaks (Fig. 4c). Third, a Gaussian low-pass filter (σ = 160 μm) is used to provide smoother transitions between compartments (Fig. 4d) to prevent over segmentation. To ensure the watershed-segmentation will segment along the lobe border, an artificial watershed is added that is derived from the lobe mask (see below). Subsequently, gray-values are inverted so that compartments form catchment basins (Fig. 4e), and the Watershed transformation is applied. Note that voxels representing airways are set to background in the final segmentation result (Fig. 4e).
Figure 4.
Preprocessing steps for Watershed segmentation. Coronal crosssection of a left-lobe showing the aerosol fluorescent image after different preprocessing steps. a - initial fluorescent aerosol image reconstructed from transverse images. b – after processing with high-pass filter to reduce the low frequency gray value variations. c – following median filter to suppress small bright gray-value peaks. d – application of low-pass filter to prevent over segmentation. e – overlay of lobe boundary to constrain segmentation within lobes.
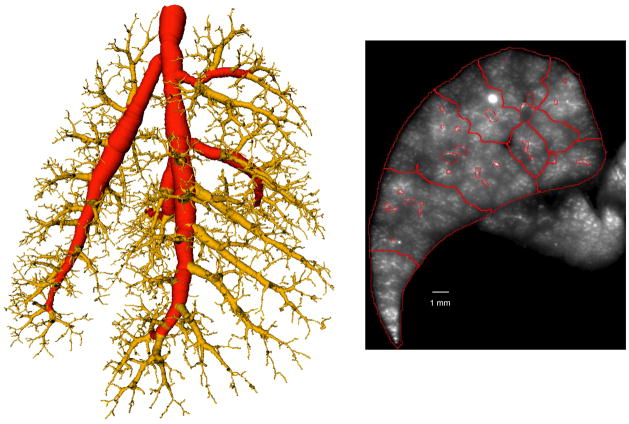
Small regions (smaller than 0.5 mm3) that may occur close to the boundary of the lung lobes are merged to larger adjacent regions. A result of the segmentation is shown in figure 5. Figure 5 also shows a rendering of a selection of compartments in relation to airways. Note that our compartment segmentation approach requires volumetric input data and produces volumetric compartments. The above outlined method is applied to all five rat lung lobes.
Figure 5.
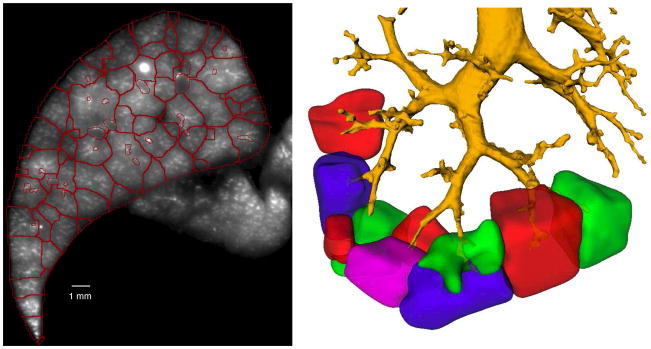
Result of near-acinar segmenting algorithm. Left. Red lines outline the partitions identified through the algorithm identifying the smallest compartments in the transverse section of figure 2. Right: 3-dimensional rendering of near-acinar compartments demonstrating relationship to airways. Airways are depicted in yellow. The individual near-acinar compartments are highlighted in different colors. Only a sub-sample of the near-acinar compartments are displayed to better show the relationship with the airways.
Sub-lobar segmentation: The airway trees structural information (skeleton+radius) is obtained using highly-automated custom software (Bauer et al., submitted). A human user identifies a single point inside the trachea and starts the automated airway tree extraction method. Subsequently, the user inspects the resulting airway tree and removes undesired structures (e.g., caused by leakage to the adjacent heart), if necessary. Subsequently, the airway tree is partitioned into several subtrees, defined as the discrete branched structures originating from the main airways supplying the 5 lung lobes. An example of the airway tree structure and the partitioning into different subtrees is shown in figure 6.
Figure 6.
Airway tree used to combine near-acinar partitions into sub-lobar compartments. Left: Airway tree extracted from one rat lung. The lung is viewed obliquely from the back with the trachea at the top and the right lung on the right. The red segments define the airways to the five lobes. The yellow airways define the sub-lobar segments. Right: Same cross-sectional image as shown in figure 2 in which the near-acinar partitions have been combined into sub-lobar compartments based on the airway tree (see text).
Sub-lobar lung regions are identified by assigning each near-acinar compartment to one of the subtree segments. In a first step the supply region is estimated by assigning each voxel of the image to the closest subtree represented by the corresponding centerline points (Attali and Montanvert, 1997). In a second step, the near-acinar compartments are assigned to the subtree with the largest overlap of the estimated supply region. The union of all near-acinar partitions assigned to a subtree forms the final subtree supply region segmentation. Example results are shown in figures 6 and 7.
Figure 7.
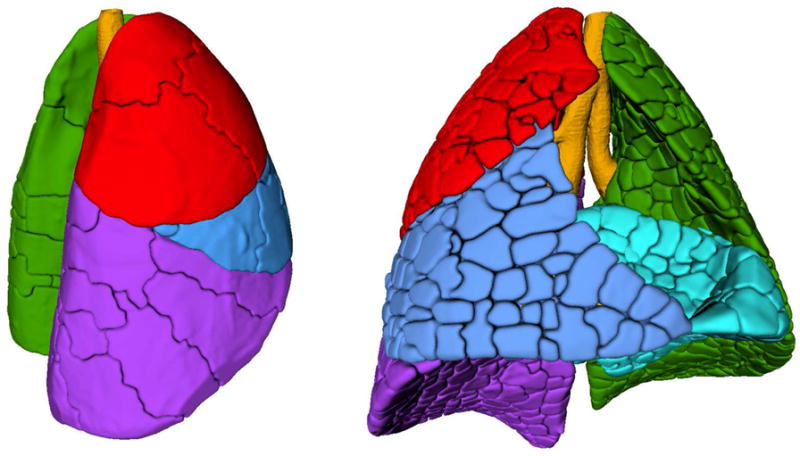
3-dimensional surface reconstructions of acinar, sub-lobar and lobar compartments. Left: Lung from right lateral oblique with lobes in primary colors (cranial = red, medial = blue, caudal = purple and left = green). The sublobes are outlined by the dark lines (“cracks”) on the lung surface. Right: Lung from front with lobes in primary colors (cranial = red, medial = blue, caudal = purple, accessory = cyan and left = green). The near-acinar compartments are outlined by the cracks on the lung surface.
Lobe segmentation: A segmentation of the tissue area is obtained based on thresholding and morphological post-processing of the autofluorescence images. Subsequently the individual lung lobes are segmented using a semi-automated tool that requires a human user to place landmark points along the fissures separating lung lobes. A thin plate spline surface is fitted through those points separating a lung lobe from other tissue (Bookstein, 1989). During this process non-lung tissue, such as heart tissue, is removed as well. A segmentation result depicting the 5 lung lobes of a rat lung is shown in figure 7.
2.3 Spherical Sampling
To allow direct comparison to methods used previously (Robertson et al., 2010) to describe V̇A, Q̇ and V̇/Q̇ ratios, the five lungs are randomly sampled using spheres 3 mm in radius (volume = 113.1 μL). The spheres are centered on randomly selected points within the lung with the constraints that each sphere had to include at least 90% lung tissue and have no more than 10% radius overlap with any other sphere. The number of 3-mm radius spheres placed in the rats range between 28 and 32.
2.4 Determination of Ventilation and Perfusion within Anatomical Units
The spatial location of each scarlet microsphere was determined using a macro written in Image J (Schneider et al.) and custom software. Due to the strong fluorescent signal generated by each microsphere and the fact that the OCT embedded lung is translucent, individual microspheres are observed in multiple transverse slices. The spatial coordinate of each microsphere in the z direction is taken as the last slice in which it was imaged. The fluorescent intensity from the red aerosol was corrected for background fluorescence at each voxel within the lung parenchyma. The total aerosol fluorescence and the numbers of microspheres within each anatomical unit and spherical sample represent regional V̇A and Q̇, respectively. Because we do not know the alveolar ventilation or perfusion in absolute flows (mL/min), V̇A and Q̇ are presented as values relative to their means, respectively. The frequency distributions of V̇A, Q̇ and V̇/Q̇ ratios, were determined at the various partition volumes. On average there were 20 microspheres per region at the near-acinar level, 569 microspheres per region and the sub-lobar level, 6148 microspheres per region at the lobar level and 314 microspheres within the random sphere samples.
3. STATISTICS
The coefficient of variation (CV= standard deviation/mean) of a distribution is used to characterize the heterogeneity of V̇A and Q̇ within the different anatomical compartments and the random sampling spheres. The strength of the relationship between V̇A and Q̇ within the different anatomical compartments is measured using Pearson’s correlation (r). The correlation coefficient from the least-squares linear regression is used to characterize how much of the variability in the dependent variable can be explained by variability in the independent variable.
4. RESULTS
4.1 Physiologic Measures
The gas exchange data for the 5 animals are presented in table 1. Despite attempts to fully recruit the lungs, gas exchange was not normal in the majority of animals as demonstrated by a widened A-aO2 difference.
Table 1.
Gas exchange data for all animals from arterial blood gases ventilated with air
| Rat number | pH | PaCO2 (mmHg) | PaO2 (mmHg) | A-aO2 difference (mmHg) |
|---|---|---|---|---|
| 1 | 7.53 | 28 | 101 | 14 |
| 2 | 7.48 | 34 | 86 | 22 |
| 3 | 7.47 | 30 | 80 | 32 |
| 4 | 7.37 | 40 | 65 | 35 |
| 5 | 7.43 | 32 | 67 | 43 |
4.2 Anatomical partitions
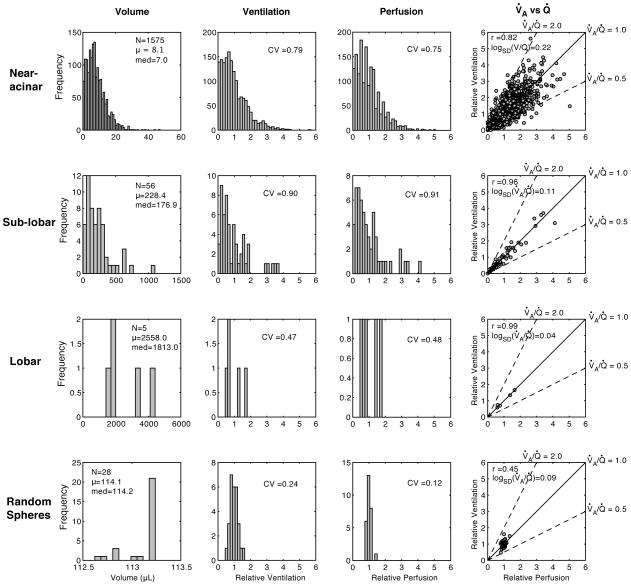
The total lung volumes across the 5 animals ranged from 11.7 to 12.8 mL and are similar to lung volumes for Sprague-Dawley rats of similar weights (Lai and Hildebrandt, 1978), indicating that the lungs were filled to total lung capacity (TLC). The volume of the conducting airways ranged from 592 – 769 μL. The distributions of volumes identified with the near-acinar, sub-lobar and lobar partitioning algorithms are shown in table 2 for the 5 animals. Figure 8 shows the frequency distributions of near-acinar volumes in one animal.
Table 2.
Number of partitions and volumes from different partitioning schemes
| Near-acinar | Sub-lobar | Lobar | |||||
|---|---|---|---|---|---|---|---|
| Rat number | Total lung volume (μL) | Number of partitions | Volume (μL) mean ± SD | Number of partitions | Volume (μL) mean ± SD | Number of partitions | Volume (μL) mean ± SD |
| 1 | 12605 | 1717 | 7.3 ± 4.8 | 68 | 185 ± 184 | 5 | 2521 ± 1412 |
| 2 | 12790 | 1575 | 8.1 ± 5.8 | 56 | 228 ± 205 | 5 | 2558 ± 1285 |
| 3 | 12375 | 1486 | 8.3 ± 6.1 | 53 | 233 ± 173 | 5 | 2475 ± 1308 |
| 4 | 12709 | 1532 | 8.3 ± 6.2 | 54 | 235 ± 218 | 5 | 2541 ± 1479 |
| 5 | 11675 | 1577 | 7.4 ± 5.5 | 62 | 188 ± 162 | 5 | 2335 ± 1422 |
Figure 8.
Frequency distributions for a number of variables across different sampling volumes in one rat. The horizontal rows present data for the same anatomical compartment (near-acinar, sub-lobar or lobar) and sampling spheres. The columns present data for the same variable (compartment volume, ventilation, perfusion and correlation between ventilation and perfusion) across the different sampling volumes (rows). Measures of relative ventilation and perfusion are unitless.
The lobar partitioning scheme identified the five lobes of the rat lung. The volumes and fraction of the lung within these lobes are presented in table 3. Heterogeneity of Ventilation and Perfusion using Anatomically Defined Volumes
Table 3.
Lobar volumes in the 5 rats
| Lobe | Volume (mL) mean ± SD | Fraction of Lung (%)mean ± SD |
|---|---|---|
| Cranial | 1.31 ± 0.15 | 10.54 ± 0.94 |
| Medial | 1.71 ± 0.08 | 13.75 ± 0.68 |
| Caudal | 3.41 ± 0.18 | 27.41 ± 1.37 |
| Accessory | 1.55 ± 0.14 | 12.43 ± 0.85 |
| Left | 4.46 ± 0.08 | 35.87 ± 0.68 |
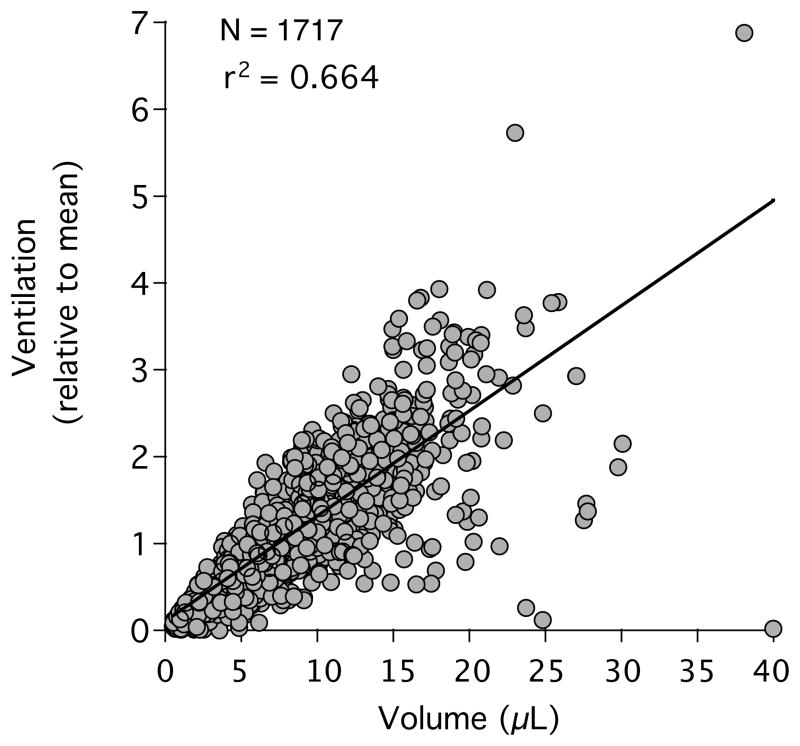
The data on V̇A and Q̇ within anatomically defined partitions are inherently different from prior data due to the variability in lung region size. The effect of variability in lung piece volume on the heterogeneity of V̇A and Q̇ can be assessed by plotting the V̇A and Q̇ to each lung region against its volume and then fit to a linear relationship. The goodness of fit (r2) indicates how much variability in V̇A or Q̇ is explained by the variability in the piece volumes (figure 9). At the near-acinar level, the variability in piece volume accounts for 59.2 % of the variability in regional V̇A and for 74.2 % of the variability in Q̇. At the sublobar level, lung piece volume plays an even greater role, accounting for 83.5 % and 93.9 % of the variability in V̇A and Q̇, respectively.
Figure 9.
Due to the large variability in the volume of each near-acinar compartment, there is a large variability in the ventilation (and perfusion, not shown). In this single animal, the variability in the near-acinar compartment volume appears to account for 66.4% of the variability in the observed ventilation.
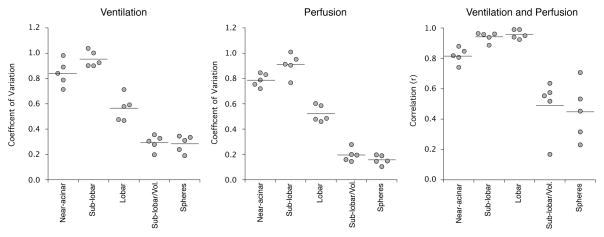
The observed heterogeneity of V̇A and Q̇ is also dependent on the volumes of the compartments investigated (figures 8 and 10) with the expectation that smaller partitions will have greater heterogeneity. The CV of V̇A at the nearacinar level across all animals was 0.84, increased to 0.95 at the sub-lobar level and then decreased to 0.57 at the lobar levels. The CV of Q̇ behaved similarly, being 0.79 at the near-acinar level, 0.91 at the sub-lobar level and 0.52 at the lobar levels. When V̇A and Q̇ are normalized to the volume of each lung region, the CV of V̇A and Q̇ decrease significantly. The mean CV of V̇A and Q̇ across all animals when normalized to the volume of the region at the near-acinar level is 0.42 and 0.42, respectively and at the sub-lobar level, are 0.29 and 0.20, respectively.
Figure 10.
Frequency distributions for a number of variables normalized to region volumes in one rat. The horizontal rows present data for the same anatomical compartment (acinar, sub-lobar or lobar). The columns present data for the same variable (compartment ventilation, perfusion and correlation between ventilation and perfusion) across the different sampling volumes (rows).
The other source of variability in Q̇ is counting noise around the numbers of microspheres in each compartment. Due to the very small lung volumes at the near-acinar level, there were few numbers of microspheres in each region, ranging from a mean of 13.6 to 28.8 microspheres per region. The counting noise can be adjusted out of the observed CV with a simple formula based on the observed CV and the mean number of microspheres counted in each region (Polissar et al., 2000). When corrected for the microsphere counting noise, the CV of Q̇ decreased slightly from 0.79 to 0.75. It is not necessary to adjust the CV of v for counting noise because the numbers of aerosol particles deposted in each region was very large.
4.3 Correlation between Regional Ventilation and Perfusion using Anatomically Defined Volumes
The correlation between regional V̇A and Q̇ is dependent on the volumes of the compartments investigated (figures 8 and 10). The correlation between V̇A and Q̇ at the near-acinar level is 0.82 and increases to 0.94 and 0.96 at the sublobar and lobar levels, respectively. The strengths of these correlations are partially due to the wide range of volumes within each compartment because smaller compartments are more likely to have less ventilation and blood flow. When V̇A and Q̇ are normalized to the volume of lung in which they are observed, the correlations between them weaken significantly (figures 10 and 11). For example, the correlation between V̇A and Q̇ when normalized to the volume of the region at the sub-lobar level decreases to 0.49.
Figure 11.
Ventilation and perfusion heterogeneity and the correlation between them across all rats and sampling volumes. Note that the observed heterogeneity of V̇A and Q̇ (measured by the coefficient of variation) tends to be larger at smaller sampling volumes. The coefficient of variation is larger at the sub-lobar than the near-acinar level due to the greater variability in the region sizes at the sub-lobar level. The correlation between V̇A and Q̇ improves with larger lung pieces. When normalized to the sampling volume, the sub-lobar compartments and the random sampling spheres have similar measures of heterogeneity and correlation between V̇A and Q̇.
4.4 Comparison to Measures of Regional Ventilation and Perfusion using Randomly Sampled Volumes
Prior studies exploring the distributions of V̇A and Q̇ in rats used randomly placed spheres to sample the lung volume (Robertson et al., 2010). To allow comparison between the anatomical compartments used in this study to prior studies, the rat lungs in this study were also sampled using randomly placed spheres 3 mm in radius. The volume of the spheres (113.1 μL) is most similar in volume to the mean sub-lobar compartments (214.2 μL, table 2). An important difference being that there is little variation in the sampling volumes of the spheres. Figure 11 demonstrates that the observed heterogeneity of V̇A and Q̇ and their correlations are similar between the sampling spheres and the volume normalized sub-lobar partitions.
4.5 Comparison of Gas Exchange to a Measure of V/Q Heterogeneity
Despite the large heterogeneity of V̇A and Q̇, efficient gas exchange is possible through the close matching of regional V̇A and Q̇. The relationship between gas exchange and V̇A and Q̇ matching in the 5 rats can be characterized by the distribution of V̇A/Q̇ per lung region. As a ratio, the relationship is commonly plotted as the log (V̇A/Q̇) (figure 12). The broader the distribution, as measured by the standard deviation (logSD(V̇A/Q̇)), the worse the matching between ventilation and perfusion. Poor matching between ventilation and perfusion is expected to have less efficient gas exchange. Figure 12 also shows the relationship between the logSD(V̇A/Q̇) and the A-aO2 difference for each animal.
Figure 12.
Relationship between V̇A/Q̇ heterogeneity and efficiency of gas exchange. Left: A V̇A/Q̇distribution for a single animal at the smallest piece size without volume normalization. The width of the V̇A/Q̇ distribution on a log scale is one measure of V̇A/Q̇ heterogeneity. The traditional measure has been the logSD(V̇A/Q̇). Right: Using the A-aO2 difference as a measure of gas exchange efficiency in the 5 rats, there is a modest relationship between the A-aO2 difference and the logSD(V̇A/Q̇) within each animal. The V̇A/Q̇ lack of a stronger relationship is discussed below.
5. DISCUSSION
This study demonstrates that V̇A and Q̇ can be measured within anatomical lung units ranging from the near-acinar to the lobar levels in the rat. The heterogeneity of V̇A and Q̇ are reported for various anatomical compartments and shown to be similar to prior reports using randomly sampled spherical units.
All prior methods of exploring the spatial distributions of V̇A and Q̇ have partitioned the lung into regions of interest that do not conform to anatomical compartments. Imaging methods acquire data in rectangular voxels that can be aggregated to create regions of interest. These are commonly orthogonal planes that traverse multiple lobes and segments (for example (Hoffman and Chon, 2005; Hopkins et al., 2007)). Most methods using microspheres require that the lung be physically dissected into pieces that cross anatomical boundaries, or if imaged, have used geometrical regions of interest that do not respect anatomical boundaries (Robertson et al., 2010). The potential problem with these approaches is that the true heterogeneity of V̇A and Q̇ may be underestimated by sampling methods that average or blur measurements from neighboring but different anatomical compartments (Glenny and Robertson, 1990).
Important caveats for this study must be addressed to judge the validity of the reported findings. Regional V̇A in this study is indirectly measured using fluorescent aerosols. Although quite small, the aerosols are particles and not gases. The distributions of inhaled particles are largely dependent on size. Particles larger than 5 μm in diameter have relatively greater inertia and tend to impact on airway walls due to their inability to follow sudden changes in airflow directions (Darquenne, 2012). Smaller particles follow changes in airflow directions and their distributions should faithfully reflect regional V̇A. Oakes et al (Oakes et al., 2013) used modeling techniques to determine the relative contributions of convection, settling and impact on the delivery of aerosols to lung segments. They concluded that for Stokes numbers < 0.01 in the trachea, ventilation defines the delivery of aerosol to lung regions and that the use of aerosol tracers is a valid technique to visualize V̇A in different parts of the lung. The Stokes number for our rats is far below 0.01, further supporting the use of our aerosols to visualize lung V̇A distribution and quantify heterogeneity of V̇A distribution in our small regions. Prior studies using aerosolized microspheres validated the use of aerosols to mark regional V̇A by demonstrating that gas exchange can be accurately predicted when used in combination with regional Q̇ measurement (Altemeier et al., 1998).
One disadvantage of the anatomical partitioning is the non-uniformity of lung regions that adds to the observed heterogeneity of V̇A and Q̇. With a large range in volumes across the anatomical partitions, the observed heterogeneity of V̇A and Q̇ will be increased because V̇A and Q̇ are partially determined by the volume of the lung region. In addition, at the smallest piece sizes, the noise associated with small numbers of blood flow microspheres will add to the observed heterogeneity of Q̇. Measures of V̇A are less affected by small regional volumes because they are not measured with particulates susceptible to Poisson noise. The contribution of region volume variability to the overall observed variability in V̇A and Q̇ can be overcome by volume normalizing the data to each piece.
A computer algorithm uses the aerosol signal to compartmentalize the lung defines our smallest lung units. We are careful not to call this smallest compartment a ventilatory unit or an acinus because we cannot use other means to confirm what this smallest compartment represents. Judging from the size of the smallest compartments, we believe that they are approaching the size of acini and have therefore termed them “near-acinar” units. Two lines of exploration provide some evidence that our near-acinii compartments approach the acinar level. First, we are able to visualize the relationship between terminal airways and our near-acinii (see figure 5). Nearly all near-acinii are associated with a terminal airway. Some near-acinii have multiple terminal airways which is consistent with other morphometric studies (Mercer and Crapo, 1987). Secondly, based on prior studies reporting on the size of acini in rats, we believe that our smallest compartments are close to the acinar level. Estimates of the acinar volumes from rats have been determined by a number of different investigators and methods. Rodriguez and colleagues (Rodriguez et al., 1987) used corrosion casts of Sprague-Dawley rat lungs inflated to 60% of TLC and found approximately 4000 acini with a mean acinar volume of 1.86 μL. If inflated to TLC as in our rats, the mean acinar volume would likely be 3.1 μL. Mercer and Crapo (Mercer and Crapo, 1987) used a morphometric approach from serial sections of fixed lungs from Sprague-Dawley rats and found around 2000 acini with a mean acinar volume twice that of Rodriguez. Yeh (Yeh et al., 1979) estimated that there are nearly 2,500 acini in a Sprague-Dawley rat lung with an acinar volume similar to that Mercer and Crapo (Mercer and Crapo, 1987). The discrepancy between these estimates of acinar number is due to how the investigator defined this terminal ventilatory unit. On average, 1577 near-acini were identified in the 5 rat lungs in this study with a mean near-acinar volumes ranging from 7.3 to 8.1 μL. The near-acinar volumes estimated in this study will be slightly larger than the acinar volumes of Mercer (Mercer and Crapo, 1987) and Yeh (Yeh et al., 1979) because our near-acinar boundaries include the airspace as well as the lung tissue surrounding the airspace; whereas the acinar volumes in the prior studies measured the airspace alone.
Clearly some of the near-acini in the current study are much too large and likely represent aggregates of multiple acini that could not be identified as being separate. We interrogated the largest near-acinar compartmetns to determine if there were any common characteristics that might explain why these compartments were so large. Some of them occurred in areas where there was little aerosl deposition, making it difficult for the computer algorithm to identify an internal structure. Some of them occurred in high areas of aerosol deposition, which appeared to overwhelm the image and washout internal structure. In the end, we could not identify any features that we could use to inform and refine our algorithm.
The large variation in the size of our near-acinar volumes is likely much greater than that of true acini. However, as demonstrated by Rodriguez et al (Rodriguez et al., 1987) there is a large distribution in acinar volumes in the rat lung. Although alveoli should be of similar sizes across the lung at the TLC volume used in our study, acnii that are made up of varying numbers of alveoli may well be of different sizes at TLC.
The relatively large A-a O2 differences in some of the animals suggest that there may have been some low V̇A/Q̇ regions. We did not find any gross pathology in the lungs and suspect that the low V̇A/Q̇ regions were due to atelectasis while the rats were in the supine posture. This might impose additional heterogeneity in our measures of ventilation and perfusion because the lungs are re-expanded to TLC prior to imaging. This should not affect the relationship between gas exchange and the width of the V̇A/Q̇ distribution as V̇A and Q̇ were measured at the same time as gas exchange.
This is the first study to partition the lung into anatomical compartments, allowing measurement of the heterogeneity of V̇A and Q̇ within functional compartments rather than geometrically defined regions. As shown previously (Glenny and Robertson, 1990), the observed heterogeneity becomes larger as the regions of interest become smaller. This scale-dependent heterogeneity is thought to be due to the asymmetrical branching of the vascular and airway trees. The more asymmetrical the branching angles the greater the variability in V̇A or Q̇ at the terminal branches. Heterogeneity of V̇A and Q̇ are also due to the number of generations in the vascular or airway tree with heterogeneity increasing with the number of bifurcations. Hence at large region volumes, after only a few generations in the trees, the variability in V̇A or Q̇ is less than in smaller lung regions and more generations in the trees. The relationship between the observed heterogeneity of V̇A and Q̇ as a function of the scale of observation has been characterized as a fractal process (Altemeier et al., 2000; Glenny and Robertson, 1990; Mandelbrot, 1983).
We are able to directly compare the results from anatomical partitioning of the lung to prior studies that have used random sampling of the lung with spherical volumes (18). Because the spheres are uniform in volume, it is most appropriate to compare them with the volume-normalized results. It is also important to compare results from similar scales of resolution. Hence the best comparisons are the volume normalized sub-lobar level anatomic partitions (mean volume = 214 μL) with the spheres that are 3 mm in radius (volume = 113.1 μL). The heterogeneity of V̇A and Q̇ and the correlation between them at these partition sizes are remarkably similar (figure 11). This comparison helps to substantiate observations published in prior studies.
Because V̇A and Q̇ are proportional to the volume of the lung region, significant variations in this shared variable will induce a correlation between V̇A and Q̇. Although the large variation in volume creates a stronger correlation between ventilation and perfusion, it is the proper comparison from a gas exchange perspective because the impact of the V̇A/Q̇ ratio on gas exchange is flow-weighted. The greater the blood flow to a particular region, the greater the impact of that region’s V̇A/Q̇ on overall lung gas exchange.
The overall efficiency of gas exchange in the lung is dependent on regional matching of V̇A and Q̇. Given the oxygen content of venous blood and the ventilation and perfusion to each lung region, it is possible to calculate an A-aO2 difference for the lung (Altemeier et al., 1998). Without the venous blood gases and the absolute flow and V̇A to each anatomic region in the rats of this study, we are not able to make these calculations. A more global measure of gas exchange efficiency is the width of the V̇A/Q̇ distribution as characterized by the logSD(V̇A/Q̇). The relationship between the A-aO2 difference and the logSD(V̇A/Q̇) is not particularly strong (r = 0.52) in this study. We can think of two potential explanations for the lack of a stronger relationship. First, the portion of the V/Q distribution below a V̇A/Q̇ of 1 (when ventilation and perfusion are measured in absolute flow units (mL/min)) that contributes the most to a widened A-aO2 difference may not be accurately captured in this study. We are not able to define the portion of the V̇A/Q̇ distribution less than 1.0 because ventilation and perfusion are only measured as relative to the mean in this study and the mean V̇A/Q̇ ratio is therefore fixed at 1.0. Second, in a lung with low V̇A/Q̇ regions, the arterial PO2 is influenced by the mixed venous PO2. It is possible that the mixed venous PO2 values varied significantly across our 5 rats due to variability in anesthesia or cardiac output, adding unknown variability to our PaO2 values.
When normalized to volume, V̇A and Q̇ still have a significant degree of heterogeneity. This heterogeneity is thought to be due to the fractal branching systems of the pulmonary vascular and airway trees (Glenny and Robertson, 1990). Any difference between the diameters of daughter branches will result in asymmetrical flow to the daughter branches. Further differences between branches at bifurcations will lead to even further asymmetry of flows. At the most distal tips of the trees, flows will be very heterogeneous and have been shown to have lognormal distributions (Qian and Bassingthwaighte, 2000). Smaller organ pieces are perfused and ventilated by trees with more bifurcations. Hence smaller regions of interest will have greater observed flow and ventilation heterogeneity.
The heterogeneity of V̇A and Q̇ in the current study appears to be somewhat smaller compared to larger animals. A number of other studies, using various methods, have measured the heterogeneity of V̇A and Q̇ in larger animals. As mentioned above and demonstrated in this study, the observed heterogeneity is dependent on the size of the lung regions investigated. Using PET in dogs, Treppo et al (Treppo et al., 1997) reported CVs for V̇A and Q̇ of 40% and 20%, respectively to regional volumes of 1 mL (1000 μL). Musch (Musch et al., 2002) also used PET in humans to estimate V̇A and Q̇ heterogeneity at about 35% to lung regions 864 μl in volume. Levin and colleagues (Levin et al., 2007) measured the heterogeneity of Q̇ in humans with MRI to lung regions of 70 μL and observed a CV of 100%. Chon and associates (Chon et al., 2006) reported perfusion heterogeneity to be about 50% in dogs using CT scanning and lung regions of 70 μL. Mure and coworkers (Mure et al., 2000) reported CVs for V̇A and Q̇ in pigs using microspheres in lung regions of 1.9 mL (1900 μL) to be 82% and 73%, respectively. To account for variation in piece size in the current study, the volume normalized V̇A and Q̇ observations should be compared to the above imaging studies that used uniform lung regions. Our sub-lobar volumes are about 200 μL and the CVs for V̇A and Q̇ are 30% and 20% respectively. While these observations are similar to studies such as Treppo’s and Musch’s using PET (Treppo et al., 1997), the lung regions are 4 – 5 times smaller in the current study and the observed heterogeneity should therefore be greater.
Wilson and Beck (Wilson and Beck, 1992) nicely demonstrated that efficient gas exchange is dependent on both the heterogeneity of V̇A and Q̇, as well as the local correlation between them. In lungs with a broad variability in V̇A and Q̇, correlation must be tight to create a narrow V/Q distribution. This appears to be the mechanism used by larger animals (Altemeier et al., 2000). However, the smaller degree in variability of V̇A and Q̇ in the rat, suggests a different strategy for efficient gas exchange in smaller animals in which the correlation between V̇A and Q̇ can be less to provide the same variability in V̇A/Q̇ distribution. The correlation between regional V̇A and Q̇ in larger animals has ranged between 0.76 and 0.92 (Altemeier et al., 2000; Robertson et al., 1997) with the higher correlations noted in those animals with the greatest overall extent of V̇A and Q̇ heterogeneity. The mathematical depiction of the factors determining gas exchange, demonstrate that a Pearson correlation coefficient alone is not an adequate predictor of gas exchange properties. In larger mammals there appears to be more heterogeneity and more correlation between V̇A and Q̇. One explanation could be the decreased variability in smaller animals is due to a smaller gravitational gradient. Another mechanism might be the fewer airway and vascular generations before the gas exchange surfaces are reached. In asymmetrically branching vascular trees, the variability in perfusion at the terminal branches increases at each successive generation (Van Beek et al., 1989). Hence fewer branching generations will create a more uniform distribution at the level of gas exchange.
Another mechanism that could be used to homogenize V̇A/Q̇ inequalities across the lung is to mix expired and inspired gases through a larger common deadspace (Ross and Farhi, 1960; Tsukimoto et al., 1990). The average anatomical deadspace as a fraction of tidal volume in our animals can be calculated if a resting tidal volume is estimated from the literature. However, the literature contains a wide range of normal tidal volumes for Sprague-Dawley rats, ranging from 0.87 mL (Strohl et al., 1997) to 1.7 mL (Krinke, 2000) to 2.4 mL (Walker et al., 1997) for a 300 g rat depending on the methods used to measure tidal volumes and restrain the animals. Using an estimate for tidal volume breathing of 1.5 mL for our rats, the anatomical deadspace to tidal volume breathing would range from 39 – 51%, somewhat larger than dogs at about 33% (Tsukimoto et al., 1990). The relatively larger common deadspace in rats causes mixing of exhaled gases emptying from regions of differing V̇A/Q̇. The mixed gas in this deadspace will then be reinspired, tending to smooth out heterogeneities of V̇A/Q̇ regions.
It is also possible that prior studies of perfusion and ventilation in larger animals could have over-estimated the true degree of heterogeneity. Dissecting organs into pieces with a range of volumes can impose V̇A and Q̇ heterogeneity. To avoid this confounding issue, studies by the Seattle group (Altemeier et al., 1998; Glenny et al., 1995; Robertson et al., 1997) used weight-normalized lung pieces to account for variability in piece size.
The novel methods for partitioning the lung into anatomical units demonstrate the power of digital imaging and utility of virtual sampling the data derived from imaging. Studies using fluorescent microspheres to measure regional V̇A and Q̇ have traditionally required the lungs to be physically dissected into small regional pieces with each piece assigned a spatial location. After extracting the fluorescent signal from each piece, the fluorescent data are subsequently paired with the spatial location to create 3-dimensional maps of V̇A and Q̇. A drawback of physical dissection is that once dissected, the lungs cannot be dissected using another scheme. Through digital imaging and virtual dissection, the lungs can be dissected repeatedly using different schemes to explore regional V̇A and Q̇ from different perspectives. Physical dissection is limited also by piece sizes and the tedium of pairing the physical pieces with the spatial information. Virtual dissection allows rat lungs to be partitioned into thousands of pieces while keeping track of the V̇A and Q̇ data in each region.
Figure 1.
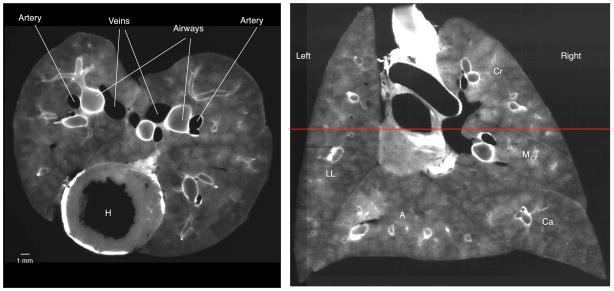
Cryomicrotome images using the autofluorescent excitation and emission filters. Left: Transverse section through lung at the level of the heart (H). In this image, the airway walls are white and the pulmonary vasculature is black as the blood does not autofluoresce. Right: Coronal slice reconstructed from serial transverse sections. The red horizontal line indicates the level of the transverse image on the left. Note the fidelity in the reconstructed image and the ability to identify airways. The left and right lungs and lobes are denoted (LL = left lung, Cr = cranial lobe, M = medial lobe, Ca = caudal lobe, and A = accessory lobe).
Acknowledgments
Grant Support
R21HL110000
R01HL073598
Footnotes
Publisher's Disclaimer: This is a PDF file of an unedited manuscript that has been accepted for publication. As a service to our customers we are providing this early version of the manuscript. The manuscript will undergo copyediting, typesetting, and review of the resulting proof before it is published in its final citable form. Please note that during the production process errorsmaybe discovered which could affect the content, and all legal disclaimers that apply to the journal pertain.
Contributor Information
Robb W. Glenny, Email: glenny@uw.edu, University of Washington, Seattle
Christian Bauer, Email: christian-bauer@uiowa.edu, University of Iowa, Iowa City.
Johannes Hofmanninger, Email: jhofmanninger@gmail.com, Vienna University of Technology, Austria.
Wayne J. Lamm, Email: wjel@u.washington.edu, University of Washington, Seattle
Melissa A. Krueger, Email: krueger@u.washington.edu, University of Washington, Seattle
Reinhard R. Beichel, Email: reinhard-beichel@uiowa.edu, University of Iowa, Iowa City
References
- Altemeier WA, McKinney S, Glenny RW. Fractal nature of regional ventilation distribution. Journal of Applied Physiology. 2000;88:1551–1557. doi: 10.1152/jappl.2000.88.5.1551. [DOI] [PubMed] [Google Scholar]
- Altemeier WA, Robertson HT, Glenny RW. Pulmonary gas-exchange analysis by using simultaneous deposition of aerosolized and injected microspheres. Journal of Applied Physiology. 1998;85:2344–2351. doi: 10.1152/jappl.1998.85.6.2344. [DOI] [PubMed] [Google Scholar]
- Attali D, Montanvert A. Computing and simplifying 2D and 3D continuous skeletons. Comput Vis Image Und. 1997;67:261–273. [Google Scholar]
- Ball WC, Jr, Stewart PB, Newsham LG, Bates DV. Regional pulmonary function studied with xenon 133. J Clin Invest. 1962;41:519–531. doi: 10.1172/JCI104505. [DOI] [PMC free article] [PubMed] [Google Scholar]
- Bauer C, Krueger MA, Lamm WJ, Smith BJ, Glenny RW, Beichel RR. IEEE Transactions on Biomedical Engineering. Airway Tree Segmentation in Cryomicrotome Images of Rat Lungs. submitted. [DOI] [PMC free article] [PubMed] [Google Scholar]
- Bernard SL, Ewen JR, Barlow CH, Kelly JJ, McKinney S, Frazer DA, Glenny RW. High spatial resolution measurements of organ blood flow in small laboratory animals. Am J Physiol Heart Circ Physiol. 2000;279:H2043– 2052. doi: 10.1152/ajpheart.2000.279.5.H2043. [DOI] [PubMed] [Google Scholar]
- Bookstein F. Principle warps: (Thin)-plate splines and the decomposition of deformations. IEEE Transactions on Pattern Analysis and Machine Intelligence. 1989;11:567–585. [Google Scholar]
- Chon D, Beck KC, Larsen RL, Shikata H, Hoffman EA. Regional pulmonary blood flow in dogs by 4D-X-ray CT. Journal of Applied Physiology. 2006;101:1451–1465. doi: 10.1152/japplphysiol.01131.2005. [DOI] [PubMed] [Google Scholar]
- Darquenne C. Aerosol deposition in health and disease. J Aerosol Med Pulm Drug Deliv. 2012;25:140–147. doi: 10.1089/jamp.2011.0916. [DOI] [PMC free article] [PubMed] [Google Scholar]
- Glenny RW, Bernard S, Barlow C, Kelly J, Robertson HT. Spatial distribution of pulmonary blood flow at a microscopic scale of resolution. Am J Respir Crit Care Med. 1995;151:A518. [Google Scholar]
- Glenny RW, Robertson HT. Fractal properties of pulmonary blood flow: characterization of spatial heterogeneity. J Appl Physiol. 1990;69:532–545. doi: 10.1152/jappl.1990.69.2.532. [DOI] [PubMed] [Google Scholar]
- Glenny RW, Robertson HT. Comprehensive Physiology. Wiley-Blackwell; 2011. Spatial Distribution of Ventilation and Perfusion: Mechanisms and Regulation; pp. 373–395. [DOI] [PubMed] [Google Scholar]
- Greenleaf JF, Ritman EL, Sass DJ, Wood EH. Spatial distribution of pulmonary blood flow in dogs in left decubitus position. Am J Physiol. 1974;227:230–244. doi: 10.1152/ajplegacy.1974.227.1.230. [DOI] [PubMed] [Google Scholar]
- Hoffman EA, Chon D. Computed tomography studies of lung ventilation and perfusion. Proc Am Thorac Soc. 2005;2:492–498. 506. doi: 10.1513/pats.200509-099DS. [DOI] [PMC free article] [PubMed] [Google Scholar]
- Hopkins SR, Henderson AC, Levin DL, Yamada K, Arai T, Buxton RB, Prisk GK. Vertical gradients in regional lung density and perfusion in the supine human lung: the Slinky effect. J Appl Physiol. 2007;103:240–248. doi: 10.1152/japplphysiol.01289.2006. [DOI] [PMC free article] [PubMed] [Google Scholar]
- Krinke G. The Laboratory Rat. Academic Press; San Diego: 2000. [Google Scholar]
- Lai YL, Hildebrandt J. Respiratory mechanics in the anesthetized rat. Journal of applied physiology: respiratory, environmental and exercise physiology. 1978;45:255–260. doi: 10.1152/jappl.1978.45.2.255. [DOI] [PubMed] [Google Scholar]
- Levin DL, Buxton RB, Spiess JP, Arai T, Balouch J, Hopkins SR. Effects of age on pulmonary perfusion heterogeneity measured by magnetic resonance imaging. Journal of Applied Physiology. 2007;102:2064–2070. doi: 10.1152/japplphysiol.00512.2006. [DOI] [PubMed] [Google Scholar]
- Mandelbrot BB. The fractal geometry of nature. W.H. Freeman; New York: 1983. Updated and augm. ed. [Google Scholar]
- Mercer RR, Crapo JD. Three-dimensional reconstruction of the rat acinus. Journal of Applied Physiology. 1987;63:785–794. doi: 10.1152/jappl.1987.63.2.785. [DOI] [PubMed] [Google Scholar]
- Mure M, Domino KB, Lindahl SG, Hlastala MP, Altemeier WA, Glenny RW. Regional ventilation-perfusion distribution is more uniform in the prone position. Journal of Applied Physiology. 2000;88:1076–1083. doi: 10.1152/jappl.2000.88.3.1076. [DOI] [PubMed] [Google Scholar]
- Musch G, Layfield JD, Harris RS, Melo MF, Winkler T, Callahan RJ, Fischman AJ, Venegas JG. Topographical distribution of pulmonary perfusion and ventilation, assessed by PET in supine and prone humans. Journal of Applied Physiology. 2002;93:1841–1851. doi: 10.1152/japplphysiol.00223.2002. [DOI] [PubMed] [Google Scholar]
- Oakes JM, Scadeng M, Breen EC, Prisk GK, Darquenne C. Regional Distribution of Aerosol Deposition in Rat Lungs Using Magnetic Resonance Imaging. Ann Biomed Eng. 2013 doi: 10.1007/s10439-013-0745-2. [DOI] [PMC free article] [PubMed] [Google Scholar]
- Petersson J, Sanchez-Crespo A, Rohdin M, Montmerle S, Nyren S, Jacobsson H, Larsson SA, Lindahl SG, Linnarsson D, Glenny RW, Mure M. Physiological evaluation of a new quantitative SPECT method measuring regional ventilation and perfusion. J Appl Physiol. 2004;96:1127–1136. doi: 10.1152/japplphysiol.00092.2003. [DOI] [PubMed] [Google Scholar]
- Polissar NL, Stanford DC, Glenny RW. The 400 microsphere per piece “rule” does not apply to all blood flow studies. Am J Physiol Heart Circ Physiol. 2000;278:H16–25. doi: 10.1152/ajpheart.2000.278.1.H16. [DOI] [PubMed] [Google Scholar]
- Qian H, Bassingthwaighte JB. A class of flow bifurcation models with lognormal distribution and fractal dispersion. J Theor Biol. 2000;205:261–268. doi: 10.1006/jtbi.2000.2060. [DOI] [PubMed] [Google Scholar]
- Reed JH, Jr, Wood EH. Effect of body position on vertical distribution of pulmonary blood flow. J Appl Physiol. 1970;28:303–311. doi: 10.1152/jappl.1970.28.3.303. [DOI] [PubMed] [Google Scholar]
- Robertson HT. Measurment of Regional Ventilation by Aerosol Deposition. In: Hlastala MP, Robertson HT, editors. Complexity In Structure and Function of the Lung. Marcel Decker, Inc; New York: 1999. pp. 379–400. [Google Scholar]
- Robertson HT, Glenny RW, Stanford D, McInnes LM, Luchtel DL, Covert D. High-resolution maps of regional ventilation utilizing inhaled fluorescent microspheres. J Appl Physiol. 1997;82:943–953. doi: 10.1152/jappl.1997.82.3.943. [DOI] [PubMed] [Google Scholar]
- Robertson HT, Krueger MA, Lamm WJ, Glenny RW. Highresolution spatial measurements of ventilation-perfusion heterogeneity in rats. Journal of Applied Physiology. 2010;108:1395–1401. doi: 10.1152/japplphysiol.01161.2009. [DOI] [PMC free article] [PubMed] [Google Scholar]
- Rodriguez M, Bur S, Favre A, Weibel ER. Pulmonary acinus: geometry and morphometry of the peripheral airway system in rat and rabbit. Am J Anat. 1987;180:143–155. doi: 10.1002/aja.1001800204. [DOI] [PubMed] [Google Scholar]
- Ross BB, Farhi LE. Dead-space ventilation as a determinant in the ventilation-perfusion concept. Journal of Applied Physiology. 1960;15:363–371. doi: 10.1152/jappl.1960.15.3.363. [DOI] [PubMed] [Google Scholar]
- Schneider CA, Rasband WS, Eliceiri KW. NIH Image to ImageJ: 25 years of image analysis. Nat Methods. 2012;9:671–675. doi: 10.1038/nmeth.2089. [DOI] [PMC free article] [PubMed] [Google Scholar]
- Strohl KP, Thomas AJ, St Jean P, Schlenker EH, Koletsky RJ, Schork NJ. Ventilation and metabolism among rat strains. Journal of Applied Physiology. 1997;82:317–323. doi: 10.1152/jappl.1997.82.1.317. [DOI] [PubMed] [Google Scholar]
- Treppo S, Mijailovich SM, Venegas JG. Contributions of pulmonary perfusion and ventilation to heterogeneity in V(A)/Q measured by PET. Journal of Applied Physiology. 1997;82:1163–1176. doi: 10.1152/jappl.1997.82.4.1163. [DOI] [PubMed] [Google Scholar]
- Tsukimoto K, Arcos JP, Schaffartzik W, Wagner PD, West JB. Effect of common dead space on VA/Q distribution in the dog. Journal of Applied Physiology. 1990;68:2488–2493. doi: 10.1152/jappl.1990.68.6.2488. [DOI] [PubMed] [Google Scholar]
- Van Beek JH, Roger SA, Bassingthwaighte JB. Regional myocardial flow heterogeneity explained with fractal networks. The American journal of physiology. 1989;257:H1670–1680. doi: 10.1152/ajpheart.1989.257.5.H1670. [DOI] [PMC free article] [PubMed] [Google Scholar]
- Vincent L, Soille P. Watersheds in digital spaces: an efficient algorithm based on immersion simulations. IEEE Transactions on Pattern Analysis and Machine Intelligence. 1991;13:583–598. [Google Scholar]
- Walker JK, Lawson BL, Jennings DB. Breath timing, volume and drive to breathe in conscious rats: comparative aspects. Respiration physiology. 1997;107:241–250. doi: 10.1016/s0034-5687(96)02520-0. [DOI] [PubMed] [Google Scholar]
- West JB. Regional differences in gas exchange in the lung of erect man. J Appl Physiol. 1962;17:893–898. doi: 10.1152/jappl.1962.17.6.893. [DOI] [PubMed] [Google Scholar]
- Wilson TA, Beck KC. Contributions of ventilation and perfusion inhomogeneities to the VA/Q distribution. Journal of Applied Physiology. 1992;72:2298–2304. doi: 10.1152/jappl.1992.72.6.2298. [DOI] [PubMed] [Google Scholar]
- Yeh HC, Schum GM, Duggan MT. Anatomic models of the tracheobronchial and pulmonary regions of the rat. Anat Rec. 1979;195:483–492. doi: 10.1002/ar.1091950308. [DOI] [PubMed] [Google Scholar]


