Abstract
There has been a surge of interest in biomarkers that can rapidly predict or assess response to psychiatric treatment, as the current standard practice of extended therapeutic trials is often dissatisfying to both clinicians and patients. Electroencephalographic (EEG) biomarkers in particular have been proposed as an inexpensive yet rapid way of determining whether a patient is responding to an intervention, usually before subjective mood improvement occurs. However, even the most well-reported EEG algorithms have not been subjected to independent replication, limiting their clinical generalizability. It is also unclear whether those biomarkers can generalize beyond their original study population, e.g. to patients undergoing somatic treatments for depression. We report here analysis of EEG data from the pivotal OPT-TMS study of transcranial magnetic stimulation (rTMS) for major depressive disorder. In this dataset, previously reported biomarkers of medication response showed no significant correlation with eventual response to rTMS treatment. Furthermore, EEG power in multiple bands measured at baseline and throughout the treatment course did not correlate with or predict either binary (response/nonresponse) or continuous (Hamilton Rating Scale for Depression) outcome measures. While somewhat limited by technical difficulties in data collection, these analyses are adequately powered to detect clinically relevant biomarkers. We believe this highlights a need for wider-scale independent replication of previous EEG biomarkers, both in pharmacotherapy and neuromodulation.
Keywords: Brain stimulation, Biomarkers, Quantitative electroencephalogram, Transcranial magnetic stimulation, Depression
Introduction
It has been proposed that changes in neurochemistry and brain activity (biomarkers) may precede subjective mood changes in depression treatment, and that monitoring baseline or treatmentemergent biomarkers may allow rapid detection of ineffective treatments. Analysisofquantitative electroencephalography (QEEG) has highlighted the alpha and theta bands in particular as potential predictors of response to serotonergic medication [1–4], and transcranial magnetic stimulation (rTMS) [5,6]. One group has proposed an “antidepressant treatment response” (ATR) prediction computed from a simplified frontal montage, and reported that ATR can predict future medication response after patients have received only one week of pharmacotherapy [2,7,8]. These QEEG biomarkers have not been independently validated, nor is it clear whether biomarkers derived in medication trials apply to non-pharmacologic treatments.
Methods
As part of an rTMS depression trial [9], four-lead (Fpz-M1, Fp2-M2) QEEG was collected throughout each treatment session. Before active/sham treatment, a 30-s initial period was collected with subjects' eyes open and fixated on an object in their visual field. The fixation technique reduces subtle eye movements that can contaminate data. We analyzed data from all subjects who completed at least 7 days of treatment with EEG recordings available (n = 180). The Hamilton Rating Scale for Depression (HAMD) was assessed by blinded raters pre-treatment, at the end of 3 weeks of blinded treatment (Phase 1), and again after three further weeks of open-label treatment (Phase 2). For this analysis, we used the results at the end of Phase 2. “Response” to treatment followed the original OPT-TMS definition, a 50% or greater reduction in HAMD by Phase 2 completion.
We analyzed only EEG recorded before active/sham stimulation onset, as detected by the artifact visible in the recordings. Recordings were automatically segmented into 2-s epochs, which were discarded if they exceeded 100 μV or had a rapid rate of voltage change (both signifying muscular artifact); 25% of epochs were retained. We considered the use of a 4-s epoch, but this led to substantially less available data (16% of all epochs, with a particular reduction in the Sham group from 18,092 to 5610). To maximize our power to detect potential biomarkers, and to maintain consistency with prior studies, we therefore performed all analyses with 2-s epochs.
Epochs were mean-removed, smoothed and windowed, then transformed into the frequency domain. Power in alpha (8.5–12 Hz), beta (12–20 Hz), theta (3–8.5 Hz) and total (2–20 Hz) bands was averaged across all epochs in both hemispheres on each day, producing one value in each power band on each day for each subject. Cordance and other multichannel biomarkers could not be computed from this electrode montage. Missing data were imputed by first-observation-carried-backward (at the start), last-observation-carried-forward (at the end of a run), or linear interpolation (in the middle). We divided subjects into “Sham” (all subjects with sham treatment in Phase 1, n = 94; 18,092 epochs), “Response” (active treatment in Phase 1 with response by end of Phase 2, n = 38; 8593 epochs), and “Nonresponse” (active treatment in Phase 1 without response by end Phase 2, n = 48; 11,804 epochs). We only considered active treatment during Phase 1 (as opposed to the open-label Phase 2) because we sought to validate and explore for biomarkers emerging in the first few days of treatment.
To assess whether features present in the baseline (before treatment on the first day) EEG predicted rTMS response, we computed the mean normalized power and peak frequency for each group in each of the alpha, beta, and theta bands. Each parameter was separately tested with a one-way ANOVA for a difference between the three groups. To assess predictive power of the baseline EEG as a whole, we further performed a multiple linear regression using all three power bands and peak frequencies, with change in HAMD from baseline to end Phase 2 as the dependent variable.
For ATR, we computed the two core parameters, α17 and relativeαθ, as per Leuchter et al. [7] for each subject.1 We then performed two-sample Kolmogorov–Smirnov tests for a difference of distributions between groups. Because the combination of ATR factors might be significantly different even if neither individual variable achieved significance, we also computed a multivariate one-way ANOVA with α17 and relativeαθ as dependent variables and responder group as the independent variable. To test whether QEEG parameters in general might change in response to rTMS, we performed a two-way fixed-effects ANOVA for each power band, with EEG power as the dependent variable and responder group and treatment day as independent variables. In all analyses, we normalized by the total EEG power on that day.
Results
ATR algorithm validation
Kolmogorov–Smirnov tests of ATR parameters between groups showed no significant differences between Sham, Response, and Nonresponse groups (P > 0.39 for α17 and P > 0.15 for relativeαθ). MANOVA for a difference between groups in the multivariate space defined by α17 and relativeαθ was also negative, with optimal dimensionality 0 and P = 0.81.
Alternate QEEG features – baseline
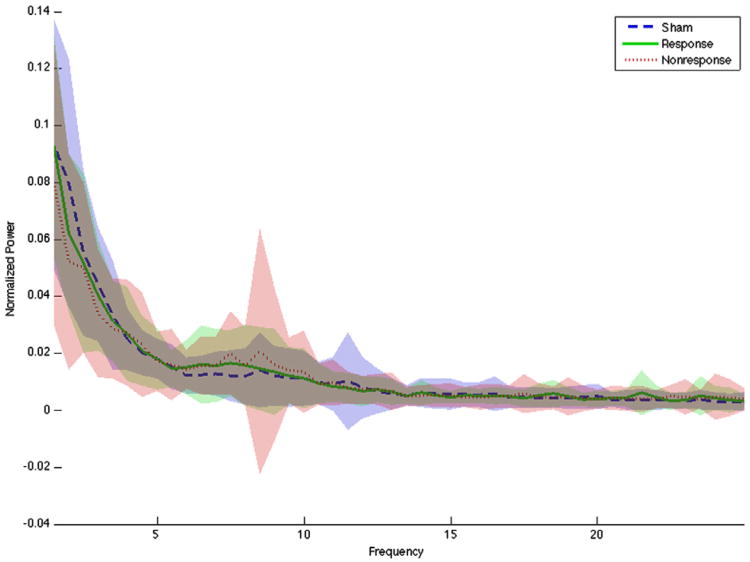
Normalized baseline EEG power spectra for the three groups are shown in Fig.1. Graphically, the spectra do not separate. ANOVAs on the power and peak frequencies in all bands were all non-significant (best for alpha peak frequency, F = 2.08, P = 0.13 uncorrected). Pairwise comparisons (Tukey test) between groups on peak alpha frequency were also non-significant (best Nonresponse vs. Sham, P = 0.07). The regression analysis predicting HAMD change from the combination of all six features was similarly negative, with R2 = 0.024 and P = 0.98.
Figure 1.
Pre-treatment power spectrum for Sham, Response, and Nonresponse groups. Blurred area around each line represents 1 standard deviation. The power distributions at all frequencies overlap, with no clear separation in any defined band for any group.
Alternate QEEG features – treatment-emergent
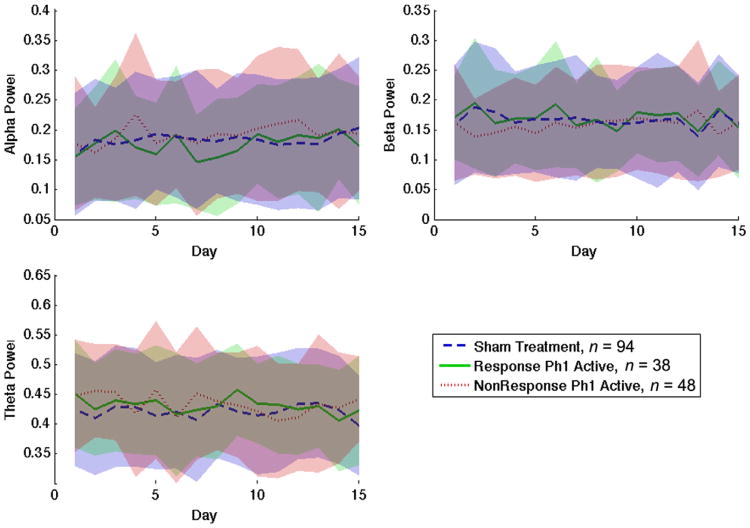
None of the three ANOVAs between responder status and QEEG power bands found any significant effect of responder group or treatment day (F = 3.64, P = 0.057 in the most significant correlation, alpha power vs. treatment day). As seen in Fig. 2, the power traces over the 15 days of this study do not substantially separate from each other.
Figure 2.
Normalized EEG power in alpha, beta, and theta bands over 15 days, separated by treatment/response group. No group shows a clear trend in power change over the course of the experiment. Furthermore, the variance between subjects (indicated by the uncertainty band surrounding each trend line) far exceeds any difference between groups, even after normalization.
Discussion
In this dataset, previously reported QEEG biomarkers, either those present pre-treatment or those emerging during early treatment, did not significantly correlate with clinical improvement as measured by HAMD. This is admittedly a retrospective analysis of EEG data, limited by missing treatment days and variable recording quality. However, 90% of the subjects contributed epochs to the final analyses, comparable to other studies [8]. As such, we cannot explain this negative result solely on the basis of inadequate data. 44% of patients undergoing active rTMS in the blinded Phase 1 study responded, implying that there was enough biological variation for this analysis to be adequately powered. Furthermore, subtle trends for which we are underpowered would likely not be sufficiently strong predictors to be clinically relevant.
Therefore, these data suggest that some previously reported QEEG biomarkers of antidepressant response may not generalize to patients undergoing rTMS. It is less clear how these results inform other QEEG studies, which used measures such as theta-band cordance that could not be computed in this dataset. However, this analysis highlights a need to independently re-replicate QEEG biomarker studies. Advances in neuroimaging and electrophysiology, combined with the increasing availability of computational power, have allowed us to examine an almost infinite space of neural data. Our ability to mine data for correlations is much greater than our ability to confirm that those correlations are more than an accident of statistics, and we as a profession must tread cautiously before promoting any predictive method into general use.
Acknowledgments
The original OPT-TMS trial on which this report is based was supported in part by National Institute of Mental Health grant 5R01MH069929 to Dr. Avery. No supplemental funding was received for this research.
Footnotes
α17 is the absolute power difference in the alpha band between the first and seventh day of treatment; relativeαθ is the sum of theta and alpha band power at the seventh day of treatment, divided by total power on that day.
References
- 1.Bruder GE, Stewart JW, Tenke CE, McGrath PJ, Leite P, Bhattacharya N, et al. Electroencephalographic and perceptual asymmetry differences between responders and nonresponders to an SSRI antidepressant. Biol Psychiatry. 2001;49(5):416–25. doi: 10.1016/s0006-3223(00)01016-7. [DOI] [PubMed] [Google Scholar]
- 2.Iosifescu DV, Greenwald S, Devlin P, Mischoulon D, Denninger JW, Alpert JE, et al. Frontal EEG predictors of treatment outcome in major depressive disorder. Eur Neuropsychopharmacol. 2009;19(11):772–7. doi: 10.1016/j.euroneuro.2009.06.001. [DOI] [PubMed] [Google Scholar]
- 3.Cook IA, Leuchter AF, Morgan ML, Stubbeman W, Siegman B, Abrams M. Changes in prefrontal activity characterize clinical response in SSRI nonresponders: a pilot study. J Psychiatr Res. 2005;39(5):461–6. doi: 10.1016/j.jpsychires.2004.12.002. [DOI] [PubMed] [Google Scholar]
- 4.Bares M, Brunovsky M, Kopecek M, Novak T, Stopkova P, Kozeny J, et al. Early reduction in prefrontal theta QEEG cordance value predicts response to venlafaxine treatment in patients with resistant depressive disorder. Eur Psychiatry. 2008;23(5):350–5. doi: 10.1016/j.eurpsy.2008.03.001. [DOI] [PubMed] [Google Scholar]
- 5.Arns M, Drinkenburg WH, Fitzgerald PB, Kenemans JL. Neurophysiological predictors of non-response to rTMS in depression. Brain Stimul. 2012;5(4):569–76. doi: 10.1016/j.brs.2011.12.003. [DOI] [PubMed] [Google Scholar]
- 6.Micoulaud-Franchi JA, Richieri R, Cermolacce M, Loundou A, Lancon C, Vion-Dury J. Parieto-temporal alpha EEG band power at baseline as a predictor of antidepressant treatment response with repetitive transcranial magnetic stimulation: a preliminary study. J Affect Disord. 2012;137(1–3):156–60. doi: 10.1016/j.jad.2011.12.030. [DOI] [PubMed] [Google Scholar]
- 7.Leuchter AF, Cook IA, Gilmer WS, Marangell LB, Burgoyne KS, Howland RH, et al. Effectiveness of a quantitative electroencephalographic biomarker for predicting differential response or remission with escitalopram and bupropion in major depressive disorder. Psychiatry Res. 2009;169(2):132–8. doi: 10.1016/j.psychres.2009.04.004. [DOI] [PubMed] [Google Scholar]
- 8.Leuchter AF, Cook IA, Marangell LB, Gilmer WS, Burgoyne KS, Howland RH, et al. Comparative effectiveness of biomarkers and clinical indicators for predicting outcomes of SSRI treatment in major depressive disorder: results of the BRITE-MD study. Psychiatry Res. 2009;169(2):124–31. doi: 10.1016/j.psychres.2009.06.004. [DOI] [PubMed] [Google Scholar]
- 9.George MS, Lisanby SH, Avery D, McDonald WM, Durkalski V, Pavlicova M, et al. Daily left prefrontal transcranial magnetic stimulation therapy for major depressive disorder: a sham-controlled randomized trial. Arch Gen Psychiatry. 2010;67(5):507–16. doi: 10.1001/archgenpsychiatry.2010.46. [DOI] [PubMed] [Google Scholar]


