Abstract
Osteoporotic vertebral fractures are an increasingly active area of research. Oftentimes assessments are performed by software-assisted quantitative morphometry. Here, we will discuss multi-functionality of these data for research purposes. A team of trained research assistants processed lateral spine radiographs from the population-based Rotterdam Study with SpineAnalyzer® software (Optasia Medical Ltd, Cheadle, UK). Next, the raw coordinate data of the two upper corners of Th5 and the two lower corners of Th12 were extracted to calculate the Cobb’s kyphosis angle. In addition, two readers performed independent manual measurements of the Cobb’s kyphosis angle between Th5 and Th12 for a sample (n=99). The mean kyphosis angle and its standard deviation were 53° and 10° for the SpineAnalyzer® software measurements and 54° and 12° by manual measurements, respectively. The Pearson’s correlation coefficient was 0.65 [95% confidence interval (CI): 0.53-0.75; P=2×10–13]. There was a substantial intraclass correlation with a coefficient of 0.64 (95% CI: 0.51-0.74). The mean difference between methods was 1° (95% CI: –2°-4°), with 95% limits of agreement of –20°-17° and there were no systematic biases. In conclusion, vertebral fracture morphometry data can be used to derive the Cobb’s kyphosis angle. Even more quantitative measures could be derived from the raw data, such as vertebral wedging, intervertebral disc space, spondylolisthesis and the lordosis angle. These measures may be of interest for research into musculoskeletal disorders such as osteoporosis, degenerative disease or Scheuermann’s disease. Large-scale studies may benefit from efficient capture of multiple quantitative measures in the spine.
Keywords: Vertebral fracture, quantitative, morphometry, osteoporosis, degenerative disease, spine, software, post-processing
Introduction
The complaint of back pain is highly prevalent and is among the most common medical conditions (1). These pain symptoms may impair function and movement of the spinal column, and therefore, back pain is one of the main reasons for healthcare expenditure around the world (2). Nevertheless, no specific pathology can be identified in up to 85% of patients (3), as currently employed imaging biomarkers display very limited correlation with symptoms (1,2,4) and a better understanding of spine pathology is necessary.
Vertebral fractures are the most common osteoporotic fractures and represent a significant health issue (5) as they are associated with a loss of quality of life (6), mortality (7) and a considerable financial burden (8,9). Hyperkyphosis, i.e., excessive curvature of the spine in the sagittal (anterioposterior) plane, is associated with advanced age (10) and is commonly attributed to osteoporotic vertebral fractures (11). Additionally, the kyphosis angle is independently associated with decreased mobility, increased propensity to fall and mortality (12,13). Other differential diagnoses that display wedging of vertebral bodies, i.e., structural changes involving loss of anterior height, are anatomical variation, degenerative changes or Scheuermann’s disease (14,15).
Osteoporotic vertebral fractures are an increasingly active area of research, especially in the light of the aging of populations. Oftentimes the presence of spine fractures is assessed by means of software-assisted quantitative morphometry (16), which can automatically identify vertebral body margins on digital radiography, dual energy X-ray absorptiometry and computed tomography. Some of these software packages allow saving of the quantitative spatial information, for example SpineAnalyzer® software (Optasia Medical Ltd, Cheadle, UK). This data could be used to derive more quantitative measures than osteoporotic vertebral fractures, such as vertebral wedging, dimensions of the intervertebral disc space, spondylolisthesis, kyphosis and lordosis. In this brief report we present an added functionality of these quantitative data for research purposes, illustrated by the example of the Cobb’s kyphosis angle.
Materials and methods
Study sample
The Rotterdam Study is a prospective population-based cohort studying the determinants of chronic diseases, including osteoporosis, and disability in Dutch men and women. Both the objectives and the study design have been described previously (17). It includes 14,926 inhabitants aged 45 years and over of Rotterdam city’s Ommoord district in The Netherlands. The present report describes results obtained from the Rotterdam Study-III cohort baseline visit, which started follow-up in 2006. The Medical Ethics Committee of the Erasmus University Medical Center has approved the Rotterdam Study.
Radiographic assessments
During the periodical research center visits, radiographic examinations of the spine were obtained using a digitized Fuji Computed Radiography system (FUJIFILM Medical Systems). All radiographs were acquired digitally according to a standardized protocol, with a focus to detector distance of 120 cm. A team of trained research assistants processed lateral spine radiographs (vertebral levels Th4-L4) with SpineAnalyzer® software (Optasia Medical Ltd, Cheadle, UK) (18). SpineAnalyzer® software can automatically identify vertebral body margins on digital radiography, determine the exact heights of the vertebrae, and calculate the shape and degree of height reduction. After labeling the vertebrae of interest by placing thirteen points at the center of each vertebral body from Th4 to L4, the software will automatically outline each labeled vertebra with six morphometry points, corresponding to the four corners of the vertebral body, as well as the mid-point of the superior and inferior endplate. The analyst can make manual adjustments to these six morphometry points to fine-tune their exact locations for accurate measurements, and thereafter, the pixel coordinates of these points are saved. We extracted the raw coordinate data of the two upper corners of Th5 and the two lower corners of Th12 to calculate the Cobb’s kyphosis angle. For comparison, two readers (A.A.M. and S.S.) performed independent manual measurements of the Cobb’s kyphosis angle between Th5 and Th12 (Figure 1) for a sample of n=99, which had vertebral wedging at a minimum of three levels and presence of vertebral body endplate irregularities, as described previously (19). The analyses presented in this report concern the sample of n=99 subjects analyzed with both SpineAnalyzer® and the manual measurements of the Cobb’s kyphosis angle between Th5 and Th12.
Figure 1.
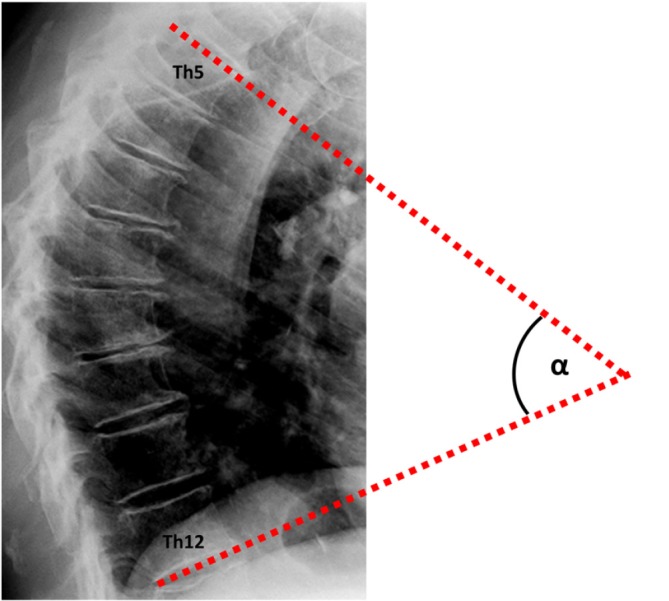
Measurement of the Cobb’s kyphosis angle (α) between Th5 and Th12.
Statistical analysis
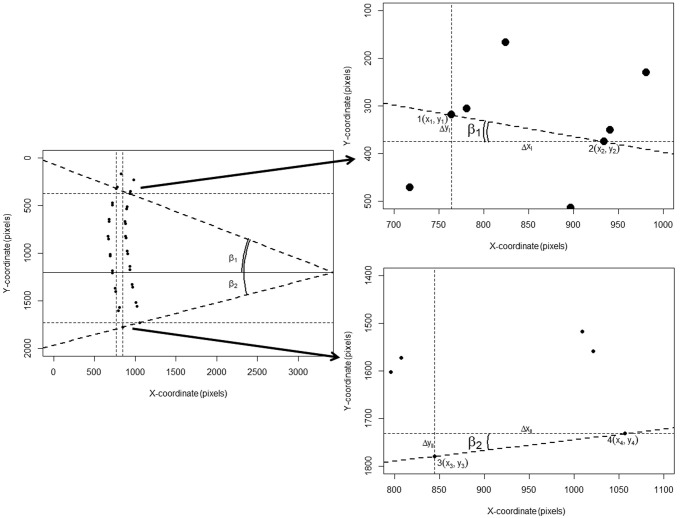
The Cobb’s kyphosis angle was calculated from the raw coordinates by the formula: α=β1+β2 = arctan(∆yI/∆xI) + arctan(∆yII/∆xII) = arctan[(y1–y2)/(x1–x2)] + arctan[(y3–y4)/(x3–x4)] (Figure 2). We computed the Pearson’s correlation coefficient r and corresponding t-test statistic between the calculations derived from the SpineAnalyzer® software and the manual measurements for the Cobb’s kyphosis angle. In addition, the intraclass correlation coefficient (two way mixed, consistency and agreement) with the matching F-test statistic was determined and classified according to Landis and Koch (20). Finally, we evaluated if the differences between measurements was different from 0 by a t-test and mapped the results in a Bland-Altman plot including calculation of the interval between the 95% limits of agreement by taking the mean difference plus and minus 2 standard deviations (21) to further evaluate the agreement between the measurements. SPSS statistics software version 20 (IBM, Armonk, NY, USA) and R software version 3.0.1 (R Foundation for Statistical Computing, Vienna, Austria) were used for the analyses.
Figure 2.
X-Y coordinate plot in pixels of vertebral levels Th4-Th12 (left panel); zoom-in focused on Th5 (upper right panel) and zoom-in focused on Th12 (bottom right panel). Calculation of the Cobb’s kyphosis angle (α) between Th5 and Th12 from vertebral fracture morphometry analyses coordinates. The Cobb’s kyphosis angle (denoted as α) was calculated from the raw coordinates by the formula: α=β1 + β2 shown in the left panel; in the upper right panel it is shown that β1 = arctan(∆yI/∆xI) = arctan[(y1–y2)/(x1–x2)] and in the bottom right panel it is shown that β2 = arctan(∆yII/∆xII) = arctan[(y3–y4)/(x3–x4)].
Results
The mean kyphosis angle between the superior endplate of Th5 and the inferior endplate of Th12 of the sample as determined by the SpineAnalyzer® software measurements was 53° with a standard deviation of 10° and the mean kyphosis angle by manual measurements was 54° with a standard deviation of 12°. The Pearson’s correlation coefficient r between the manual measurements and the calculations derived from the SpineAnalyzer® software was 0.65 [95% confidence interval (CI): 0.53-0.75; P=2×10–13] (Figure 3). There was a substantial intraclass correlation with a coefficient of 0.64 for both consistency and absolute agreement (95% CI: 0.51-0.74 P=5×10–13 and P=4×10–13, respectively). The mean difference between methods was 1° (95% CI: –2°-4°) and not different from 0 (P=0.4). The interval between the 95% limits of agreement was –20°-17° where approximately half the individuals (47%) showed a difference of less than 5° and about three quarters less than 10° between the techniques (76%). The Bland-Altman plot did not show systematic biases of proportional error, dependency of variation on the magnitude of measurements, extreme outliers, systematic under- or overestimation (Figure 4).
Figure 3.
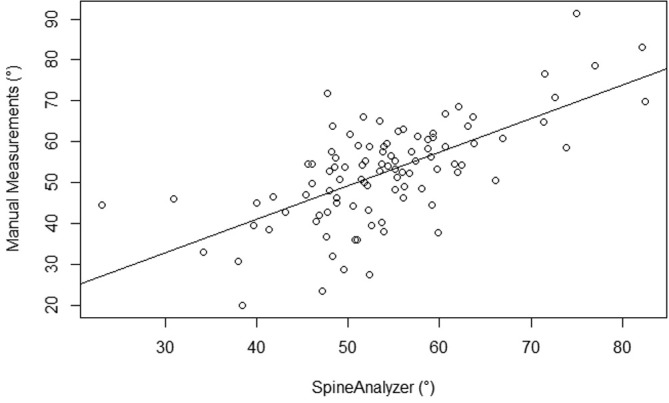
Correlation between the manual measurements (X-axis) and the calculations derived from the SpineAnalyzer® software (Y-axis) of the Cobb’s kyphosis angle in degrees between Th5 and Th12; Pearson’s correlation coefficient r=0.65 [95% confidence interval (CI): 0.53-0.75; P=2×10–13].
Figure 4.
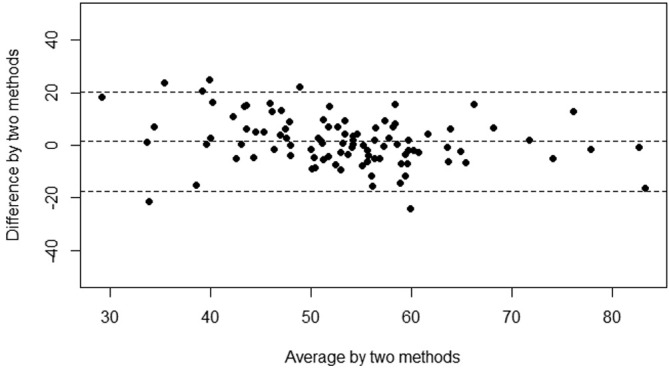
Bland-Altman plot of the average of (X-axis) and the mean difference (Y-axis) of the manual measurements minus the calculations derived from the SpineAnalyzer® software of the Cobb’s kyphosis angle in degrees. The dashed lines represent the mean plus two standard deviations and the mean minus two standard deviations, respectively.
Discussion
In the present study we have shown that quantitative vertebral morphometry data derived from lateral spine radiographs from the population-based Rotterdam Study with SpineAnalyzer® software can be used to calculate the Cobb’s kyphosis angle. The agreement of this method with independent manual measurements was substantial and there were no systematic biases.
There have been multiple publications comparing different methods for the measurement of Cobb’s kyphosis angle and reports of the inter-observer variation. Our results are comparable, but with somewhat lower inter-observer agreement, with the findings of previous comparative studies of other methods for kyphosis angle measurement (22-24). However, the interval between the 95% limits of agreement we found in our study sample was rather broad, which is an indication of how far apart measurements by the two methods were for most individuals and this limits clinical applicability. It has previously been found that measurement error is primarily due to intra-observer error rather than inter-observer error (25).
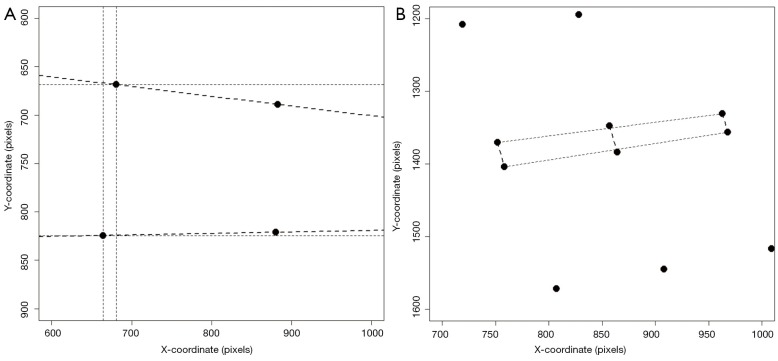
There are several commercially available software packages available for vertebral quantitative morphometry, of which we applied SpineAnalyzer®. A variety of custom or in-house developed software tools are also being used in the research community. These software algorithms do not always exploit automated vertebral detection, but this is not a requirement for our method to calculate Cobb’s angle. Even when vertebral body identification is performed manually, the calculation as presented in this paper is possible, provided that the exact pixel coordinates of the superior endplate of Th5 and inferior endplate of Th12 are available. In addition to kyphosis measurement, more quantitative measures could be derived from the raw morphometry data, such as vertebral wedging (26,27), intervertebral disc space (28-30) (Figure 5) and the lordosis angle (31). Several methods for the assessment of the dimensions of the intervertebral disc space have been proposed and comprise calculations with the measurements of anterior, central and posterior distances between vertebral endplate, disc diameter and disc areas (29); in addition, inter-vertebral disc angles can be computed. Theoretically, measures of spondylolisthesis could be derived, although obtaining flexion-extension films might be preferable. These measures may be of interest to researchers investigating musculoskeletal disorders such as osteoporosis, degenerative disease or Scheuermann’s disease. Extending the work flow to more vertebral levels and to capture more detailed morphological shapes is desirable. For example, the lumbar lordosis angle is usually calculated between Th12 and S1 or L5 (31), lumbar disc degeneration is most commonly observed at L4-L5 and L5-S1 (32) and spondylolisthesis is most prevalent at levels L4-L5 and L5-S1 as well (33), which would in fact be the most interesting levels to study from the perspective of degeneration. These levels are, however, usually disregarded by most vertebral morphometry software packages for osteoporotic fractures, because these fractures are rare in the lower lumbar spine. Moreover, information on endplate fractures, Schmorl’s nodes and osteophytes cannot be inferred from six point morphometry data, but Spineanalyzer® offers additional 95 points morphometry. However, this registration of 95 points per vertebra has not been studied and validated comprehensively yet and extra manual adjustments of the point placements on the radiographs may be necessary. A limitation of morphometry analyses is that it would not be able to capture qualitative imaging features such as vertebral endplate irregularities and diffuse idiopatic skeletal hyperostosis (DISH). Shortcomings of 2-dimensional radiographical imaging in the current context include failure to represent soft tissues, distortion due to oblique projection of the conical X-ray beams (28) and superimposition of overlying anatomical structures like the shoulder girdle, the iliac wings of the pelvis, the ribs and pulmonary vasculature.
Figure 5.
Deriving parameters of vertebral wedging (upper panel, current example concerns wedging of Th7) and intervertebral disc space height (bottom panel, current example concerns the intervertebral disc space between Th10 and Th11).
Large-scale studies may benefit from efficient capture of multiple quantitative measures in the spine. In the future we intend to perform large-scale epidemiological studies with these data in the Rotterdam Study, for example to explore the etiology and associations with health outcomes of degenerative changes. The etiology of these spine diseases is largely unknown. Heritability plays a significant role in various spine diseases with estimates ranging between ~19% and 74% (34,35). A better understanding of the genetic susceptibility and epidemiological risk factors for spine diseases has the potential to identify underlying biological mechanisms, improve risk prediction and lead to novel disease interventions.
In conclusion, utilization of vertebral fracture morphometry data to derive the Cobb’s kyphosis angle is relatively reliable. Even more quantitative measures could be derived from the raw data, such as vertebral wedging, intervertebral disc space, spondylolisthesis and the lordosis angle, and these parameters may be of interest to research into different musculoskeletal disorders such as osteoporosis or degenerative disease. Efficient capture of multiple quantitative measures in the spine may particularly benefit high-throughput studies and these investigations could contribute to a deeper understanding of spine conditions.
Acknowledgements
The Rotterdam Study is funded by Erasmus Medical Center and Erasmus University, Rotterdam, Netherlands Organization for the Health Research and Development (ZonMw), the Research Institute for Diseases in the Elderly (014-93-015; RIDE2), RIDE), the Ministry of Education, Culture and Science, the Ministry for Health, Welfare and Sports, the European Commission (DG XII), and the Municipality of Rotterdam. The authors are grateful to the study participants and the staff from the Rotterdam Study. We thank René Vermeren, Edward Peters, Nano Suwarno and Mart Rentmeester fort their technical support. Last but not least, we acknowledge the tremendous efforts from our team of radiographic readers.
Disclosure: The authors declare no conflict of interest.
References
- 1.Koes BW, van Tulder MW, Thomas S. Diagnosis and treatment of low back pain. BMJ 2006;332:1430-4 [DOI] [PMC free article] [PubMed] [Google Scholar]
- 2.Henschke N, Maher CG, Ostelo RW, et al. Red flags to screen for malignancy in patients with low-back pain. Cochrane Database Syst Rev 2013;2:CD008686. [DOI] [PMC free article] [PubMed] [Google Scholar]
- 3.Deyo RA, Rainville J, Kent DL. What can the history and physical examination tell us about low back pain? JAMA 1992;268:760-5 [PubMed] [Google Scholar]
- 4.Williams CM, Henschke N, Maher CG, et al. Red flags to screen for vertebral fracture in patients presenting with low-back pain. Cochrane Database Syst Rev 2013;1:CD008643. [DOI] [PubMed] [Google Scholar]
- 5.Szulc P, Bouxsein ML. Overview of osteoporosis: epidemiology and clinical management. Vertebral Fracture Initiative Resource Document 2011;PART I:1-65.
- 6.Gold DT. The clinical impact of vertebral fractures: quality of life in women with osteoporosis. Bone 1996;18:185S-189S [DOI] [PubMed] [Google Scholar]
- 7.Ensrud KE, Thompson DE, Cauley JA, et al. Prevalent vertebral deformities predict mortality and hospitalization in older women with low bone mass. Fracture Intervention Trial Research Group. J Am Geriatr Soc 2000;48:241-9 [DOI] [PubMed] [Google Scholar]
- 8.Burge R, Dawson-Hughes B, Solomon DH, et al. Incidence and economic burden of osteoporosis-related fractures in the United States, 2005-2025. J Bone Miner Res 2007;22:465-75 [DOI] [PubMed] [Google Scholar]
- 9.Ström O, Borgström F, Kanis JA, et al. Osteoporosis: burden, health care provision and opportunities in the EU: a report prepared in collaboration with the International Osteoporosis Foundation (IOF) and the European Federation of Pharmaceutical Industry Associations (EFPIA). Arch Osteoporos 2011;6:59-155 [DOI] [PubMed] [Google Scholar]
- 10.Fon GT, Pitt MJ, Thies AC., Jr Thoracic kyphosis: range in normal subjects. AJR Am J Roentgenol 1980;134:979-83 [DOI] [PubMed] [Google Scholar]
- 11.Katzman WB, Vittinghoff E, Kado DM. Age-related hyperkyphosis, independent of spinal osteoporosis, is associated with impaired mobility in older community-dwelling women. Osteoporos Int 2011;22:85-90 [DOI] [PMC free article] [PubMed] [Google Scholar]
- 12.Katzman WB, Wanek L, Shepherd JA, et al. Age-related hyperkyphosis: its causes, consequences, and management. J Orthop Sports Phys Ther 2010;40:352-60 [DOI] [PMC free article] [PubMed] [Google Scholar]
- 13.Kado DM, Lui LY, Ensrud KE, et al. Hyperkyphosis predicts mortality independent of vertebral osteoporosis in older women. Ann Intern Med 2009;150:681-7 [DOI] [PMC free article] [PubMed] [Google Scholar]
- 14.Scheuermann HW. The classic: kyphosis dorsalis juvenilis. Clin Orthop Relat Res 1977;(128):5-7 [PubMed] [Google Scholar]
- 15.Jiang G, Eastell R, Barrington NA, et al. Comparison of methods for the visual identification of prevalent vertebral fracture in osteoporosis. Osteoporos Int 2004;15:887-96 [DOI] [PubMed] [Google Scholar]
- 16.Oei L, Rivadeneira F, Ly F, et al. Review of radiological scoring methods of osteoporotic vertebral fractures for clinical and research settings. Eur Radiol 2013;23:476-86 [DOI] [PubMed] [Google Scholar]
- 17.Hofman A, van Duijn CM, Franco OH, et al. The Rotterdam Study: 2012 objectives and design update. Eur J Epidemiol 2011;26:657-86 [DOI] [PMC free article] [PubMed] [Google Scholar]
- 18.Brett A, Miller CG, Hayes CW, et al. Development of a clinical workflow tool to enhance the detection of vertebral fractures: accuracy and precision evaluation. Spine (Phila Pa 1976) 2009;34:2437-43. [DOI] [PubMed]
- 19.Makurthou AA, Oei L, Saddy SE, et al. Scheuermann’s Disease: Evaluation of Radiological Criteria and Population Prevalence. Spine (Phila Pa 1976) 2013. [Epub ahead of print]. [DOI] [PubMed]
- 20.Landis JR, Koch GG. The measurement of observer agreement for categorical data. Biometrics 1977;33:159-74 [PubMed] [Google Scholar]
- 21.Bland JM, Altman DG. Statistical methods for assessing agreement between two methods of clinical measurement. Lancet 1986;1:307-10 [PubMed] [Google Scholar]
- 22.de Oliveira TS, Candotti CT, La Torre M, et al. Validity and reproducibility of the measurements obtained using the flexicurve instrument to evaluate the angles of thoracic and lumbar curvatures of the spine in the sagittal plane. Rehabil Res Pract 2012;2012:186156. [DOI] [PMC free article] [PubMed]
- 23.Chaise FO, Candotti CT, Torre ML, et al. Validation, repeatability and reproducibility of a noninvasive instrument for measuring thoracic and lumbar curvature of the spine in the sagittal plane. Rev Bras Fisioter 2011;15:511-7 [DOI] [PubMed] [Google Scholar]
- 24.Goh S, Price RI, Leedman PJ, et al. A comparison of three methods for measuring thoracic kyphosis: implications for clinical studies. Rheumatology (Oxford) 2000;39:310-5 [DOI] [PubMed] [Google Scholar]
- 25.Carman DL, Browne RH, Birch JG. Measurement of scoliosis and kyphosis radiographs. Intraobserver and interobserver variation. J Bone Joint Surg Am 1990;72:328-33 [PubMed] [Google Scholar]
- 26.Crawford MB, Toms AP, Shepstone L. Defining normal vertebral angulation at the thoracolumbar junction. AJR Am J Roentgenol 2009;193:W33-7. [DOI] [PubMed] [Google Scholar]
- 27.Gaca AM, Barnhart HX, Bisset GS., 3rd Evaluation of wedging of lower thoracic and upper lumbar vertebral bodies in the pediatric population. AJR Am J Roentgenol 2010;194:516-20 [DOI] [PubMed] [Google Scholar]
- 28.Hurxthal LM. Measurement of anterior vertebral compressions and biconcave vertebrae. Am J Roentgenol Radium Ther Nucl Med 1968;103:635-44 [DOI] [PubMed] [Google Scholar]
- 29.Pope MH, Hanley EN, Matteri RE, et al. Measurement of intervertebral disc space height. Spine 1977;2:282-6 [Google Scholar]
- 30.Farfan HF. eds. Mechanical disorders of the low back. Philadelphia: Lea & Febiger, 1973:62-92. [Google Scholar]
- 31.Hwang JH, Modi HN, Suh SW, et al. Reliability of lumbar lordosis measurement in patients with spondylolisthesis: a case-control study comparing the Cobb, centroid, and posterior tangent methods. Spine (Phila Pa 1976) 2010;35:1691-700. [DOI] [PubMed]
- 32.Toyone T, Takahashi K, Kitahara H, et al. Vertebral bone-marrow changes in degenerative lumbar disc disease. An MRI study of 74 patients with low back pain. J Bone Joint Surg Br 1994;76:757-64 [PubMed] [Google Scholar]
- 33.Hirano K, Imagama S, Matsuyama Y, et al. Surgically treated cases of lumbar spondylolysis and isthmic spondylolisthesis: a multicenter study. J Spinal Disord Tech. 2013 doi: 10.1097/BSD.0b013e31827f4321. [Epub ahead of print] [DOI] [PubMed] [Google Scholar]
- 34.Damborg F, Engell V, Andersen M, et al. Prevalence, concordance, and heritability of Scheuermann kyphosis based on a study of twins. J Bone Joint Surg Am 2006;88:2133-6 [DOI] [PubMed] [Google Scholar]
- 35.Liu CT, Karasik D, Zhou Y, et al. Heritability of prevalent vertebral fracture and volumetric bone mineral density and geometry at the lumbar spine in three generations of the Framingham study. J Bone Miner Res 2012;27:954-8 [DOI] [PMC free article] [PubMed] [Google Scholar]


