Abstract
The introduction of novel immunomodulatory drugs (IMiDs) has dramatically improved the survival of patients with multiple myeloma (MM). While it has been shown that patients with specific cytogenetic subtypes, namely t(4;14), have the best outcomes when treated with bortezomib-based regimens, the relationship between cytogenetic subtypes and response to IMiDs remains unclear. Using DNA synthesis assays, we investigated the relationship between cytogenetic subtype and lenalidomide response in a representative panel of human myeloma cell lines (HMCLs). We examined HMCL protein expression levels of the lenalidomide target cereblon (CRBN) and its downstream target interferon regulatory factor 4 (IRF4), which have previously been shown to be predictive of lenalidomide response in HMCLs. Our results reveal that lenalidomide response did not correlate with specific cytogenetic translocations. There were distinct groups of lenalidomide-responsive and non-responsive HMCLs, as defined by inhibition of cellular proliferation; notably, all of the hyperdiploid HMCLs fell into the latter category. Repeated dosing of lenalidomide significantly lowered the IC50 of the responsive HMCL ALMC-1 (IC50 = 2.6 μM versus 0.005 μM, p<0.0001), but did not have an effect on the IC50 of the non-responsive DP-6 HMCL (p>0.05). Moreover, no association was found between lenalidomide responsiveness and CRBN and IRF4 expression. Our data indicate that lenalidomide sensitivity is independent of cytogenetic subtype in HMCLs. While CRBN and IRF4 have been shown to be associated with response to lenalidomide in patients, these findings do not translate back to HMCLs, which could be attributable to factors present in the bone marrow microenvironment.
Keywords: Cytogenetics, multiple myeloma, lenalidomide, CRBN, IRF4
Introduction
Multiple myeloma (MM) is a plasma cell malignancy that presents with great heterogeneity in molecular characteristics, clinical presentation, and treatment response. Upon diagnosis, karyotyping and fluorescence in situ hybridization (FISH) testing are routinely performed on bone marrow aspirates from patients to assess whether the malignant plasma cells contain one of the six primary cytogenetic abnormalities typically associated with the disease (1). While MM is clinically considered a single disease, it actually represents a collection of cytogenetically distinct diseases (2). Each of these cytogenetic subtypes is associated with disease prognosis and risk of progression. For instance, individuals with a t(11;14) or t(6;14) translocation have a median overall survival of 7-10 years, as compared to those with a t(14;16) or t(14;20) translocation, who have a median overall survival of 2-3 years, even with the best therapy (3). Additional investigations into these disease subtypes have revealed differences in response to treatment with specific therapeutic agents. For example, patients with the t(4;14) translocation achieve the best response when treated with induction therapy involving the addition of bortezomib, a proteasome inhibitor, rather than other single agents (4-7). These clinically observed differences in treatment response demonstrate the potential for stratified medicine via treatment of patients by molecular subtype; however, a deeper understanding of the behavior of each of these cytogenetic subtypes in response to specific therapeutic agents is required in order to develop an effective treatment paradigm (8).
The development and implementation of novel therapeutic agents, such as immunomodulatory drugs (IMiDs), has led to a drastic improvement in treatment response and survival in MM patients over the past ten years (9). These agents, such as the thalidomide analog lenalidomide, are paired with dexamethasone and frequently administered as first-line treatment in newly diagnosed MM patients (10). The combination of the increased efficacy of these agents, coupled with the ease of oral administration and reduced toxicity levels, make these treatments ideal for many patients.
The precise mechanism of action of IMiDs remains poorly understood, as these compounds have been shown to operate through various means, including modulating the immune system, interfering with stromal cell growth factor expression, and inducing cell cycle arrest at the G0/G1 checkpoint (11-13). It was only recently that cereblon (CRBN) was identified as the direct binding target of lenalidomide (14). CRBN, in combination with damaged DNA binding protein 1 (DDB1) and Cullin-4 (CUL4), make up an E3 ubiquitin ligase, which aids in regulating several different key cellular events. Investigations have shown a strong association between downregulation of CRBN and lenalidomide resistance in human myeloma cell lines (HMCLs); conversely, improved response to lenalidomide has also been shown to be associated with increased expression of CRBN (15-17). The expression of interferon regulatory factor 4 (IRF4), thought to be a downstream target of CRBN, has been demonstrated to have similar predictive value (16-18).
The utility of CRBN and IRF4 expression as predictors of IMiD resistance, specifically lenalidomide resistance, is of great interest for clinical application. The few studies that have investigated CRBN expression in newly diagnosed multiple myeloma patients found downregulation of CRBN in patients resistant to treatment with lenalidomide (15, 17, 18). Only one study to date has examined the association between CRBN and clinical outcome in patients. A significant association was found between expression of both CRBN and IRF4 at time of diagnosis and response in 49 patients treated with a lenalidomide-dexamethasone regimen; whether CRBN and IRF4 expression are associated with other clinical characteristics has yet to be determined (17). In this study, we sought to investigate whether an association exists between cytogenetic subtype and lenalidomide response in a panel of HCMLs representative of the six cytogenetic abnormalities commonly found in MM. Furthermore, we examined the expression of both CRBN and IRF4 in these cell lines, along with studies of cell cycle arrest and apoptosis levels to assess possible differences in mechanism of action between subtypes.
Methods
Cell Lines and Culture Medium
The HMCLs ANBL-6, JMW, ALMC-1, ALMC-2, DP-6, KP-6, and RM43 were all derived in our laboratory (Table 1) (19-21). The IL-6 independent HMCL U266 was purchased from ATCC (Manassas, VA, USA). The HMCL KMM1 was kindly provided to us by Dr. Marta Chesi (Mayo Clinic, Scottsdale, AZ). All HMCLs were maintained in Iscove's Modified Dulbecco's media supplemented with 50 U/ml penicillin G, 100 μg/ml streptomycin (Invitrogen, Carlsbad, CA, USA), recombinant IL-6 at a final concentration of 1 ng/ml (Novartis, Basel, Switzerland), and 5% heat-inactivated fetal calf serum (PAA Laboratories, Etobicoke, Ontario, Canada). Exceptions were HMCLs KMM-1 and U266, which are IL-6 independent and were maintained in RPMI with the same supplementation regimen without added IL-6.
Table 1.
Cell lines, cytogenetic subtypes, and lenalidomide response as determined by [3H]-thymidine proliferation assays. For response classification, “R” indicates a lenalidomide responsive cell line; “UR” indicates a non-responsive cell line.
| Cytogenetic Subtype | Cell Line | Calculated IC50 with IL-6 (μM) (95% C.I.) | Response Classification |
|---|---|---|---|
| Hyperdiploid MM | KP-6 | 13.31 (6.297, 28.14) | UR |
| DP-6 | N/A | UR | |
| DT-6I | 5.211 (1.338, 20.3) | UR | |
| t(11;14) MM | RM43 | N/A | UR* |
| U266 | 0.521 (0.318, 0.852) | R | |
| t(4;14) MM | JMW | 1.049 (0.734, 1.499) | R |
| t(14;16) MM | ANBL-6 | 3.036 (1.786, 5.163) | R |
| t(6;14) MM | KMM-1 | N/A | UR |
| t(14;20) MM | ALMC-1 | 2.608 (1.074, 6.332) | R |
| ALMC-2 | 1.199 (0.799, 1.801) | R |
RM43 is classified as “R” without the addition of IL-6; however, in the presence of added IL-6, its classification is changed to “UR.” (See Figure 1B)
Cellular Proliferation Assays
Tritiated thymidine (3H-TdR) incorporation assays were used as previously described to establish dose-response curves and to determine the half maximal inhibitory concentrations (IC50s) of single-dose lenalidomide (SelleckChem , Houston, TX, USA) for each cell line (22). HMCLs were cultured at a concentration of 0.125 × 10⁶ cells/mL in triplicate in 96-well flat bottom plates in either Iscove's Modified Dulbecco's media or RPMI (see previously described culturing conditions), with the addition of 1 ng/ml IL-6 and 5% heat-inactivated fetal calf serum and maintained at 37 °C in the presence of 5% CO2. Lenalidomide was administered at plating (0 hours) with doses ranging from 0.00001 to 50 μM. Tritiated thymidine (3H-TdR; 5.0 Ci/mmol, Amersham, Piscataway, NJ, USA) was added at 80 hours post-plating. Cells were harvested at 96 hours using a semiautomatic cell harvester (Skatron, Tranby, Norway) and DNA synthesis measured using a Beckman scintillation counter. Cell lines were classified as “responsive” if they achieved an IC50 of 10 μM or less, and if their 95% confidence interval did not contain 10 μM; cell lines for which an IC50 of greater than 10 μM was found, for which 10 μM was included in the 95% confidence interval, or for which an IC50 could not be estimated, were classified as “non-responsive.” We selected 10 μM as the cutoff based on published literature from pharmacokinetic studies of lenalidomide in patients with renal failure (23).
In some experiments, we tested the effects of repeated dosing of lenalidomide. In these experiments, lenalidomide was administered at 0, 24, 48 and 72 hours. Each tested dose was added in the same volume every 24 hours. Control cultures received vehicle controls of the same volume at each time point. Tritiated thymidine was added at 80 hours post-plating. Cells were harvested at 96 hours and DNA synthesis measured.
To test whether the cells that remained after four days of treatment with lenalidomide were resistant to the drug, lenalidomide-responsive ALMC-1 and U266 cells were incubated for four days with 10 μM lenalidomide (culture conditions earlier described). Cells were re-cultured and single-dose lenalidomide experiments were repeated as outlined earlier for each cell line. Tritiated thymidine was added at 80 hours post-plating. Cells were harvested at 96 hours and DNA synthesis measured.
Cell Viability and Survival Assays
Trypan blue exclusion was utilized to determine cell viability after 72 and 120 hours of treatment with a single 1 μM dose of lenalidomide. For both apoptosis and cell cycle analysis assays, cells were cultured in the previously described conditions in a final volume of 2 mL in Costar (Corning Inc., Corning, NY, USA) 24-well plates for 96 hours prior to collection. Apoptosis of cells treated with a single 1 μM dose of lenalidomide at 0 hours was assessed via staining with AnnexinV/7-AAD using flow cytometry. Cell cycle analysis was conducted using propidium iodide and analyzed using a FACStar (BD Biosciences, San Diego, CA, USA). Results were analyzed using FlowJo software (TreeStar, Inc., Ashland, OR).
Western Blot Analysis
Western blot analysis was performed as previously described (24). The blot was probed with an anti-CRBN antibody (ProteinTech Group, Inc., Chicago, IL, USA) at a 1:1000 dilution; anti-IRF4 (GeneTex, Inc., Irvine, CA, USA) at a 1:750 dilution; or anti-β-actin antibody (Novus Biologicals, LLC, Littleton, CO, USA) at a 1:5000 dilution. Horseradish peroxidase-conjugated rabbit and mouse secondary antibodies (GE Healthcare) were used at a 1:2500 dilution. SuperSignal (Pierce, Rockford, IL, USA) chemiluminescent substrate was used to detect proteins.
Statistical Analyses
Nominal variables (cytogenetic subtype, treatment response) were analyzed using either ANOVA, chi-squared or Fisher's exact tests. All statistical analyses were conducted using R software (R Foundation for Statistical Computing, Vienna, Austria) or GraphPad Prism (GraphPad Software, Inc., La Jolla, CA, USA).
Results
Inhibition of proliferation in response to lenalidomide and cytogenetic subtypes
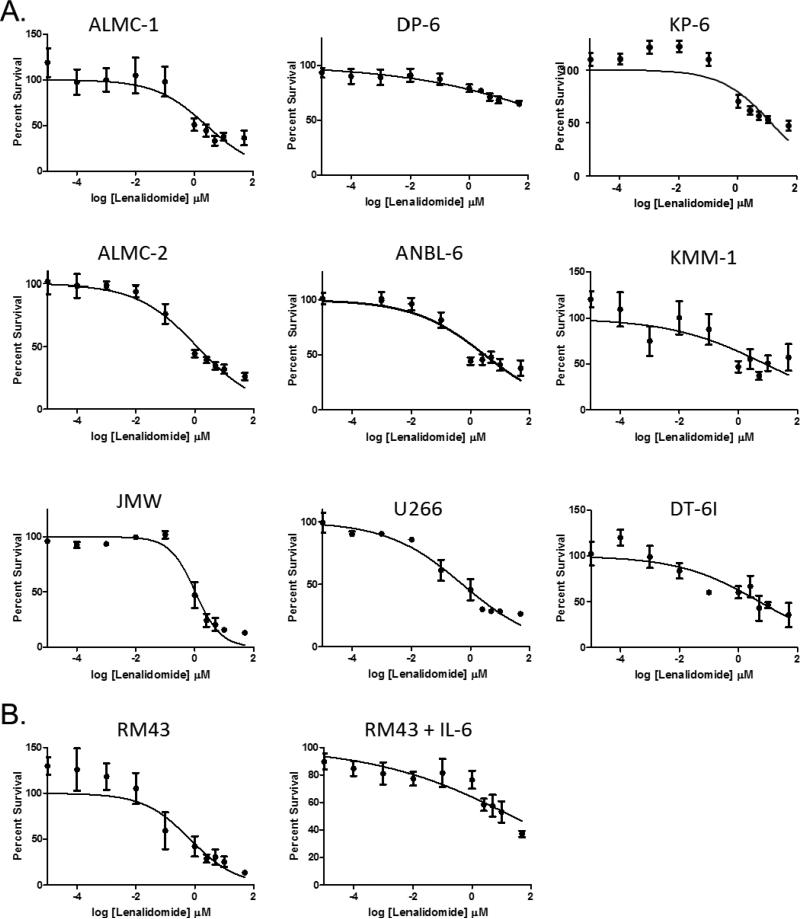
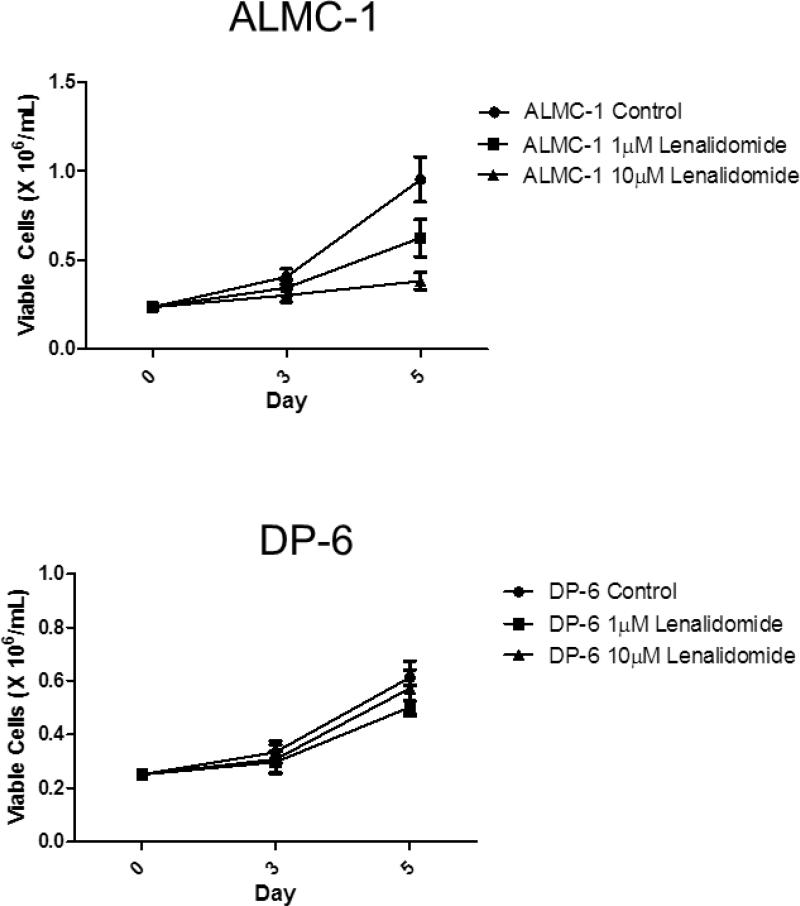
To determine whether there was a difference in the ability of lenalidomide to inhibit proliferation of HMCLs by cytogenetic subtype, we utilized 3H-TdR incorporation assays across a panel of HMCLs representative of the major cytogenetic subtypes of MM (Table 1). We tested a range of doses of lenalidomide (0.00001 μM to 50 μM), which enabled us to group HMCLs into lenalidomide responsive cell lines (IC50 < 10 μM) and lenalidomide non-responsive cell lines (IC50 > 10 μM, 10 μM included in 95% CI, or unable to calculate IC50). As shown in Figure 1A, the majority of the HMCLs exhibited lenalidomide-mediated dose-dependent inhibition of proliferation (Table 1). This inhibition persisted in all cell lines regardless of whether IL-6 was added in the proliferation assay, except for RM43, which changed from being classified as “responsive” without the additional IL-6 to “non-responsive” with its addition (Figure 1B). While there was no correlation between the antiproliferative activity of lenalidomide and cytogenetic abnormalities in the selected cell lines with a cytogenetic translocation, the three hyperdiploid cell lines were among the non-responsive cell lines (Table 1). In both lenalidomide responders and non-responders, there was no significant difference in cell viability in cells treated with either 1 μM or 10 μM at 72 and 120 hours (p>0.05) (Figure 2).
Figure 1. HMCLs can be characterized as either lenalidomide responsive or non-responsive.
A. HMCLs were incubated with a single dose of lenalidomide and IL-6 administered at 0 hours; DNA synthesis was measured after 4 days of culture. Error bars represent the standard error of the mean of three separate experiments. Based on these experiments, ALMC-1, ALMC-2, ANBL-6, JMW, and U266 were characterized as lenalidomide-responsive; DP-6, KP-6, KMM-1, and RM43 were characterized as non-responsive. B. RM43, a t(11;14) cell line, is responsive to a single dose of lenalidomide, but not in the presence of exogenous IL-6. RM43 cells were incubated with a single dose of lenalidomide administered at 0 hours; DNA synthesis was measured after 4 days of culture. Error bars represent the standard error of the mean of three separate experiments.
Figure 2. Lenalidomide inhibits proliferation in responsive cell lines.
A single dose of either 1 μM or 10 μM lenalidomide on day 0 inhibited IL-6 stimulated cellular proliferation in lenalidomide-responsive ALMC-1, but not in the non-responsive DP-6. Error bars represent the standard error of the mean of three separate experiments.
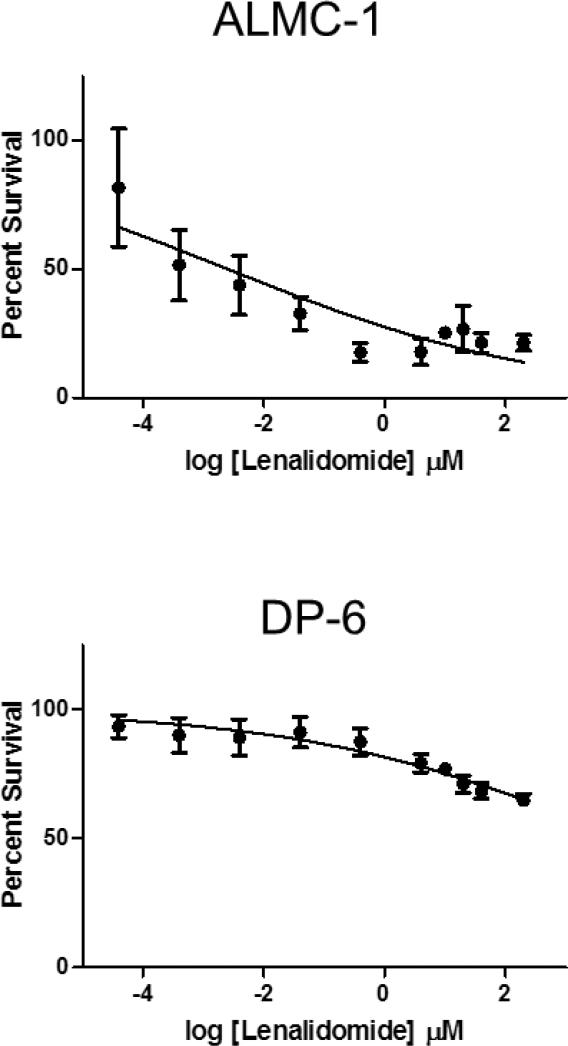
It has been previously reported that lenalidomide has an in vitro half-life of 8 hours (23, 25). To assess whether this property of the agent could explain the lack of response in HMCLs classified as non-responsive, we conducted 3H-TdR incorporation assays in the lenalidomide responsive ALMC-1 and non-responsive DP-6 (Figure 3), adding additional drug every 24 hours. No significant difference in IC50 was found in DP-6 cells receiving single (see Figure 1A) versus daily doses of lenalidomide. The dose response curves of ALMC-1 cells were shifted dramatically from the single dose curves (see Figure 1A) when lenalidomide was added every 24 hours. This resulted in a significantly lowered IC50 in ALMC-1 cells (IC50 = 2.608 μM versus 0.005 μM, p=0.004). Ultimately, however, both DP-6 and ALMC-1 curves plateaued at the same percentage of surviving cells at 10 μM in all experiments.
Figure 3. Repeated daily administration of lenalidomide and HMCL-responsiveness.
ALMC-1 and DP-6 were incubated with repeated doses of lenalidomide ranging from 0.0001 to 50 μM; doses were administered at times 0, 24, 48, and 72 hours. DNA synthesis was measured after 4 days of culture. Concentrations shown are aggregate concentrations, representing the sum total dosage over the four-day period. Error bars represent the standard error of the mean of three separate experiments.
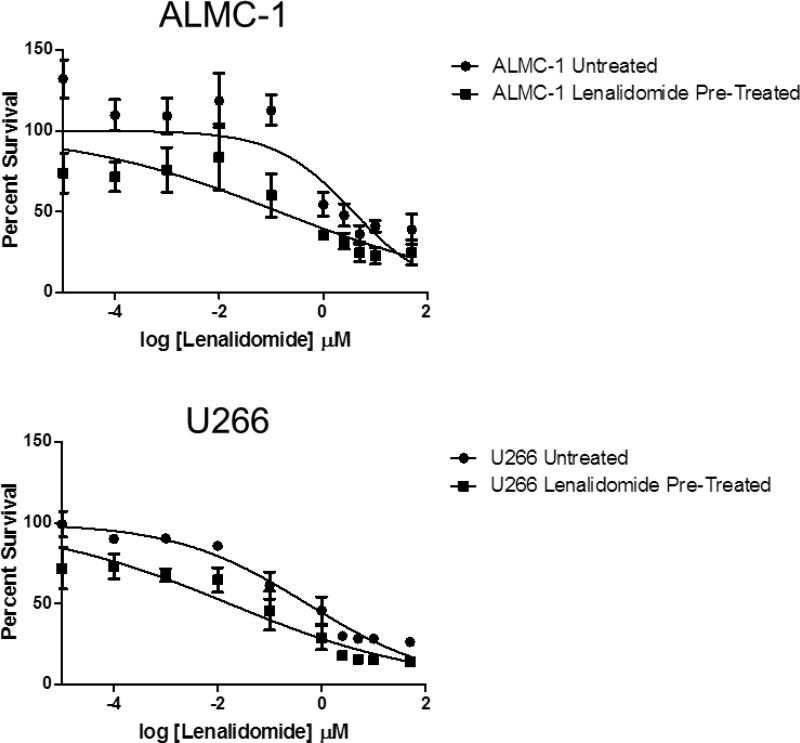
Finally, to determine whether the cells, which remained after four days of treatment with lenalidomide, constituted a truly resistant subpopulation, the lenalidomide-responsive cell lines ALMC-1 and U266 were selected for further investigation. Both cell lines were incubated with lenalidomide for four days at a concentration of 10 μM prior to plating as previously described. ALMC-1 cells remaining after the pretreatment responded in a manner similar to the untreated ALMC-1 cells, though they showed a statistically significantly lower IC50 value (IC50 = 0.592 μM versus 0.016 μM, p=0.0037); again, there was a small subpopulation of cells remaining at the 50 μM dose. Pre-treated U266 cells responded in the same manner (IC50 = 0.592 μM versus 0.016 μM, p<0.0001, Figure 4).
Figure 4. Cells remaining after initial lenalidomide treatment are not lenalidomide-resistant.
ALMC-1 and U266 were incubated for 96 hours in the presence of 10 μM lenalidomide. Cells were isolated and then re-cultured with a single dose of lenalidomide administered at 0 hours (doses ranging from 0.0001 μM to 50 μM); DNA synthesis was measured after 4 days of culture. Error bars represent the standard error of the mean of three separate experiments.
Cell cycle arrest and apoptotic response to lenalidomide
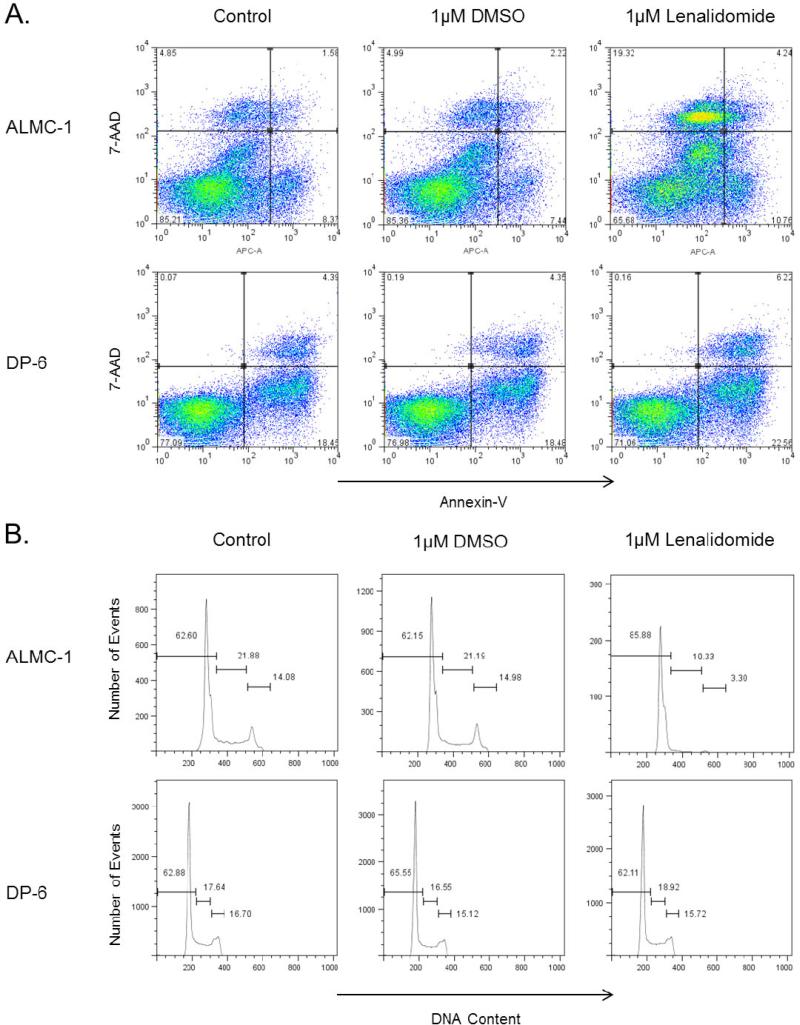
As multiple mechanisms of action have been attributed to lenalidomide, we sought to determine whether there was a difference in levels of cell cycle arrest and/or apoptosis across cytogenetic subtypes in our panel of cell lines (Table 1). No significant difference in the percent apoptosis across cell lines was found, though differences in the percent dead cells were noted. One cell line each representing both non-responders (DP-6) and responders (ALMC-1) is shown in Figure 5A. However, there does appear to be a modest increase in percentage of cells arrested in the G0/G1 phase in lenalidomide responders compared to non-responders (Table 1, Figure 5B).
Figure 5. Lenalidomide induces cell cycle arrest and apoptosis in lenalidomide-responsive cell lines.
A) Flow cytometry was used to assess the effect of treatment with 1 μM lenalidomide on lenalidomide-responsive ALMC-1 and non-responsive DP-6 after 72 hours. Plots presented are representative of all replicates performed. B) The addition of 1 μM lenalidomide treatment leads to an increase in cell cycle arrest in the G0/G1 phase in lenalidomide-responsive ALMC-1 after 72 hours, but not in non-responsive DP-6. Plots are representative of all replicates performed.
CRBN and IRF4 expression and cytogenetic subtypes
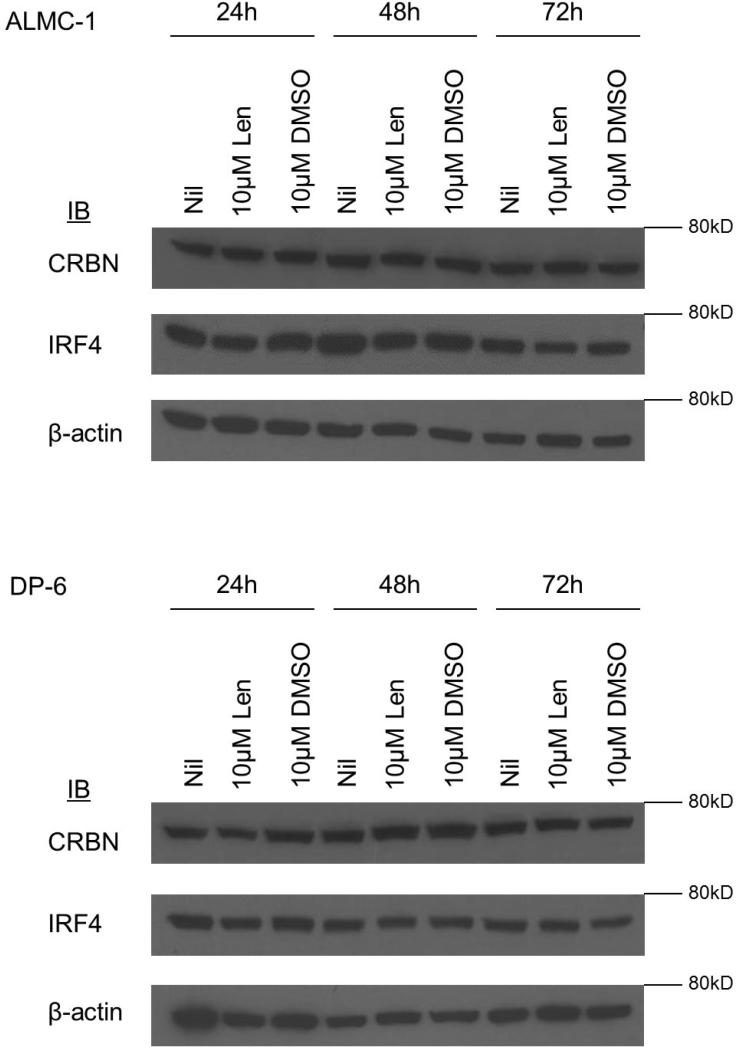
As protein expression levels of CRBN and IRF4 have been shown to be associated with lenalidomide sensitivity, we investigated whether there was a difference in expression of these molecules across cell lines (17, 18). We again selected ALMC-1 as representative of lenalidomide-responsive cell lines and DP-6 as representative of non-responsive cell lines and examined the effect of an initial dose of 10 μM lenalidomide on expression of CRBN and IRF4 over 24, 48, and 72 hours (Figure 6). No differences were seen in expression level at baseline. Moreover, CRBN and IRF4 expression did not change in the selected HMCLs after 24, 48, and 72 hours of treatment with lenalidomide.
Figure 6. CRBN and IRF4 expression in lenalidomide responsive and non-responsive cell lines.
No significant difference in expression of the lenalidomide target CRBN and downstream target IRF4 was observed in either lenalidomide-responsive ALMC-1 or non-responsive DP-6 when treated with an initial single dose of 10 μM lenalidomide over a 72 incubation period.
Discussion
MM is a highly heterogeneous disease in both molecular and clinical presentation. Additionally, there is great variability in response to treatment; however, it remains unclear as to what the connection is, if any, between molecular heterogeneity and response to therapy. Given the strong association between cytogenetic abnormalities present at diagnosis and patient prognosis, there is a need to investigate whether these abnormalities can be used to develop a cytogenetically risk-adapted strategy for treatment. In the present study, we investigated whether there is an association between primary cytogenetic abnormality and lenalidomide response in a panel of HMCLs.
Our study showed no significant association between lenalidomide response and HMCLs representative of the major cytogenetic translocations; however, all of our hyperdiploid HMCLs were minimally responsive to treatment (Table 1). This overall lack of correlation between the cytogenetic heterogeneity in HMCLs and lenalidomide response is in keeping with recent findings that lenalidomide-resistant HMCLs can contain a variety of cytogenetic translocations, including t(4;14), t(14;16), t(14;20), and t(11;14), suggesting that there is something other than cytogenetic subgrouping that may be associated or responsible for differences in lenalidomide response in vitro (26).
Lenalidomide has previously been implicated as an inhibitor of the production of IL-6 (27, 28). In RM43 cells, a good response was observed when the lenalidomide was administered in the absence of IL-6; however, when lenalidomide was administered in the presence of IL-6, the cell line became non-responsive (Figure 1B). One potential explanation could be that, in RM43, lenalidomide is able to inhibit cellular proliferation under the conditions of the endogenously produced IL-6; the addition of exogenous IL-6 to the culture overwhelms the ability of the administered doses of lenalidomide to inhibit IL-6 production, resulting in a lowered response to lenalidomide. In other non-responsive cell lines, however, there was no such change when exogenous IL-6 was added (data not shown); further investigation into this phenomenon is necessary.
Examining the results of our proliferation assays, we found that none of the HMCLs classified as responsive displayed complete sensitivity to drug; that is, even in responsive HMCLs, a persistent proliferative subpopulation remained at the maximum dose of 50 μM. Similar observations have been made previously, which begs the question of whether these lenalidomide-resistant subpopulations of myeloma cells exist in patients, and whether these resistant populations could help to explain relapsed disease in patients who achieve some response to lenalidomide (15, 16). Previous work demonstrated lenalidomide could target clonogenic side populations in multiple myeloma cells; however, it remains to be seen whether there are lenalidomide resistant populations that remain post-treatment (29).
Due to the relatively short half-life of lenalidomide in vitro (8 hours), we sought to determine whether administering doses of lenalidomide every 24 hours would have an effect on the IC50 of lendalidomide-responsive ALMC-1 and non-responsive DP-6 HMCLs. However, we failed to observe a significant difference in response between assays with a single dose and those with repeated doses in both cell lines. Of interest, the previously described persistent population remained at the same level at repeated doses of the 10 μM dose as in the single-dose assays (Figures 1 and 3) (15, 16). In addition, when lenalidomide-responsive HMCLs ALMC-1 and U266 were pre-treated with 10 μM lenalidomide for 96 hours prior to plating, the remaining subpopulation of cells responded in a manner similar or parallel to the original untreated cells, suggesting that the subpopulation of cells still proliferating after single-dose treatment may not be truly resistant (Figure 4).
In prior studies of patients treated with lenalidomide, it has been demonstrated that those whose myeloma cells are hyperdiploid tend to have the best response to therapy than individuals with other cytogenetic abnormalities (8). It was therefore unexpected to find that all three of our hyperdiploid HMCLs (DP-6, KP-6, and DT-6I) were classified as non-responsive. This suggests that lenalidomide, in hyperdiploid patients, may be acting on cells in the bone marrow microenvironment other than (or in addition to) the malignant plasma cells. Further study is necessary to determine what possible effects lenalidomide has on cells within the bone marrow and its underlying mechanism. As cytogenetic subtype was not associated with differences in responsiveness to lenalidomide in our HMCL panel, we examined expression of CRBN, a direct binding target of lenalidomide. Our investigation revealed no difference in expression of CRBN in ALMC-1 and DP-6 (Figure 6). CRBN has previously been shown to be necessary for IMiD efficacy in patients with MM; therefore, it would be expected that there would be less expression of CRBN in the non-responsive DP-6 compared with the lenalidomide-sensitive ALMC-1(15, 16, 18, 30). Based on published reports, it was also expected that CRBN expression would decrease with lenalidomide treatment (16-18). Given that CRBN is part of an E3 ubiquitin kinase and aids in the direction of many different cellular events and is ubiquitously expressed, we hypothesized that there may be a better marker of lenalidomide responsiveness in vitro downstream of CRBN. Previous reports suggest that, while HMCLs express a greater quantity of CRBN compared with both normal bone marrow from healthy donors and normal, CD138+ sorted plasma cells, no significant difference in expression of CRBN was observed in the cell lines after treatment with lenalidomide for 72 hours (17). While it has been shown that CRBN and IRF4 levels have been shown to correlate with lenalidomide responsiveness in patients, previous in vitro investigations using HMCLs have not been able to replicate this phenomenon (16, 23). The implications of this apparent discordance are two-fold. First, these results may suggest it will be important to investigate expression of these genes in CD138− cells as well as in CD138+ myeloma cells. Second, because there are multiple isoforms of CRBN, it may be important to study expression levels of each one in the context of both in vivo and in vitro settings (31). Of note, studies using HMCLs to examine CRBN and IRF4 levels in response to lenalidomide treatment have only examined cell lines which we have demonstrated here to be lenalidomide-responsive, and were only able to achieve drastic differences in expression levels at concentrations of drug greater than physiologically achievable (30-50 μM). In designing our studies, we chose to use a dose of lenalidomide that was the maximum clinically relevant dose (10 μM) and to examine both lenalidomide responsive and non-responsive cell lines (namely, ALMC-1 and DP-6).
IRF4, a transcription factor which acts as a downstream regulator of interferon signaling, has been put forth as a potential downstream target of CRBN (16-18, 32, 33). Past investigations have implicated increased expression of IRF4 in other B-cell malignancies, such as diffuse large B-cell lymphoma and chronic lymphocytic leukemia (33). Like CRBN, IRF4 has been shown to be predictive of lenalidomide sensitivity in samples of multiple myeloma patients; this has not been replicated in vitro, however (15-17). We therefore tested our representative cell lines (ALMC-1 and DP-6) to determine whether there was any alteration of expression of IRF4 at 24, 48, and 72 hours post-treatment with a single dose of 10 μM lenalidomide. No difference in expression of either of these markers was observed in either ALMC-1 or DP-6. Given the status of DP-6 as a non-responder, this was to be expected, yet we had expected ALMC-1 to be responsive to lenalidomide at a 10 μM dose. This could potentially be due to the dose not being great enough to induce changes in vitro.
In summary, we found no association between cytogenetic abnormality and lenalidomide responsiveness in a panel of representative HMCLs. Additionally, we found no difference in expression of CRBN and IRF4 between responsive and non-responsive HMCLs when treated with lenalidomide. These findings suggest that the development of a new treatment paradigm based on cytogenetic subtype of MM alone may be insufficient, and that additional markers may need to be incorporated. Furthermore, the disconnect between our findings of expression of CRBN and IRF-4 in lenalidomide-treated HMCLs and patient data highlights the need for further investigation into the role of the bone marrow microenvironment on the regulation of these previously demonstrated markers of lenalidomide response.
Acknowledgements
The authors wish to acknowledge Bonnie Arendt and Renee Tschumper for their support in cell culture maintenance.
Financial Support: This publication was supported by CTSA Grant Number TL1TR000137 from the National Center for Advancing Translational Science (NCATS) and by a grant from the National Institutes of Health National Cancer Institute (CA062242). Its contents are solely the responsibility of the authors and do not necessarily represent the official views of the NIH.
Footnotes
Authorship Contributions and Disclosure of Conflicts of Interest
A.J.G., D.K.W., D.F.J., S.V.R, and S.K.K. conceived of and designed the study; A.J.G., and D.K.W. collected and analyzed the data; A.J.G. wrote the manuscript, with input from all authors.
Conflicts of Interest
The authors have no conflicts of interest to disclose.
REFERENCES
- 1.Kumar S, Fonseca R, Ketterling RP, Dispenzieri A, Lacy MQ, Gertz MA, Hayman SR, Buadi FK, Dingl D, Knudson RA, Greenberg A, Russell SJ, Zeldenrust SR, Lust JA, Kyle RA, Bergsagel L, Rajkumar SV. Trisomies in multiple myeloma: impact on survival in patients with high-risk cytogenetics. Blood. 2012;119(9):2100–5. doi: 10.1182/blood-2011-11-390658. [DOI] [PMC free article] [PubMed] [Google Scholar]
- 2.Rajkumar SV. Treatment of multiple myeloma. Nat Rev Clin Onc. 2011;8(8):497–1. doi: 10.1038/nrclinonc.2011.63. [DOI] [PMC free article] [PubMed] [Google Scholar]
- 3.Rajkumar SV. Multiple myeloma: 2012 update on diagnosis, risk-stratification, and management. Am J Hematol. 2012;87(1):78–88. doi: 10.1002/ajh.22237. [DOI] [PMC free article] [PubMed] [Google Scholar]
- 4.Cavo M, Tacchetti P, Patriarca F, Petrucci MT, Patani L, Galli M, Raimondo FD, Crippa C, Zamagni E, Palumbo A, Offidani M, Corradini P, Narni F, Spadano A, Pescosta N, Deliliers GL, Ledda A, Cellini C, Caravita T, Tosi P, Baccarani M. Network” GIM. Bortezomib with thalidomide plus dexamethasone compared with thalidomide plus dexamethasone as induction therapy before, and consolidation therapy after, double autologous stem-cell transplantation in newly diagnosed multiple myeloma: a randomised phase 3 study. Lancet. 2010;376(9758):2075–85. doi: 10.1016/S0140-6736(10)61424-9. [DOI] [PubMed] [Google Scholar]
- 5.Barlogie B, Anaissie E, Rhee FV, Haessler J, Hollmig K, Pineda-Roman M, Cottler-Fox M, Mohiuddin A, Alsayed Y, Tricot G, Bolejack V, Zangari M, Epstein J, Petty N, Steward D, Jenkins B, Gurley J, Sullican E, Crowley J, Shaughnessy JDJ. Incorporating bortezomib into upfront treatment for multiple myeloma: early results of total therapy 3. Br J Haematol. 2007;138(2):176–85. doi: 10.1111/j.1365-2141.2007.06639.x. [DOI] [PubMed] [Google Scholar]
- 6.Rhee Fv, Szymonifka K, Anaissie E, Nair B, Waheed S, Alsayed Y, Petty N, Shaughnessy JDJ, Hoering A, Crowley J, Barlogie B. Total Therapy 3 for multiple myeloma: prognostic implications of cumulative dosing and premature discontinuation of VTD maintenance components, bortezomib, thalidomide, and dexamethasone, relevant to all phases of therapy. Blood. 2010;116(8):1220–7. doi: 10.1182/blood-2010-01-264333. [DOI] [PMC free article] [PubMed] [Google Scholar]
- 7.Nair B, Rhee Fv, Shaughnessy JDJ, Anaissie E, Szymonifka J, Hoering A, Alsayed Y, Waheed S, Crowley J, Barlogie B. Superior results of Total Therapy 3 (2003-33) in gene expression profiling-defined low-risk multiple myeloma confirmed in subsequent trial 2006-66 with VRD maintenance. Blood. 2010;115(21):4168–73. doi: 10.1182/blood-2009-11-255620. [DOI] [PMC free article] [PubMed] [Google Scholar]
- 8.Rajkumar SV. Multiple myeloma: 2013 update on diagnosis, risk-stratification, and management. Am J Hematol. 2013;88(3):226–35. doi: 10.1002/ajh.23390. [DOI] [PubMed] [Google Scholar]
- 9.Kumar SK, Rajkumar SV, Dispenzieri A, Lacy MQ, Hayman SR, Buadi FK, Zeldenrust SR, Dingli D, Russell SJ, Lust JA, Greipp PR, Kyle RA, Gertz MA. Improved survival in multiple myeloma and the impact of novel therapies. Blood. 2008;111(5):2516–20. doi: 10.1182/blood-2007-10-116129. [DOI] [PMC free article] [PubMed] [Google Scholar]
- 10.Srivastava G, Rana V, Lacy MQ, Buadi FK, Hayman SR, Dispenzieri A, Gertz MA, Dingli D, Zeldenrust S, Russell S, McCurdy A, Kapoor P, Kyle R, Rajkumar SV, Kumar S. Long-term outcome with lenalidomide and dexamethasone therapy for newly diagnosed multiple myeloma. Leukemia. 2013 doi: 10.1038/leu.2013.143. Epub ahead of print. [DOI] [PMC free article] [PubMed] [Google Scholar]
- 11.Escoubet-Lozach L, Lin IL, Jensen-Pergakes K, Brady HA, Gandhi AK, Schafer PH, Muller GW, Worland PJ, Chan KW, Verhelle D. Pomalidomide and lenalidomide induce p21 WAF-1 expression in both lymphoma and multiple myeloma through a LSD1-mediated epigenetic mechanism. Cancer Res. 2009;69(18):7347–56. doi: 10.1158/0008-5472.CAN-08-4898. [DOI] [PubMed] [Google Scholar]
- 12.Qian Z, Zhang L, Cai Z, Sun L, Wang H, Yi Q, Wang M. Lenalidomide synergizes with dexamethasone to induce growth arrest and apoptosis of mantle cell lymphoma cells in vitro and in vivo. Leuk Res. 2011;35(3):380–6. doi: 10.1016/j.leukres.2010.09.027. [DOI] [PubMed] [Google Scholar]
- 13.Zeldis JB, Knight R, Hussein M, Chopra R, Muller G. A review of the history, properties, and use of the immunomodulatory compound lenalidomide. Ann N Y Acad Sci. 2011;1222:76–82. doi: 10.1111/j.1749-6632.2011.05974.x. [DOI] [PubMed] [Google Scholar]
- 14.Ito T, Ando H, Suzuki T, Ogura T, Hotta K, Imamura Y, Yamaguchi Y, Handa H. Identification of a primary target of thalidomide teratogenicity. Science. 2010;327(5971):1345–50. doi: 10.1126/science.1177319. [DOI] [PubMed] [Google Scholar]
- 15.Zhu YX, Braggio E, Shi CX, Bruins LA, Schmidt JE, Wier SV, Chang XB, Bjorkland CC, Fonseca R, Bergsagel PL, Orlowski RZ, Stewart AK. Cereblon expression is required for the antimyeloma activity of lenalidomide and pomalidomide. Blood. 2011;118(18):4771–9. doi: 10.1182/blood-2011-05-356063. [DOI] [PMC free article] [PubMed] [Google Scholar]
- 16.Lopez-Girona A, Mendy D, Ito T, Miller K, Ghandi AK, Kang J, Karasawa S, Carmel G, Jackson P, Abbasian M, Mahmoudi A, Cathers B, Rychak E, Gaidarova S, Chen R, Schafer PH, Handa H, Daniel TO, Evans JF, Chopra R. Cereblon is a direct protein target for immunomodulatory and antiproliferative activities of lenalidomide and pomalidomide. Leukemia. 2012;26(11):2326–35. doi: 10.1038/leu.2012.119. [DOI] [PMC free article] [PubMed] [Google Scholar]
- 17.Heintel D, Rocci A, Ludwig H, Bolomsky A, Caltagirone S, Schreder M, Pfeifer S, Gisslinger H, Zojer N, Jager U, Palumbo A. High expression of cereblon (CRBN) is associated with improved clinical response in patients with multiple myeloma treated with lenalidomide and dexamethasone. Br J Haematol. 2013;161(5):695–700. doi: 10.1111/bjh.12338. [DOI] [PubMed] [Google Scholar]
- 18.Lopez-Girona A, Heintel D, Zhang LH, Mendy D, Gaidarova S, Brady H, Bartlett JB, Schafer PH, Schreder M, Bolomsky A, Hilgarth B, Zojer N, Gisslinger H, Ludwig H, Jager U, Chopra R. Lenalidomide downregulates the cell survival factor, interferon regulatory factor-4, providing a potential mechanistic link for predicting response. Br J Haematol. 2011;154(3):325–36. doi: 10.1111/j.1365-2141.2011.08689.x. [DOI] [PubMed] [Google Scholar]
- 19.Westendorf JJ, Ahmann GJ, Greipp PR, Witzig TE, Lust JA, Jelinek DF. Establishment and characterization of three myeloma cell lines that demonstrate variable cytokine responses and abilities to produce autocrine interleukin-6. Leukemia. 1996;10:866–76. [PubMed] [Google Scholar]
- 20.Jelinek DF, Ahmann GJ, Greipp PR, Jalal SM, Westendorf JJ, Katzmann JA, Kyle RA, Lust JA. Coexistence of aneuploid subclones within a myeloma cell line that exhibits clonal immunoglobulin gene rearrangement: clinical implications. Cancer Res. 1993;53:5320–7. [PubMed] [Google Scholar]
- 21.Arendt BK, Ramirez-Alvarado M, Sikkink LA, Keats JJ, Ahmann GJ, Dispenzieri A, Fonzeca R, Ketterling RP, Knudson RA, Mulvihill EM, Tschumper RC, Wu X, Zeldenrust SR, Jelinek DF. Biologic and genetic characterization of the novel amyloidogenic lambda light chain-secreting human cell lines, ALMC-1 and ALMC-2. Blood. 2008;112(5):1391–41. doi: 10.1182/blood-2008-03-143040. [DOI] [PMC free article] [PubMed] [Google Scholar]
- 22.Westendorf JJ, Ahmann GJ, Greipp PR, Witzig TE, Lust JA, Jelinek DF. Establishment and characterization of three myeloma cell lines that demonstrate variable cytokine responses and abilities to produce autocrine interleukin-6. Leukemia. 1996;10:866–76. [PubMed] [Google Scholar]
- 23.Chen N, Lau H, Kong L, Kumar G, Zeldis JB, Knight R, Laskin OL. Pharmacokinetics of lenalidomide in subjects with various degrees of renal impairment and in subjects on hemodialysis. J Clin Pharmacol. 2007;47(12):1466–75. doi: 10.1177/0091270007309563. [DOI] [PubMed] [Google Scholar]
- 24.Walters DK, French JD, Arendt BK, Jelinek DF. Atypical expression of ErbB3 in myeloma cells: cross-talk between ErbB3 and the interferon-alpha signaling complex. Oncogene. 2003;22:3598–607. doi: 10.1038/sj.onc.1206512. [DOI] [PubMed] [Google Scholar]
- 25.Chen N, Wen L, Lau H, Surapaneni S, Kumar G. Pharmacokinetics, metabolism and excretion of [14C]-lenalidomide following oral administration in healthy male subjects. Cancer Chemother Pharamcol. 2012;69(3):789–97. doi: 10.1007/s00280-011-1760-3. [DOI] [PMC free article] [PubMed] [Google Scholar]
- 26.Maiga S, Gomez-Bougie P, Bonnaud S, Gratas C, Moreau P, LeGouill S, Pellat-Deceunybck C, Amiot M. Paradoxical effect of lenalidomide on cytokine/growth factor profiles in multiple myeloma. Br J Cancer. 2013;108(9):1081–6. doi: 10.1038/bjc.2013.186. [DOI] [PMC free article] [PubMed] [Google Scholar]
- 27.Chaulet C, Croix C, Alagille D, Normand S, Delwail A, Favot L, Lecron JC, Viaud-Massuard MC. Design, synthesis and biological evaluation of new thalidomide analogues as TNF-α and IL-6 production inhibitors. Bioorg Med Chem Lett. 2011;21(3):1019–22. doi: 10.1016/j.bmcl.2010.12.031. [DOI] [PubMed] [Google Scholar]
- 28.Gorgun G, Calabrese E, Soydan E, Hideshima T, Perrone G, Bandi M, Cirstea D, Santo L, Hu Y, Tai YT, Nahar S, Mimura N, Fabre C, Raje N, Munshi N, Richardson P, Anderson KC. Immunomodulatory effects of lenalidomide and pomalidomide on interaction of tumor and bone marrow accessory cells in multiple myeloma. Blood. 2010;116(17):3227–37. doi: 10.1182/blood-2010-04-279893. [DOI] [PMC free article] [PubMed] [Google Scholar]
- 29.Jakubikova J, Adamia S, Kost-Alimova M, Klippel S, Cervi D, Daley JF, Cholujova D, Kong SY, Leiba M, Blotta S, Ooi M, Delmore J, Laubach J, Richardson PG, Sedlak J, Anderson KC, Mitsiades CS. Lenalidomide targets clonogenic side population in multiple myeloma: pathophysiologic and clinical implications. Blood. 2011;117(17):4409–19. doi: 10.1182/blood-2010-02-267344. [DOI] [PMC free article] [PubMed] [Google Scholar]
- 30.Zhu YX, Kortuem KM, Stewart AK. Molecular mechanism of action of immune-modulatory drugs thalidomide, lenalidomide, and pomalidomide in multiple myeloma. Leuk Lymphoma. 2012;54(4):683–7. doi: 10.3109/10428194.2012.728597. [DOI] [PMC free article] [PubMed] [Google Scholar]
- 31.Gandhi AK, Avet-Loiseau H, Waldman M, Thakurta A, Aukerman AL, Chen G, Mendy D, Rychak E, Miller K, Gaidarova S, Gonzales M, Cathers B, Schafer PH, Daniel TO, Lopez-Girona A, Chopra R. Detection and Quantification of Cereblon Protein and mRNA in Multiple Myeloma Cell Lines and Primary CD138+multiple Myeloma Cells. Blood. 2012;120(21) Abstract 4043. [Google Scholar]
- 32.Shaffer AL, Emre NC, Lamy L, Ngo VN, Wright G, Xiao W, Powell J, Dave S, Yu X, Zhao H, Zeng Y, Chen B, Epstein J, Staudt LM. IRF4 addiction in multiple myeloma. Nature. 2008;454(7201):226–31. doi: 10.1038/nature07064. [DOI] [PMC free article] [PubMed] [Google Scholar]
- 33.Shaffer AL, Emre NC, Romesser PB, Staudt LM. IRF4: Immunity. Malignancy! Therapy? Clin Cancer Res. 2009;15(9):2954–61. doi: 10.1158/1078-0432.CCR-08-1845. [DOI] [PMC free article] [PubMed] [Google Scholar]


