

Abstract
The purpose of this study was to investigate the current status of metal pollution in the sediment from rivers, lakes, and streams in active gold mining districts in Ghana. Two hundred and fifty surface sediment samples from 99 locations were collected and analyzed for concentrations of As, Hg, Cr, Co, Cu, Fe, Zn, Pb, Cd, Ni, and Mn using inductively coupled plasma-mass spectroscopy (ICP-MS). Metal concentrations were then used to assess the human health risks to resident children and adults in central tendency exposure (CTE) and reasonable maximum exposure (RME) scenarios. The concentrations of Pb, Cd, and As were almost twice the threshold values established by the Hong Kong Interim Sediment Quality Guidelines (ISQG). Hg, Cu, and Cr concentrations in sediment were 14, 20, and 26 times higher than the Canadian Freshwater Sediment Guidelines for these elements. Also, the concentrations of Pb, Cu, Cr, and Hg were 3, 11, 12, and 16 times more than the Australian and New Zealand Environment and Conservation Council (ANZECC) sediment guideline values. The results of the human health risk assessment indicate that for ingestion of sediment under the central tendency exposure (CTE) scenario, the cancer risks for child and adult residents from exposure to As were 4.18 × 10⁻⁶ and 1.84 × 10⁻⁷, respectively. This suggests that up to 4 children out of one million equally exposed children would contract cancer if exposed continuously to As over 70 years (the assumed lifetime). The hazard index for child residents following exposure to Cr(VI) in the RME scenario was 4.2. This is greater than the United States Environmental Protection Agency (USEPA) threshold of 1, indicating that adverse health effects to children from exposure to Cr(VI) are possible. This study demonstrates the urgent need to control industrial emissions and the severe heavy metal pollution in gold mining environments.
Keywords: Chemometric assessment, Gold mining, Human health risk, Central tendency exposure, Reasonable maximum exposure, Metals
INTRODUCTION
Heavy metal contamination has become a universal problem affecting the normal functions of estuarine, riverine and marine ecosystems. Sediment, as the largest storage of heavy metals, plays a rather important role in metal transformations (1,2). With rapid urbanization and industrialization, heavy metals are continuously carried to the estuarine, riverine and marine sediments from upstream of tributaries (3,4). Heavy metal contamination in sediment could affect the water quality and bioaccumulation of metals in aquatic organisms, resulting in potential long-term implication on human and ecosystem health (5,6). In most situations, the major part of the anthropogenic metal load in sediments has a terrestrial source, including urban waste and runoff, industrial effluents, boating activities, domestic garbage dumps, agricultural runoff, mining activities and sewage treatment plants (3,4,7). Buccolieri et al. (8) argues that sensitive areas of heavy metal concentration are often near industrial plants.
According to Hjortenkrans et al. (9), heavy metal emissions have been declining in some industrialized countriesover the last few decades, nevertheless, anthropogenic sources have been increasing with rapid industrialization and urbanization in developing countries (10). In the aquatic environment, heavy metal is usually distributed as follows: water-soluble species, colloids, suspended forms and sedimentary phases (11). However, unlike organic pollutants, natural processes of decomposition do not remove heavy metals. On the contrary, they usually are enriched in sediment by organisms or some other compounds. In some circumstances, more than 99% of heavy metal entering into river can be stored in river sediments in various forms (12). The spatial distribution of heavy metals in riverine sediments is of major importance in determining the pollution history of aquatic systems (13), and is fundamental information for identifying the possible sources of contamination and to delineate the areas where its concentration exceeds the threshold values and the strategies of site remediation (14). Therefore, understanding the mechanisms of accumulation and geochemical distribution of heavy metals in sediments is crucial for the management of riverine environments.
In Ghana, gold mining is a longstanding industrial activity which contributes to sediment contaminations in riverine environments. Sources of heavy metal contamination include a number of old and abandoned mine sites. Current mining operations in Ghana are subject to strict environmental conditions designed to prevent significant downstream contamination. However, this was not always so. There are a number of old sites where there was poor management during operation and where no post-operation site remediation was carried out. As a result, there can be ongoing contamination of streams due to leaching and runoffs from exposed metal-rich spoil tips. Hitherto, research on heavy metal contamination in mining environments has disproportionately on focused the water column. Several authors have examined heavy metal contamination in aquatic environments in mining localities of Ghana including Akabzaa et al. (15), Armah et al. (16), Kuma and Younger (17), and Yidana et al. (18).
Although sediment analysis allows contaminants that are adsorbed by particulate matter, which escape detection by water analysis to be identified, not much work has been done to characterize and quantify heavy metals in surficial sediments in riverine environments in gold mining areas of Ghana. Therefore this investigation, performed for the purpose of surface water quality monitoring, will provide records of contaminated sediments located downstream from major mining areas. Furthermore, most of the sediments are permanent deposits that will not be removed in the near future. Thus, their impact on the environment and the relevance to environmental and health human risk analysis over the long term merit examination. This study evaluates sediment contamination with heavy metals in river reservoirs located downstream from major urban areas in Ghana. The objectives of the study is to describe the current situation in riverine sediment contamination by mining activities in Ghana; to carry out a chemometric assessment of the sources of heavy metals in surficial sediments in riverine environments in gold mining areas in Ghana; and to identify environmental and human health risks from the presence of contaminated sediments and to discuss fundamental options for managing rivers in gold mining areas containing highly contaminated sediments.
MATERIALS AND METHODS
Study area. Sediment samples from 99 locations in riverine environments in active gold mining areas in Ghana were collected from September 2011 to April 2012. Twelve locations each in the Amansie West District and Obuasi Municipality were sampled. In the BibianiAnhwiasoBekwai District, 33 locations were sampled and in the Upper Denkyira District (Dunkwa-on-Offin), 20 locations were sampled. Twenty-two locations in Tarkwa and Prestea were sampled and 12 locations were sampled in the Birim North District.
Data collection. Sampling in rivers and lakes in gold mining environments involved collecting three samples from each site (one midstream and one from each bank in a crosssection fashion). The three samples were homogenised into a composite sample with a stainless steel spoon and then sub-sampled by spoon into each sample container. Loose sand and gravel that do not have the ability to accumulate metals were not included in the analyses. Sediment samples were sampled using van Veen grab sampler. About 1 cm of the surface sediments were taken by a PE spoon and put into the pre acid cleaned PE jars. The collected samples were immediately frozen with dry ice. In the laboratory, all samples were dried with a freeze dryer (LabconcoFreezone 6) and grounded with an automatic agate mortar (Fritsch Corp. Pulverisette 6) before metal analysis. Sampling techniques ensured that changes in the composition of the samples as a result of chemical, physical or biological action were minimised, that cross-contamination of samples did not occur during sub-sampling and that samples were kept in order between sampling and receipt by the analyzing laboratories.
Laboratory analyses. Analyses were carried out on the < 63 μm fraction but the sieving method varied slightly. Initially the samples were dried at 105℃, and then sieved through a 0.5 mm nylon mesh sieve. The fraction that passed through this sieve was then sieved through a 63 μm sieve. This < 63 μm fraction was then analysed for total metal by emission spectroscopy. Because of the sieving processes involved, only fine sediments were analysed. Silaceous sediments were largely removed by the sieving process. These coarse sediments were unlikely to adsorb significant amounts of metals.
Total organic carbon (TOC) contents were determined by a C/S analyzer (LECO-SC 444) after eliminating inorganic carbon with 1 N HCl. For metal analysis including Fe, Mn, Cr, Co, Ni, Cu, Zn, As, Cd, and Pb, about 50 mg of sediment was weighed and completely digested using acidcleaned Teflon bomb with 2 ml ofhydrofluoric acid, 2.5 ml of hydrochloric acid (Merck Suprapurin both cases) and 1 ml of nitric acid (Merck Ultrapur) for 24-hr at 180℃ in a clean room. After digestion, the samples were dried and redissolved with 1% HNO3 (16). Metals were analyzed by using inductively coupled plasma-mass spectroscopy-ICP/ MS (Thermo Elemental X-7). Hg was analyzed by cold vapor atomic fluorescence spectrometry after digestion with 5 ml of 1 : 1 HNO3 and HCl on a hot plate at about 120℃ for 4-hr using a Teflon bomb. Quality control of metal analysis in this study was checked by using marine sediments SRM (MESS-2 of NRC, Canada) as a reference standard. Recoveries of all metals ranged from 95.2% for Cr to 105% for Pb. The results indicate good agreement between the certified and the analytical values.
Chemometric assessment. Chemometric assessment including Pearson’s product moment correlation coefficient (r), principal component analysis and hierarchical cluster analysis were carried out on metal concentrations in sediments. Principal component analysis (PCA) was used for orthogonal linear transformations of the experimental data to new Coordinate system such that the greatest variance by any projection of the data comes to lie on the first coordinate (called the first principal component), the second greatest variance on the second coordinate, and so on. It was also used for dimensionality reduction in the sediment data set by retaining those characteristics of the data set that contribute most to its variance, by keeping higher-order principal components and ignoring lower-order ones. Eigenvalues > 1 were taken as criterion for the extraction of the principal components required for explaining the source of variances in the sediment data set. Based on the strength of the Eigenvalues and the Scree Plots, only the first four principal components were selected for the present study. To avoid influence of the data size, a preliminary step of data scaling (logarithmic transformation) was done where normalized dimensionless numbers replaces the real data values. Thus, even serious differences in absolute (concentration) values were reduced to close numbers. Then, the similarity (or more strictly, the distance) between the objects in the variable space were determined using hierarchical clustering. The hierarchical clustering produced a dendrogram showing how sampling locations are clustered based on metal concentrations in sediments statistical analysis.
Statistical analysis. Statistical methods were applied to process the analytical data in terms of its distribution and correlation among the studied parameters. The commercial statistics software package IBM SPSS version 19.0 for Windows was used for statistical analyses in the present study. Basic statistical parameters such as mean, standard deviation (SD), minimum, maximum, skewness and kurtosis were computed. Also, standard errors of skewness and kurtosis were computed.
Human health risk assessment. Human health risk assessment in this study consists of four fundamental steps. Hazard identification, exposure assessment, dose-response assessment and risk characterization. According to Armah et al. (19), the hazard identification involves review of key research to identify any potential health problems that heavy metals can cause. Exposure assessment involves the determination of the amount, duration, and pattern of exposure to the heavy metals. Dose-response assessment estimates how much of the heavy metals it would take to cause varying degrees of health effects that could lead to illnesses. Finally, risk characterization involves the assessment of the risk for the heavy metals to cause cancer or other illnesses in the general population. In this study, ingestion of sediment and dermal contact with sediment are considered as the main routes through which adults and children are exposed to the metal contaminants.
Ingestion of sediment: Adults walking outdoors may ingest sediment through incidental contact of the mouth with hands and clothing. Sediment ingestion by children is often the primary exposure route of concern for contaminated sediments (20,21). Intake of contaminants in sediment by ingestion is estimated as follows:
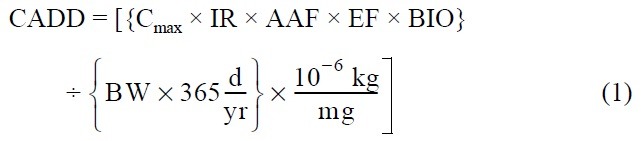
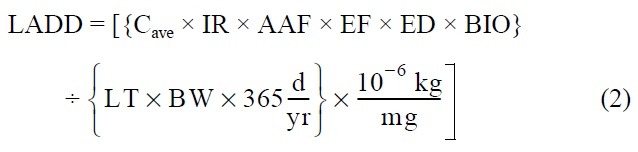
Where CADD = chronic average daily dose [mg/kg-day]
LADD = lifetime average daily dose [mg/kg-day]
Cmax = maximum 7-year average concentration of heavy metal in sediment [mg/kg]
Cave = time-averaged concentration of heavy metal in sediment over the exposure duration [mg/ kg]
IR = sediment ingestion rate [mg/day]
AAF = chemical-specific oral-sediment absorption adjustment factor [mg/mg]
BIO = bioavailability of heavy metal in sediment [mg/mg]
EF = exposure frequency [events/yr]
ED = exposure duration [yrs]
LT = lifetime = 70 years by definition
BW = body weight [kg]
Dermal contact with sediment: Some sediment contaminants may be absorbed across the skin into the bloodstream. Absorption will depend upon the amount of sediment in contact with the skin, the concentration of chemicals in sediment, the skin surface area exposed, and the potential forthe chemical to be absorbed across skin. The intake is computed as follows:
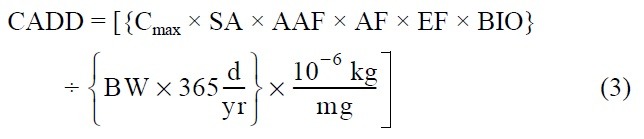
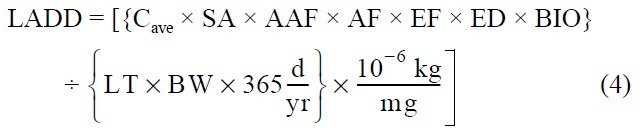
Where:
Cmax = maximum 7-year average concentration of heavy metal in sediment [mg/kg]
Cave = time-averaged concentration of heavy metal in sediment over the exposure duration [mg/ kg]
SA = skin surface area exposed to sediment [cm2]
AAF = dermal-sediment heavy metal specific absorption adjustment factor [mg/mg]
BIO = bioavailability of heavy metal in sediment [mg/mg]
AF = sediment-to-skin adherence factor [mg/cm2/ event]
The rest of the variables are as defined previously. The skin surface area available for sediment exposure will vary seasonally and between receptors.
Calculation of carcinogenic risk: For carcinogens, risks are estimated as the incremental probability of an individual developing cancer over a lifetime as a result of exposure to the potential carcinogen. This risk is referred to as the individual excess lifetime cancer risk, IELCR, or carcinogenic risk. Published values of chemical carcinogenic toxicity (slope factor) are used to calculate risk from the LADD:

Where
IELCRij = individual excess lifetime cancer risk for heavy metal i, exposure route i [dimensionless]
SFij = slope factor for heavy metal i, exposure route j [mg/kg-d]−1
LADDij = lifetime average daily dose for chemical i, exposure route j [mg/kg-d]
This approach to estimating risk is based on the linear lowdose cancer risk model described by the Albering et al. (20), and is considered valid for risks below 0.01. The model assumes that exposure to any amount of a carcinogen will increase the risk of cancer, i.e. there is no safe or threshold dosage. This assumption is fundamentally different from that assumed for non-carcinogens, where a safe “reference dose” exists.
Calculation of non-carcinogenic risk (hazard index): This ratio of exposure to toxicity for an individual pathway and chemical is called a hazard quotient. The hazard quotients are usually added across all chemicals and routes to estimate the hazard index. The non-cancer hazard quotient assumes that there is a level of exposure below whichit is unlikely that even sensitive populations would experience adverse health effects (20). This reference dose, or RfD, is a toxicity value for evaluating non carcinogenic effects. It has the same units as intake and it is assumed that if the intakeis below the RfD (hazard quotient < 1) no adverse health effects occur, even if the receptor is exposed to this dose continuously over a lifetime. The hazard quotient for an individual chemical and individual route is calculated by:

Where
HQij = hazard quotient for heavy metal i, exposure route j [dimensionless]
CADDij = chronic daily intake for heavy metal i, exposure route j [mg/kg-d]
RfDij = reference dose for heavy metal i, exposure route j [mg/kg-d]
The hazard quotients from each heavy metal and route are then added to obtain thehazard index:
HI = ΣHQij
Where
HI = hazard index [dimensionless]
HQij = hazard quotient for heavy metal i, exposure route j [dimensionless]
The hazard index is an indication of the potential for adverse noncarcinogenic effects, and is not a probabilistic risk. As a rule, the greater the valueof the hazard index the greater the level of concern. Hazard indices above one generally indicate the potential for adverse health effects and suggest the need to undertake a further level of investigation or possibly remedial action.
RESULTS AND DISCUSSION
Heavy metals in sediments. Descriptive statistics of heavy metal concentrations of sediments present in rivers in the 5 gold mining districts (Fig. 1) are presented in Table 1. As confirmed by the skewness values (Table 1), the concentrations of elements are characterized by large variability, with positively skewed frequency distributions. This is widespread for heavy metals for the reason that they typically have low concentrations in the environment, so that the presence of a point source of contamination may cause a sharp increase in local concentration, exceeding the thresholds (14). Heavy metals in sediments often exhibit complex interrelationships (22). Numerous factors control their relative abundance; e.g., the original heavy metal contents of rocks and parent materials, processes of soil formation, contamination by human activities, and other anthropogenic factors (23).
Fig. 1. Map of Ghana showing the study area and sampling locations.

Table 1.
Summary statistics of metal and metalloid concentrations in sediments (n = 250)
| District | Statistics* | Co | Fe | Ni | Zn | Cu | Mn | Pb | Cr | Cd | As | Hg |
|---|---|---|---|---|---|---|---|---|---|---|---|---|
| Tarkwa Nsuaem (N = 57) | Mean | 31.17 | 9299.74 | 21.16 | 26.67 | 529.89 | 420.58 | 52.21 | 31.71 | 0.15 | 8.47 | 6.98 |
| Std. Deviation | 27.35 | 15058.20 | 8.76 | 11.95 | 1052.24 | 34.63 | 58.00 | 19.03 | 0.17 | 8.98 | 13.63 | |
| Minimum | 11.88 | 9.94 | 9.50 | 12.52 | 0.66 | 316.57 | 0.58 | 10.10 | 0.04 | 0.89 | 0.04 | |
| Maximum | 112.15 | 45736.53 | 37.61 | 54.42 | 4422.00 | 489.66 | 208.02 | 84.06 | 0.54 | 43.29 | 50.88 | |
| Bibiani (N = 83) | Mean | 306.83 | 96.48 | 302.46 | 44.48 | 24152.16 | 27.31 | 20.71 | 20.10 | 295.63 | 10.18 | 45.16 |
| Std. Deviation | 153.48 | 169.58 | 132.77 | 9.48 | 14669.93 | 6.32 | 2.40 | 9.76 | 431.59 | 5.09 | 19.47 | |
| Minimum | 96.46 | 12.58 | 98.80 | 25.30 | 4510.00 | 21.50 | 15.90 | 4.16 | 22.82 | 2.50 | 9.48 | |
| Maximum | 597.46 | 866.94 | 725.20 | 50.50 | 63220.00 | 35.30 | 25.80 | 38.28 | 1600.20 | 19.96 | 75.84 | |
| Amansie West (N = 30) | Mean | 103.65 | 19.62 | 127.48 | 14.59 | 16137.55 | 24.81 | 22.71 | 5.97 | 73.56 | 1.97 | 21.65 |
| Std. Deviation | 32.75 | 15.17 | 187.17 | 2.07 | 15661.63 | 4.98 | 2.68 | 2.83 | 56.65 | 1.52 | 22.06 | |
| Minimum | 55.46 | 6.57 | 37.28 | 9.50 | 1456.53 | 22.10 | 20.40 | 1.96 | 10.78 | 0.26 | 4.99 | |
| Maximum | 149.18 | 44.02 | 681.45 | 15.50 | 45626.31 | 37.60 | 30.50 | 9.72 | 183.56 | 5.35 | 69.96 | |
| Birim North (N = 30) | Mean | 24.42 | 27.15 | 1.70 | 3.22 | 20.42 | 3.75 | 6.28 | 20.45 | 0.25363 | 360.57 | 397.36 |
| Std. Deviation | 1.74 | 10.16 | 0.97 | 1.80 | 8.07 | 3.00 | 3.39 | 9.60 | 0.01 | 294.68 | 11.47 | |
| Minimum | 19.00 | 3.11 | 1.25 | 1.01 | 6.08 | 0.70 | 1.98 | 8.48 | 0.250 | 250.00 | 350.00 | |
| Maximum | 25.00 | 38.00 | 4.43 | 6.44 | 38.20 | 9.40 | 13.80 | 48.50 | 0.32 | 1490.00 | 400.00 | |
| Upper Denkyira (N = 50) | Mean | 20.41 | 54792.35 | 9.52 | 21.84 | 3109.75 | 1926.77 | 610.86 | 4997.77 | 13.84 | 243.03 | 11.87 |
| Std. Deviation | 1.64 | 110331.49 | 1.43 | 4.58 | 794.99 | 965.87 | 912.29 | 8835.89 | 34.73 | 244.19 | 8.70 | |
| Minimum | 14.10 | 1182.07 | 5.00 | 2.90 | 1848.48 | 703.45 | 0.01 | 15.00 | 0.01 | 33.34 | 3.71 | |
| Maximum | 20.90 | 487430.17 | 10.00 | 22.90 | 4959.74 | 4622.91 | 3002.79 | 38392.46 | 116.63 | 1010.83 | 34.99 | |
*Concentration of As and Hg are in μgkg?1.
The results in Table 1 indicate that heavy metal concentrations are highly variable and have accumulated in the sediments of the riverine environments in the gold mining areas in Ghana. The highest concentrations of Pb and Mn in sediment were obtained in Fobinso west of the confluence of River Offin and Fobinso in the Upper Denkyira District of Ghana. This water course not clogged by weeds; is slow flowing; adjacent a cocoa farm and shows evidence of galamsey (small-scale gold mining) activity. The highest concentration of Cr in sediment was obtained from a stationary stream with lots of vegetation along the channel. There was evidence of galamsey (small-scale gold mining) activity. This location is about 100 m from Kopa Cliff Mining Company. The lowest concentration of Hg in sediment was obtained from a stream in Bonsaaso in the Amansie West District of Ghana whereas the highest concentration of mercury in sediment was observed in the Angonabeng River in the Tarkwa Nsuaem municipality of Ghana.
The highest concentrations of As in sediment were obtained from river Nyam in the Obuasi municipality. The extremely high concentration of As in sediments from river Nyam is expected since it is a direct recipient of discharges from the treatment retention sump and tailings dam of a large scale mining company in the area. Communities that originally depended on river Nyam have now been banned from using it as a drinking water source. Streams in Twiagya community in the Prestea Huni Valley District also had high concentrations of As in sediments. Generally, the levels of Cd and Cr in sediments from streams in the Amansie West District were low unlike from streams in the BibianiAnhwiasoBekwai District. Ghana currently has no sediment quality guidelines therefore it is difficult to compare the metal concentrations in sediments obtained in this study with national guideline values. However, when compared with international sediment quality guideline values given by Burton (24), only the concentrations of Ni and Zn in sediment were lower than threshold values given by the Australian and New Zealand Environment and Conservation Council (ANZECC), Hong Kong Interim Sediment Quality Guidelines (ISQG) and Canadian Freshwater Sediment Guidelines. The levels of As in sediment were also lower than the threshold values given by the Australian and New Zealand Environment and Conservation Council (ANZECC). The concentrations of Pb, Cd and As were almost twice more than the threshold values of Hong Kong Interim Sediment Quality Guidelines (ISQG). The concentrations of Hg, Cu and Cr in sediments were 14, 20 and 26 times more than the Canadian Freshwater Sediment Guidelines for these elements. Similarly, the concentrations of Pb, Cu, Cr and Hg were 3, 11, 12 and 16 times more than the Australian and New Zealand Environment and Conservation Council (ANZECC) sediment guideline values.
Heavy metal contaminations in sediment could affect the water quality, the bioassimilation and bioaccumulation of metals in aquatic organisms, resulting in potential long-term effects on human health and ecosystem (5,6). The metal concentrations in sediments are greatly influenced by anthropogenic sources that include use of fertilizers and herbicides, municipal sewage, and effluents from gold mining activities (6). Chemical adsorption between the metals, grain size, and organic matter appear to have contributed largely in the metal immobilization process. Marchand et al. (25) argue that river flowing through mining areas may bring pollutants to the downstream riverine sediments, where they are incorporated in mud bank cycle. It is asserted that sediment chemical composition and diagenesis may contribute to metal accumulation in sediment (5). Factors controlling metal behavior include oxidation and reduction horizons, bioturbation and water fluctuations (26).
Chemometric assessment. Correlation of metal concentrations in sediment: Results of Pearson’s correlation coefficients and their significance levels (p < 0.05 and p < 0.01) of correlation analysis are shown in Table 2. Correlation analyses have been widely applied in environmental studies. According to Armah et al., (16) and Al-Khashman and Shawabkeh (27), correlation analysis is a useful technique for revealing the relationships between multiple variables in order to understand the factors as well as sources of chemical components. Heavy metals in riverine environments typically have complicated relationships among them. The high correlations between heavy metals may indicate that the accumulated concentrations of these heavy metals came from similar pollution sources (16,28). The concentrations of Fe, Zn, Mn and Ni showed strong positive relationship (p < 0.01) with each other. This indicates that Fe, Zn, Mn and Ni possibly originate from the same source. This is inconsistent with the findings of Han et al. (29) who observed that the concentration of Mn showed very weak correlations with the concentrations of Cu, Cd and Zn. Cu and Cr originate from the same source likewise As and Hg. However, the concentration of Co showed very weak correlations with the concentrations of the other metals. This indicates that Co has a different origin than As, Hg, Cr, Cu, Zn, Pb and Cd. Similar results have been obtained by Facchinelli et al. (30).
Table 2.
Pearson’s product moment correlation coefficients
| Co | Fe | Ni | Zn | Cu | Mn | Pb | Cr | Cd | As | Hg | |
|---|---|---|---|---|---|---|---|---|---|---|---|
| Co | 1 | .178 | .220* | .126 | ?.171 | .003 | .140 | ?.045 | .183 | .362** | .297** |
| Fe | 1 | .607** | .632** | .178 | .570** | ?.133 | .472** | ?.199* | .369** | .252* | |
| Ni | 1 | .858** | ?.009 | .604** | .058 | .023 | ?.266** | .181 | ?.009 | ||
| Zn | 1 | .300** | .749** | .003 | .273** | ?.233* | ?.038 | ?.239* | |||
| Cu | 1 | .657** | ?.045 | .711** | .059 | ?.465** | ?.582** | ||||
| Mn | 1 | .048 | .595** | ?.112 | ?.188 | ?.422** | |||||
| Pb | 1 | ?.136 | .044 | ?.089 | ?.087 | ||||||
| Cr | 1 | ?.068 | ?.076 | ?.207* | |||||||
| Cd | 1 | ?.008 | ?.051 | ||||||||
| As | 1 | .875** | |||||||||
| Hg | .1 | ||||||||||
*. Correlation is significant at the 0.05 level (2-tailed).
**. Correlation is significant at the 0.01 level (2-tailed).
Principal component analysis: The skewed data on heavy metals in sediment were log transformed before chemometric assessment. To study the spatial variability of heavy metals in sediments a principal component analysis followed by a varimax rotation of the normally distributed means was calculated. This principal component analysis can be seen as a sorting mechanism of the information of a correlation matrix.
To facilitate the interpretation of the results it is useful to distinguish three sources of heavy metal input: dissolved heavy metals from waste waters; heavy metals as particles from waste waters; and heavy metals from soil erosion. From Table 3, four principal components are sufficient to cover 81 per cent of variance from 11 variables. Principal components were arranged according to their shares of variance. The first two components alone explain about 50% of the variance in the sediment data. The first principal component shows high loadings in Ni, Zn and Mn (Table 4). Co and Cu are obviously of different origin, because they load components 3 and 4. However, As and Hg are of identical origin as both load component 2. In fact, both can be traced to small scale artisanal gold mining activities that are known for the widespread use of Hg. Table 4 shows the component matrix and loadings of heavy metals after varimax rotation.
Table 3.
Total variance explained by principal components
| Total Variance in metal concentrations in sediment explained | |||||||||
|---|---|---|---|---|---|---|---|---|---|
| Component | Initial Eigenvalues | Extraction Sums of Squared Loadings | Rotation Sums of Squared Loadings | ||||||
| Total | % of Variance | Cumulative % | Total | % of Variance | Cumulative % | Total | % of Variance | Cumulative % | |
| 1 | 3.643 | 33.116 | 33.116 | 3.643 | 33.116 | 33.116 | 2.980 | 27.088 | 27.088 |
| 2 | 2.686 | 24.418 | 57.534 | 2.686 | 24.418 | 57.534 | 2.498 | 22.706 | 49.794 |
| 3 | 1.366 | 12.421 | 69.955 | 1.366 | 12.421 | 69.955 | 2.196 | 19.959 | 69.753 |
| 4 | 1.226 | 11.141 | 81.096 | 1.226 | 11.141 | 81.096 | 1.248 | 11.343 | 81.096 |
| 5 | 0.824 | 7.487 | 88.582 | ||||||
| 6 | 0.581 | 5.280 | 93.863 | ||||||
| 7 | 0.243 | 2.211 | 96.074 | ||||||
| 8 | 0.161 | 1.460 | 97.534 | ||||||
| 9 | 0.130 | 1.183 | 98.717 | ||||||
| 10 | 0.073 | 0.665 | 99.382 | ||||||
| 11 | 0.068 | 0.618 | 100.000 | ||||||
Extraction Method: Principal Component Analysis.
Table 4.
Component matrix of metal concentrations in sediments
| Rotated Component Matrixa | |||||
|---|---|---|---|---|---|
| Component | Communalities | ||||
| 1 | 2 | 3 | 4 | ||
| Co | .202 | .415 | –.041 | .676 | .672 |
| Fe | 675 | .432 | .438 | –.072 | .838 |
| Ni | .946 | .093 | –.081 | .025 | .911 |
| Zn | .919 | –.104 | .192 | .000 | .892 |
| Cu | .119 | –.490 | .790 | .034 | .879 |
| Mn | .709 | –.276 | .563 | .064 | .900 |
| Pb | .167 | –.285 | –.350 | .549 | .533 |
| Cr | .152 | –.032 | .900 | –.060 | .838 |
| Cd | –.399 | –.012 | .193 | .684 | .665 |
| As | .089 | .928 | –.075 | .079 | .882 |
| Hg | –.094 | .927 | –.205 | –.009 | .910 |
Extraction Method: Principal Component Analysis.
Rotation Method: Varimax with Kaiser Normalization.
aRotation converged in 8 iterations.
Hierarchical cluster analysis: Hierarchical clustering produced adendrogram (not shown), in which metals in sediment are related to the sampling locations. Four clusters are discernible and could be divided into two bigger subgroups: the first contains heavily polluted sites from Tarkwa and Prestea (near to small-scale mining activities) and several sites near to large scale gold mining activities in Obuasi and Tarkwa.The second indicates a moderately polluted buffer zone consisting of streams and rivers in Bibiani. In both big clusters two subgroups could be found. In the first one they represent the most severely polluted areas (large scale gold mining in Obuasi, Tarkwa, and Prestea and small scale mining in Dunkwa-on-Offin) and the less contaminated agricultural inlets (sites from Amansie West). In the second one, they reflect the separation between one (Lake Amponsah and non-affected parts) moderately affected or another part (AbubaYenunu and Asusuo) of the buffer zone least affected by metal pollutants in Bibiani.
Human health risk assessment. Carcinogenic risk: For child and adult residents, carcinogenic risks were determined only for As under CTE (typical) and RME scenarios. For ingestion of sediment under CTE scenario, cancer risk of child and adult residents from exposure to As were 4.18E-06 and 1.84E-07, respectively. This implies a likelihood that up to 4 children, out of one million equally exposed children would contract cancer if exposed continuously to the specific concentration over 70 years (the assumed lifetime). These values are comparable to results obtained by Albering et al. (20,21) in the Netherlands. For ingestion of sediment under RME scenario, cancer risk of child and adult residents from exposure to As were 2.50E-05 and 1.34E-05, respectively. This implies a likelihood that up to 3 children, out of ten thousand equally exposed children would contract cancer if exposed continuously to the specific concentration over 70 years (the assumed lifetime). It also implies a likelihood that up to 1 adult, out of ten thousand equally exposed adults would contract cancer if exposed continuously to the specific concentration over 70 years (the assumed lifetime). In the Netherlands, comparable results were obtained by Albering et al. (20). However, the cancer risks due to As were far lower than that reported for by Lim et al. (31) for an abandoned Songcheon Au-Ag mine in Korea.
For dermal contact with sediment under CTE scenario, cancer risk of child and adult residents from exposure to As were 2.46E-07 and 5.57E-08, respectively. For dermal contact with sediment under RME scenario, cancer risk of child and adult residents from exposure to As were 3.00E-06 and 4.62E-06, respectively. The cancer risk values for children and adults are comparable to the cancer risk values for children and adults living near Lakes Eijsden and Dilkensplas in the Netherlands (20).
Non-cancer risks: Non-carcinogenic risks from exposure to As, Cd, Cr (VI), Cu, Pb, Hg, Ni and Zn were calculated for child and adult residents in both CTE and RME scenarios. Table 5 summarises the intake parameters used in calculating the non-cancer risks.
Table 5.
Receptor and intake parameters for adult and child residents used in the human health risk assessment
| Parameter | Child Resident CTE | Child Resident RME | Adult Resident CTE | Adult Resident RME | |
|---|---|---|---|---|---|
| Lifetime (years) | 70 | 70 | 70 | 70 | |
| Body weight (kg) | 15 | 15 | 70 | 70 | |
| Exposure frequency for sediment (events/year) | 130 | 350 | 40 | 350 | |
| Exposure duration for sediment (year) | 6 | 6 | 9 | 30 | |
| Ingestion rate for sediment [mg/day] | 90 | 200 | 40 | 100 | |
| Total skin surface area [cm2] | 6800 | 7280 | 18400 | 23000 | |
| Fraction of skin exposed to sediment [-] | 0.13 | 0.55 | 0.11 | 0.25 | |
| Sediment/skin adherence factor [mg/cm2] | 0.2 | 0.2 | 0.2 | 0.2 | |
By default, the parameters in Table 5 are based on various statistical distributions. Life time in years is held constant for both child and adult residents in the CTE and RME scenarios. Body weight is based on a normal distribution. However, ingestion rate for sediment and exposure duration for sediment on lognormal distributions whereas exposure frequency for sediment, fraction of skin exposed to sediment and sediment-skin adherence factor on triangular distributions. Tables 6 and 7 show the daily doses and non-cancer risks for child and adult residents, respectively.
Table 6.
Daily doses and non-carcinogenic risk for child residents
| Metal | Ingestion of Sediment | |||||
|---|---|---|---|---|---|---|
| Central Tendency Exposure (CTE) | Reasonable Maximum Exposure (RME) | |||||
| CADD | LADD | Hazard index | CADD | LADD | Hazard index | |
| As | 3.25E-05 | 2.78E-06 | 1.08E-01 | 1.94E-04 | 1.67E-05 | 6.48E-01 |
| Cd | 5.98E-06 | 5.13E-07 | 1.20E-02 | 3.58E-05 | 3.07E-06 | 7.16E-02 |
| Cr(VI) | 2.10E-03 | 1.80E-04 | 7.01E-01 | 1.26E-02 | 1.08E-03 | 4.20 |
| Cu | 1.57E-03 | 1.35E-04 | 4.24E-02 | 9.40E-03 | 8.05E-04 | 2.54E-01 |
| Pb | 2.86E-04 | 2.45E-05 | 7.95E-02 | 1.71E-03 | 1.47E-04 | 4.76E-01 |
| Hg | 5.02E-06 | 4.30E-07 | 1.67E-02 | 3.00E-05 | 2.58E-06 | 1.00E-01 |
| Ni | 3.69E-05 | 3.16E-06 | 1.84E-03 | 2.21E-04 | 1.89E-05 | 1.10E-02 |
| Zn | 4.16E-05 | 3.56E-06 | 1.39E-04 | 2.49E-04 | 2.13E-05 | 8.29E-04 |
| Dermal Contact with Sediment | ||||||
| As | 1.91E-06 | 1.64E-07 | 6.38E-03 | 2.33E-05 | 2.00E-06 | 7.78E-02 |
| Cd | 1.18E-08 | 1.01E-09 | 2.35E-05 | 1.43E-07 | 1.23E-08 | 2.87E-04 |
| Cr(VI) | 4.13E-05 | 3.54E-06 | 1.38E-02 | 5.04E-04 | 4.32E-05 | 1.68E-01 |
| Cu | 3.09E-05 | 2.64E-06 | 8.34E-04 | 3.76E-04 | 3.23E-05 | 1.02E-02 |
| Pb | 5.62E-06 | 4.82E-07 | 1.56E-03 | 6.85E-05 | 5.88E-06 | 1.90E-02 |
| Hg | 9.87E-07 | 8.46E-08 | 3.29E-03 | 1.20E-05 | 1.03E-06 | 4.01E-02 |
| Ni | 7.24E-07 | 6.21E-08 | 3.62E-05 | 8.83E-06 | 7.57E-07 | 4.42E-04 |
| Zn | 8.17E-07 | 7.00E-08 | 2.72E-06 | 9.96E-06 | 8.53E-07 | 3.32E-05 |
Table 7.
Daily doses and non-carcinogenic risk for adult residents
| Metal | Ingestion of Sediment | |||||
|---|---|---|---|---|---|---|
| Central Tendency Exposure (CTE) | Reasonable Maximum Exposure (RME) | |||||
| CADD | LADD | Hazard index | CADD | LADD | Hazard index | |
| As | 9.52E-07 | 1.22E-07 | 3.17E-03 | 2.08E-05 | 8.92E-06 | 6.94E-02 |
| Cd | 1.75E-07 | 2.25E-08 | 3.51E-04 | 3.84E-06 | 1.64E-06 | 7.67E-03 |
| Cr(VI) | 6.17E-05 | 7.93E-06 | 2.06E-02 | 1.35E-03 | 5.78E-04 | 4.50E-01 |
| Cu | 4.60E-05 | 5.92E-06 | 1.24E-03 | 1.01E-03 | 4.31E-04 | 2.72E-02 |
| Pb | 8.38E-06 | 1.08E-06 | 2.33E-03 | 1.83E-04 | 7.86E-05 | 5.09E-02 |
| Hg | 1.47E-07 | 1.89E-08 | 4.91E-04 | 3.22E-06 | 1.38E-06 | 1.07E-02 |
| Ni | 1.08E-06 | 1.39E-07 | 5.40E-05 | 2.36E-05 | 1.01E-05 | 1.18E-03 |
| Zn | 1.22E-06 | 1.57E-07 | 4.06E-06 | 2.66E-05 | 1.14E-05 | 8.88E-05 |
| Dermal Contact with Sediment | ||||||
| As | 2.89E-07 | 3.72E-08 | 9.63E-04 | 7.18E-06 | 3.08E-06 | 2.39E-02 |
| Cd | 1.77E-09 | 2.28E-10 | 3.55E-06 | 4.41E-08 | 1.89E-08 | 8.82E-05 |
| Cr(VI) | 6.24E-06 | 8.02E-07 | 2.08E-03 | 1.55E-04 | 6.65E-05 | 5.17E-02 |
| Cu | 4.66E-06 | 5.99E-07 | 1.26E-04 | 1.16E-04 | 4.96E-05 | 3.13E-03 |
| Pb | 8.49E-07 | 1.09E-07 | 2.36E-04 | 2.11E-05 | 9.04E-06 | 5.86E-03 |
| Hg | 1.49E-07 | 1.91E-08 | 4.96E-04 | 3.70E-06 | 1.59E-06 | 1.23E-02 |
| Ni | 1.09E-07 | 1.41E-08 | 5.47E-06 | 2.72E-06 | 1.16E-06 | 1.36E-04 |
| Zn | 1.23E-07 | 1.58E-08 | 4.11E-07 | 3.06E-06 | 1.31E-06 | 1.02E-05 |
From Tables 6 and 7, it is observed that children are generally at higher non-cancer risks compared to adults in CTE and RME scenarios. Similarly, in both children and adults, ingestion of sediment poses higher non-cancer risks compared to dermal contact with sediments. In Table 6, for ingestion of sediment, the lowest hazard index in the CTE scenario is attributable to Zn whereas the highest hazard index is attributable to Cr (VI). In the RME scenario, a similar trend is observed. The highest hazard index for child residents in the RME scenario from exposure to Cr (VI) is greater than 1. This implies that adverse health effects from exposure to Cr (VI) are possible. For ingestion of sediment by adult residents, the lowest hazard index in the CTE scenario is attributable to Zn whereas the highest hazard index is attributable to Cr (VI). In the RME scenario, a similar trend is observed. None of the metals individually exceeded the hazard quotient threshold of 1 except Cr (VI). However, the metals cumulatively had hazard index greater than 1. For ingestion of sediments by adults and children, hazard indices of As, Cd, Cu and Hg were higher than values reported by Lim et al. (31) for an abandoned Songcheon Au-Ag mine in Korea. However, the HI of Zn was comparable to results obtained by Lim et al. (31).
For ingestion of sediments, HI of As obtained in this study for children and adults was greater than values reported for those living near Lakes Eijsden and Dilkensplas in the Netherlands by Albering et al. (20). However, HI for Cd, Pb and Zn were lower than results obtained by Albering et al. (20) for adults and children living near Lakes Eijsden and Dilkensplas in the Netherlands. HI for Cu was consistent with the resulted reported by Albering et al. (20).
Fig. 2 shows the hazard indices for each of the metals in the CTE (typical) scenario and Fig. 3 shows the hazard indices for each of the metals in the RME scenario. For child residents in the CTE scenario, the order of hazard index is Cr (VI) >As > Pb > Cu > Hg > Cd > Ni > Zn. For adult residents in the CTE scenario, the order of hazard index is Cr (VI) > As > Pb > Cu >Hg > Ni > Zn. For child residents in the RME scenario, the order of hazard index is Cr (VI) > As > Pb > Cu > Hg > Ni > Zn. Similar trends are observed for adult residents in the RME scenario.
Fig. 2. Non-carcinogenic risk (hazard index) of child and adult residents in the central tendency exposure (CTE) scenario.

Fig. 3. Non-carcinogenic risk (hazard index) of child and adult residents in the reasonable maximum exposure (RME) scenario.

A chemometric approach and human health risk assessment have proven to be useful in determining the spatial distribution patterns of heavy metals in riverine sediments in active gold mining areas and to identify human impacts at local scales. In general, the sediment heavy metal concentrations in areas where small scale gold mining activities are rife were higher than in areas where agriculture is the mainstay. Furthermore, sediment heavy metal accumulation was much higher in lakes compared to the rivers, perhaps due to the lower turbulence and mixing in the lacustrine environment. Since heavy metals in sediments threaten the health of aquatic animals (e.g. premature hatching, growth retardation, developmental abnormalities, and increased mortality) and humans, it is important to analyze and to control the sources of pollution. In future, studies should focus on the concentrations of persistent pollutants in various organisms in relation to those in sediments and trophic levels in order to assess the ecological risk on the food chain.
References
- 1.Muniz P., Danul E., Yannicelli B., García-Alonso J., Medina G., Bícego M.C. Assessment of contamination by heavy metals and petroleum hydrocarbons in sediments of Montevideo Harbour (Uruguay). Environ. Int. (2004);29:1019–1028. doi: 10.1016/S0160-4120(03)00096-5. [DOI] [PubMed] [Google Scholar]
- 2.Xia P., Meng X., Yin P., Cao Z., Wang X. Eighty-year sedimentary record of heavy metal inputs in the intertidal sediments from the Nanliu River estuary, Beibu Gulf of South China Sea. Environ. Pollut. (2011);159:92–99. doi: 10.1016/j.envpol.2010.09.014. [DOI] [PubMed] [Google Scholar]
- 3.Caeiro S., Costa M.H., Ramos T.B., Fernandes F., Silveira N., Coimbra A., Medeiros G., Painho M. Assessing heavy metal contamination in Sado Estuary sediment: An index analysis approach. Ecol. Indic. (2005);5:151–169. [Google Scholar]
- 4.Sundaray S.K., Nayak B.B., Lin S., Bhatta D. Geochemical speciation and risk assessment of heavy metals in the river estuarine sediments - a case study: Mahanadi basin, India. J. Hazard. Mater. (2011);186:1837–1846. doi: 10.1016/j.jhazmat.2010.12.081. [DOI] [PubMed] [Google Scholar]
- 5.Besser J.M., Brumbaugh W.G., Allert A.L., Poulton B.C., Schmitt C.J., Ingersoll C.G. Ecological impacts of lead mining on Ozark streams: toxicity of sediment and pore water. Ecotoxicol. Environ. Saf. (2009);72:516–526. doi: 10.1016/j.ecoenv.2008.05.013. [DOI] [PubMed] [Google Scholar]
- 6.Pan K., Wang W.X. Trace metal contamination in estuarine and coastal environments in China. Sci. Total Environ. (2012);422:3–16. doi: 10.1016/j.scitotenv.2011.03.013. [DOI] [PubMed] [Google Scholar]
- 7.Ridgway J., Breward N., Langston W.J., Lister R., Rees J.G., Rowlatt S.M. Distinguishing between natural and anthropogenic sources of metals entering the Irish Sea. Appl. Geochem. (2003);18:283–309. [Google Scholar]
- 8.Buccolieri A., Buccolieri G., Cardellicchio N., Dell’Atti A., Leo A.D., Maci A. Heavy metals in marine sediments of Taranto Gulf (Ionian Sea, Southern Italy). Mar. Chem. (2006);99:227–235. [Google Scholar]
- 9.Hjortenkrans D., Bergbäck B., Häggerud A. New metal emission patterns in road traffic environments. Environ. Monit. Assess. (2006);117:85–98. doi: 10.1007/s10661-006-7706-2. [DOI] [PubMed] [Google Scholar]
- 10.Wu S., Zhou S., Li X. Determining the anthropogenic contribution of heavy metal accumulations around a typical industrial town: Xushe, China. J. Geochem. Explor. (2011);110:92–97. [Google Scholar]
- 11.Peng J.F., Song Y.E., Yuan P., Cui X.Y., Qiu G.L. The remediation of heavy metals contaminated sediment. J. Hazard. Mater. (2009);161:633–640. doi: 10.1016/j.jhazmat.2008.04.061. [DOI] [PubMed] [Google Scholar]
- 12.Kelderman P., Osman A.A. Effect of redox potential on heavy metal binding forms in polluted canal sediments in Delft (The Netherlands). Water Res. (2007);41:4251–4261. doi: 10.1016/j.watres.2007.05.058. [DOI] [PubMed] [Google Scholar]
- 13.Olivares-Rieumont S., de la Rosa D., Lima L., Graham D.W., D' Alessandro K., Borroto J., Martínez F., Sánchez J. Assessment of heavy metal levels in Almendares River sediments-Havana City, Cuba. Water Res. (2005);39:3945–3953. doi: 10.1016/j.watres.2005.07.011. [DOI] [PubMed] [Google Scholar]
- 14.Sollitto D., Romic M., Castrignanò A., Romic D., Bakic H. Assessing heavy metal contamination in sediments of the Zagreb region (Northwest Croatia) using multivariate geostatistics. Catena. (2010);80:182–194. [Google Scholar]
- 15.Akabzaa T.M., Banoeng-Yakubo B.K., Seyire J.S. Impact of mining activities on water resources in the vicinity of the Obuasi mine. West Afr. J. Appl. Ecol. (2007);11:101–110. [Google Scholar]
- 16.Armah F.A., Odoi J.O., Afrifa E.K.A., Pappoe A.N.M., Yawson D.O., Essandoh P.K. Spatial variability of trace metals in surface and groundwater within a Contaminated Mining Environment in Ghana. Res. J. Environ. Earth Sci. (2011);3:546–554. [Google Scholar]
- 17.Kuma J.S., Younger P.L. Water quality trends in the Tarkwa gold-mining district, Ghana. Bull. Eng. Geol. Environ. (2004);63:119–132. [Google Scholar]
- 18.Yidana S.M., Ophori D., Banoeng-Yakubo B. A multivariate statistical analysis of surface water chemistry data-the Ankobra Basin, Ghana. J. Environ. Manage. (2008);86:80–87. doi: 10.1016/j.jenvman.2006.11.023. [DOI] [PubMed] [Google Scholar]
- 19.Armah F.A., Kuitunen M., Luginaah I., Mkandawire P. Non Occupational Health Risk Assessment from Exposure to Chemical Contaminants in the Gold Mining Environment of Tarkwa, Ghana. Trends Appl. Sci. Res. (2012);7:181–195. [Google Scholar]
- 20.Albering H.J., Rila J.P., Moonen E.J., Hoogewerff J.A., Kleinjans J.C. Human health risk assessment in relation to environmental pollution of two artificial freshwater lakes in The Netherlands. Environ. Health Perspect. (1999a);107:27–35. doi: 10.1289/ehp.9910727. [DOI] [PMC free article] [PubMed] [Google Scholar]
- 21.Albering H.J., van Leusen S.M., Moonen E.J., Hoogewerff J.A., Kleinjans J.C. Human health risk assessment: A case study involving heavy metal soil contamination after the flooding of the river Meuse during the winter of 1993-1994. Environ. Health Perspect. (1999b);107:37–43. doi: 10.1289/ehp.9910737. [DOI] [PMC free article] [PubMed] [Google Scholar]
- 22.Li C., Lu F.Y., Zhang Y., Liu T.W., Hou W. Spatial distribution characteristics of heavy metals in street dust in Shenyang city. Ecol. Environ. (2008);17:560–564. [Google Scholar]
- 23.Burton G.A. Jr. Sediment quality criteria in use around the world. Limnol. (2002);3:65–75. [Google Scholar]
- 24.Li F., Fan Z., Xiao P., Oh K., Ma X., Hou W. Contamination, chemical speciation and vertical distribution of heavy metals in soils of an old and large industrial zone in Northeast China. Environ. Geol. (2009);57:1815–1823. [Google Scholar]
- 25.Marchand C., Lallier-Vergès E., Baltzer F., Albèric P., Cossa D., Baillif P. Heavy metals distribution in mangrove sediments along the mobile coastline of French Guiana. Mar. Chem. (2006);98:1–17. [Google Scholar]
- 26.Abdel-Baki A.S., Dkhil M.A., Al-Quraishy S. Bioaccumulation of some heavy metals in tilapia fish relevant to their concentration in water and sediment of WadiHanifah, Saudi Arabia. Afr. J. Biotechnol. (2011);10:2541–2547. [Google Scholar]
- 27.Al-Khashman O.A., Shawabkeh R.A. Metals distribution in soils around the cement factory in southern Jordan. Environ. Pollut. (2006);140:387–394. doi: 10.1016/j.envpol.2005.08.023. [DOI] [PubMed] [Google Scholar]
- 28.Manta D.S., Angelone M., Bellanca A., Neri R., Sprovieri M. Heavy metals in urban soils: a case study from the city of Palermo (Sicily), Italy. Sci. Total Environ. (2002);300:229–243. doi: 10.1016/s0048-9697(02)00273-5. [DOI] [PubMed] [Google Scholar]
- 29.Yongming H., Peixuan D., Junji C., Posmentier E.S. Multivariate analysis of heavy metal contamination in urban dusts of Xi’an, Central China. Sci. Total Environ. (2006);355:176–186. doi: 10.1016/j.scitotenv.2005.02.026. [DOI] [PubMed] [Google Scholar]
- 30.Facchinelli A., Sacchi E., Mallen L. Multivariate statistical and GIS-based approach to identify heavy metal sources in soils. Environ. Pollut. (2001);114:313–324. doi: 10.1016/s0269-7491(00)00243-8. [DOI] [PubMed] [Google Scholar]
- 31.Lim H.S., Lee J.S., Chon H.T., Sager M. Heavy metal contamination and health risk assessment in the vicinity of abandoned Songcheon Au-Ag mine in Korea. J. Geochem. Explor. (2008);96:223–230. [Google Scholar]