Abstract
Mass spectrometry (MS) is a very powerful instrument that can be used to analyze a wide range of materials such as proteins, peptides, DNA, drugs, and polymers. The process typically involves either chemical or electron (impact) ionization of the analyte. The resulting charged species or fragment is subsequently identified by the detector. Usually, single mass uses source-induced dissociation (SID), whereas mass/mass uses collision-induced dissociation (CID) to analyze the chemical fragmentations Each technique has its own advantages and disadvantages. While CID is most effective for the analysis of pure substances, multiple- step MS is a powerful technique to get structural data. Analysis of veterinary drugs ampicillin, chloramphenicol, ciprofloxacin, and oxytetracycline serves to highlight the slight differences between SID and CID. For example, minor differences were observed between ciprofloxacin and oxytetracycline via SID or CID. However, distinct fragmentation patterns were observed for ampicllin depending on the analysis method. Both SID and CID showed similar fragmentation spectra but different signal intensities for chloramphenicol. There are several factors that can influence the fragmentation spectra, such as the collision energy, major precursor ion, electrospray mode (positive or negative), and sample homogeneity. Therefore, one must select a fragmentation method on an empirical and case-by-case basis.
Keywords: Mass spectrometry, Ampicillin, Chloramphenicol, Ciprofloxacin, Oxytetracycline
INTRODUCTION
A mass spectrometer (MS) is an instrument used to separate ions according to their mass-to-charge ratios. The MS equipment has come a long way since its discovery and has become an invaluable tool for the analysis of proteins, peptides, DNA, drugs, and polymers. A typical MS instrument comprises an ion source, a mass analyzer, and a detector. The ion source is responsible for sample ionization. The mass analyzer performs ion sorting and separates ions according to their mass and charge. Fragments are also generated in the ion-source section of some MS instruments. The separated ions are measured and finally displayed by the detector. Partial fragmentation can be obtained by carefully tuning the instrument source settings. In electrospray, fragmentation is usually obtained by boosting voltage in the medium-pressure part after the nebulization process (sample droplet formation) (1). Usually, in the single-stage MS equipment, fragmentation of in-source CID creates an intermediate pressure zone in the MS (2) and produces fragments of all ions present in the ion ray upon exiting the ion source. Typically, the samples must be homogeneous (pure substances) in order to obtain practical information from the in-source CID (3). Fragmentation data can be obtained simultaneously on unlimited compounds (2). However, the large amounts of data impurities can significantly complicate the analysis process. Various mass fragments are derived from the ions of the compounds; as a result, it is not possible to determine which fragment ions are derived from the analytical material in SID (3). Furthermore, the insource CID requires no-interference and no-ion suppression, which ultimately provides more reproducible fragmentations (4). Typically, fragmentation of the abundant ions is produced on the CID of the triple quadrupole mass spectrometer system (QQQ). In order to obtain detailed ion fragments from CID (5), a precursor ion must be selected prior to fragmentation and CID analysis. Thus, some information about the materials to be analyzed is required. The mass spectrum can then identify the ions derived from the analytical material, because all fragments of a defined analyte are known (3). Therefore, the multiple-step MS is a powerful technique to obtain structural data. However, it can carry out selected ion monitoring (SIM) of only a few product ions during the analysis target materials (6).
Both SID and CID fragmentation methods have some advantages and disadvantages. Ion fragmentation is highly dependent on the sample composition and properties. Accordingly, the choice of fragmentation method depends on the analysis conditions or situation. To demonstrate this, we conducted a study of four veterinary drugs using both SID and CID modes in an MS QTOF. The purpose of this investigation was to compare the differences between the fragmentation patterns of SID and CID mass spectra.
MATERIALS AND METHODS
Fragmentation patterns of four drugs - ampicillin (AMP), chloramphenicol (CAP), ciprofloxacin (CFX), and oxytetracycline (OTC) - were analyzed using an MS QTOF (Bruker Daltonics, Billerica, MA, USA) with a syringe infusion pump (KDScientific, Holliston, MA, USA). The syringe was purchased from the Hamilton Company (Nevada, USA). The HPLC-grade water and acetonitrile were purchased from Duksan Pure Chemicals (Gyeonggi-do, South Korea). The analytical drugs (AMP, CAP, CFX, and OTC) were purchased from Sigma-Aldrich (Missouri, USA) and Fluka Analytical (Buchs, Switzerland). Ionization was performed on AMP, CFX, and oxytetracycline in the positive mode and CAP in the negative mode. Details of the instrumental and operating conditions of QTOF are described in Table 1.
Table 1.
Instruments and operating conditions
| Instrument system | Operating conditions |
|---|---|
|
| |
| Rate of syringe infusion pump | 180 μl/ hr |
| Syringe volume/diameter | 500 μl/3.26 mm |
| Nebulizer flow | 0.4 bar |
| Dry gas flow/ Temp. | 4 L/min 180℃ |
| Transfer funnel 1/2 RF power | 150/180 Vpp |
| Hexapole RF power | 150 Vpp |
| Quadrupole ion Energy | 3 eV |
| Low mass | 50 m/z |
| Collision RF power | 135 Vpp |
| Transfer time | 65 μs |
| Pre puls storing | 8.0 μs |
| Source-induced dissociation energy range | 0~200 eV |
| Collision-induced dissociation energy range | 0~50 eV |
RESULTS AND DISCUSSION
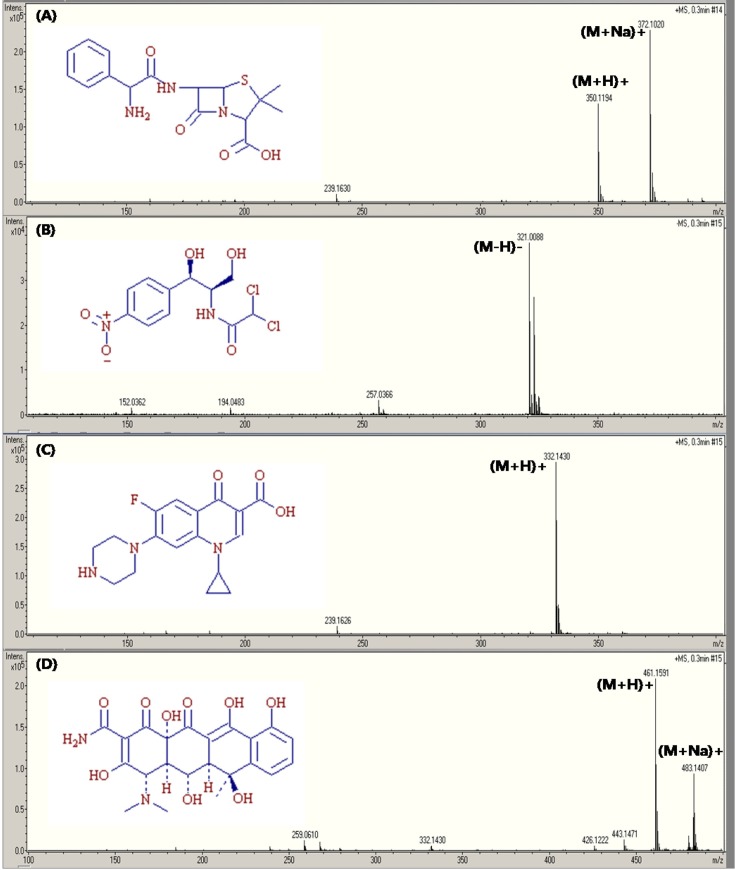
Fig. 1 shows the full scan mass spectra of AMP, CAP, CFX, and OTC acquired without SID and CID. The mass spectra of AMP and OTC included both the (M+H)+ and (M+Na)+ ions, while that of CAP and CFX showed the patterns of (M-H)− and (M+H)+, respectively.
Fig. 1. Full scan mass spectrum and molecular structure of (A) ampicillin, (B) chloramphenicol, (C) ciprofloxacin, and (D) oxytetracycline.
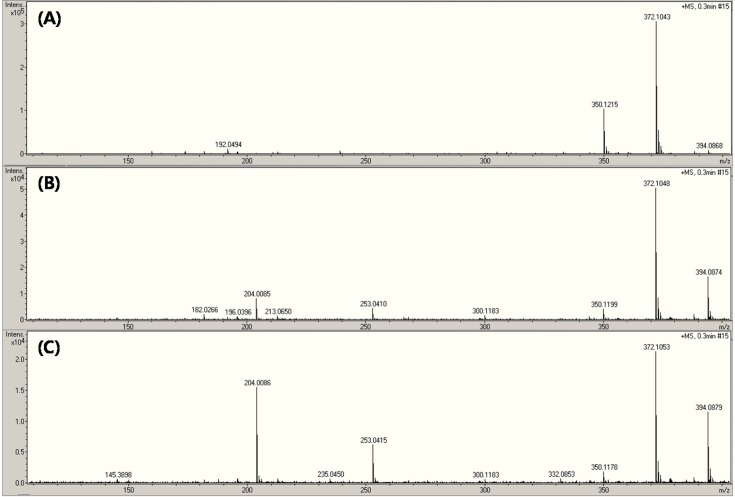
The main fragments observed for AMP were m/z 114, 160, 174, and 192 (7-9). Shown in Fig. 2 is the AMP mass spectrum based on the energy of SID at (A) 50 eV, (B) 120 eV, and (C) 200 eV. It produced several spectra from ions at m/z 350 and 372. No change in the mass spectrum of AMP was observed in spite of the applied energy of SID (50 eV). The spectrum contained two peaks (Fig. 1A and 2A), which appeared to be very similar. Therefore, 50 eV seems to be insufficient to fragment AMP. When the energy was increased to 120 and 200 eV of SID, predominant fragments at m/z 204 and 253 were revealed. The m/z 350 and 372 fragments can produce product ions, which did not correspond very well with the AMP fragment spectra reported in the literature (7-9). Product ions derived from all source entering ions can be observed in the SID mode.
Fig. 2. SID mass spectra of ampicillin depending on in-source energy level.
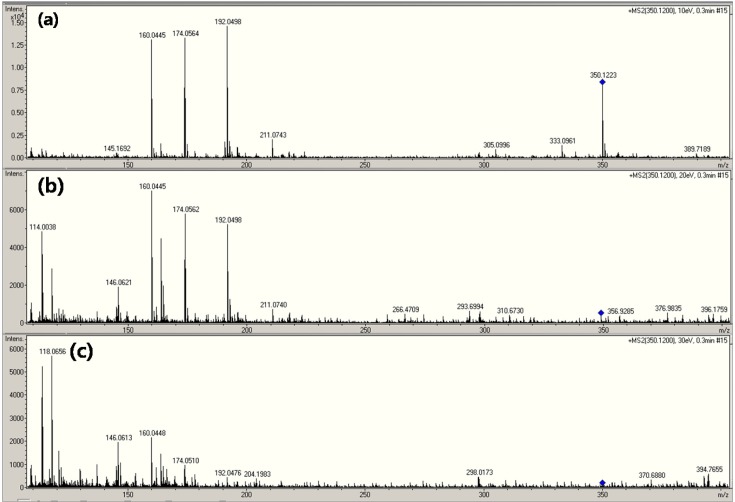
The full scan product ion spectrum from the chosen precursor ion (m/z 350) corresponding to each CID level of (a) 10 eV, (b) 20 eV, and (c) 30 eV are shown in Fig. 3. The fragmented forms of (M+H)+ at m/z 114, 160, 174, 192 can be assigned to AMP. The product ions observed at m/z 160, 174, 192, and so on were the fragments of the m/z 350 (precursor ion of AMP) (Fig. 3A, 3B and Fig. 3C). As mentioned earlier, the presence of more than two main parent ions significantly complicates the identification of the parent compound by SID. Quadrupole mass filters can separate the parent chemical from the matrix (3). In fact, all of the spectra shown in Fig. 3B, and 3C were formed by the same parent ion (m/z 350).
Fig. 3. CID mass spectra of ampicillin depending on MS collision energy level.
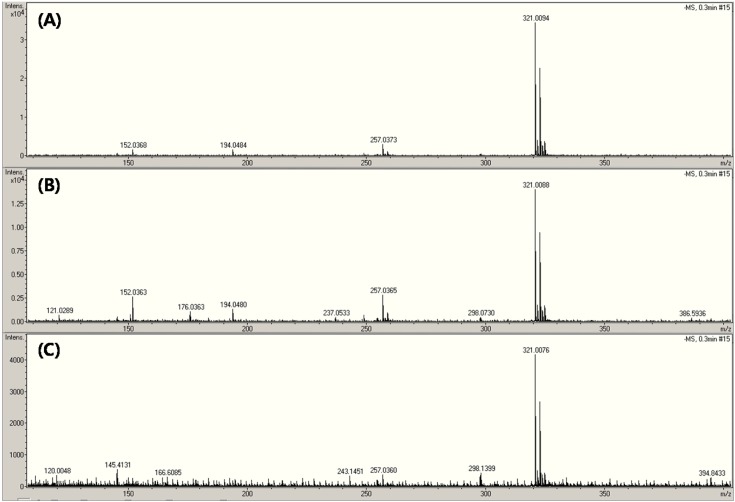
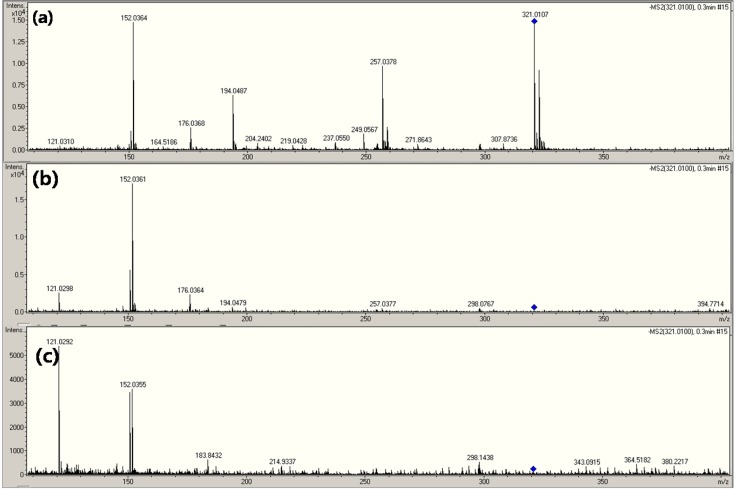
CAP was analyzed in the negative ionization mode (Fig. 4 and 5). The fragments observed at m/z 152, 176, 194, 257 were obtained from the (M-H)− at m/z 321 (10-12). The mass spectrum of CAP is displayed according to the energy of SID ((A) 10 eV, (B) 50 eV and (C) 100 eV) in Fig. 4. The three fragmentation patterns were similar, but had lower intensity (Fig. 4). Although small amounts of a drug could be detected using this method, it was found that all fragments corresponded to CAP when the SID energy levels were added to each other (Fig. 4). The product-ion spectrum from the selected ions at m/z 321 at each CID energy level of ((a) 7 eV, (b) 15 eV, and (c) 25 eV) is shown in Fig. 5. Generally, m/z 152 was used as the reference ion for the quantitative analysis of CAP (11,12). The product ions at m/z 152 are shown in Fig. 5. Indeed, the collision energy was sufficient to fabricate ions such as m/z 152, 176, 194, 257, as shown in Fig. 5A. Both the SID and CID methods were found to be suitable for the CAP analysis.
Fig. 4. SID mass spectra of chloramphenicol depending on in-source energy level.
Fig. 5. CID mass spectra of chloramphenicol depending on MS collision energy level.
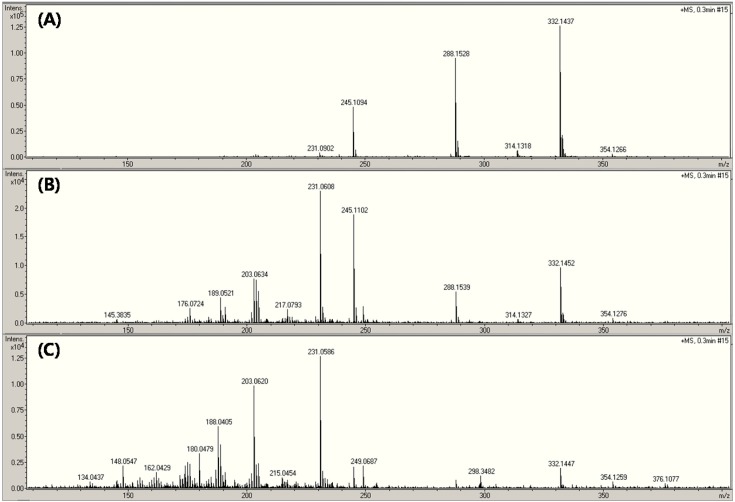
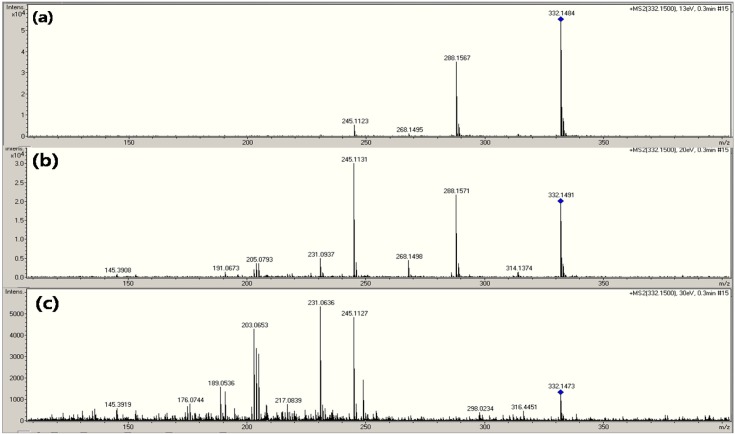
The main fragments of CFX were found at m/z 231, 245, 288, 314, and so on (13-15). Normally, the analysis of CFX utilizes the m/z 288 point for the calibration and quantification of ion at m/z 245 from the precursor ion (15). The CFX mass spectra are displayed according to the amount of SID energy ((A) 70 eV, (B) 100 eV, and (C) 130 eV) in Fig. 6. The product ions were observed at m/z 231, 245, 288, and 314 (Fig. 6). The product ions for identification and quantification appeared upon adding 70 eV energy for the SID in Fig. 6A. Therefore, it was possible to identify CFX using single MS with only SID energy. The product-ion spectrum from the chosen precursor ion (m/z 332) based on each CID energy level - (a) 13 eV, (b) 20 eV, and (c) 30 eV - is shown in Fig. 7. Although it was observed that there were differences between the intensity of each product ion, there was a high degree of similarity between the SID and CID for the CFX fragmentation pattern (Fig. 6 and 7). The SID and CID spectra were based on the fragmentation of the main precursor ion of (M+H)+ at m/z 332.
Fig. 6. SID mass spectrum of ciprofloxacin depending on in-source energy level.
Fig. 7. CID mass spectrum of ciprofloxacin depending on MS collision energy level.
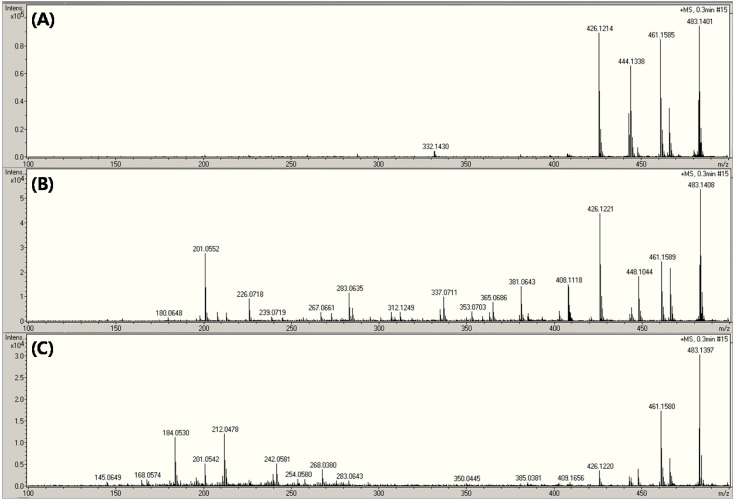
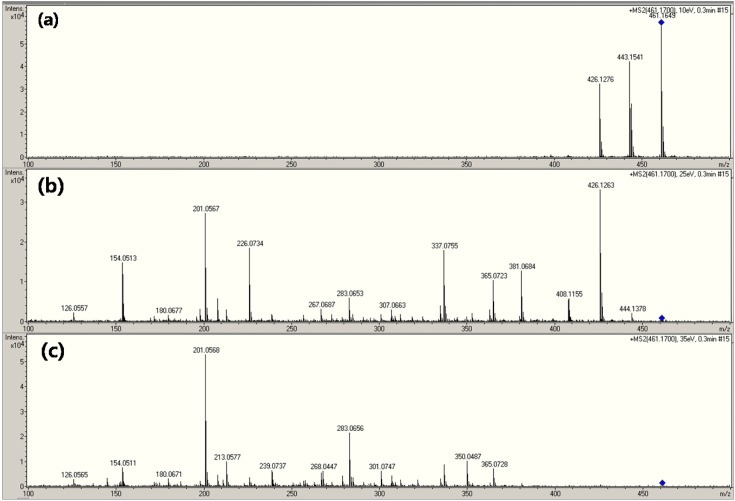
The major product ions of OTC were obtained at m/z 201, 337, 426, 443 (or 444) (16-19). The OTC mass spectrum is displayed according to the each of the following SID energies: (A) 60 eV, (B) 90 eV, and (C) 150 eV (Fig. 8). The ion of (M+Na)+ at m/z 483 was not affected by the high energy of SID. Interestingly, the intensity of the (M+H)+ peak decreased to a greater extent than that of (M+Na)+. Fig. 9 shows that product-ion spectrum from the selected precursor ion (OTC) at m/z 461 based on the CID energy levels of (a) 10 eV, (b) 25 eV, and (c) 35 eV. Note the many fragmentation peaks observed in this figure. They were only slight differences in the fragments obtained by SID and CID for OTC.
Fig. 8. SID mass spectrum of oxytetracycline depending on in-source energy level.
Fig. 9. CID mass spectrum of oxytetracycline depending on MS collision energy level.
Because the ratios of (M+H)+ to (M+Na)+ were different for AMP and OTC, their fragmentation patterns were also dissimilar to each other. Based on this result, we postulate that the primary precursor ion is different in the AMP and OTC analyses. As a result, the majority of the AMP precursor ions is in the (M+Na)+ form, whereas OTC primarily exists in the (M+H)+ form in the full scan mode. This may result in the distinct fragmentation patterns observed.
Little difference was observed between the fragmentation patterns of CFX and OTC in SID and CID. Thus, good fragmentation spectra can be obtained by single or MS/MS. However, this was not the case for AMP where the fragmentation patterns were determined by SID and CID. Therefore, one needs a MS/MS to assay compounds such as AMP. It is possible to obtain a different outcome using only single MS. The SID and CID methods produced similar fragmentation spectrum, but different signal intensities during the CAP analysis. However, CID has the advantage of being a simple analytical method compared to SID.
This study compared the MS spectrum of a series of drugs using both SID and CID methods. More diverse fragmentation data was obtained using the CID mode for all samples, whereas the data were not effectively controlled using SID. There are many possible reasons for the observed differences. Indeed, the fragmentation spectra were influenced by collision energy, major precursor ion, electrospray mode (positive or negative), and sample purity to name a few. MS/MS is certainly more efficient than single MS for fragmentation. Moreover, the analysis is a much more facile process when SID is used (e.g., only when single MS is required and no extra information about the analyte is needed). Both fragmentation methods have some advantages and disadvantages. Therefore, the fragmentation method should be selected depending on the condition or situation.
Acknowledgments
This research was supported by Basic Science Research Program through the National Research Foundation of Korea (NRF) funded by the Ministry of Education, Science and Technology (NRF-2011-0023938).
References
- 1.Gabelica V., De Pauw E. Internal energy and fragmentation of ions produced in electrospray sources. Mass Spectrom. Rev. (2005);24:566–587. doi: 10.1002/mas.20027. [DOI] [PubMed] [Google Scholar]
- 2.Abrankó L., García-Reyes J.F., Molina-Díaz A. In-source fragmentation and accurate mass analysis of multiclass flavonoid conjugates by electrospray ionization time-offlight mass spectrometry. J. Mass Spectrom. (2011);46:478–488. doi: 10.1002/jms.1914. [DOI] [PubMed] [Google Scholar]
- 3.Tiller P.R., Drexler D.M. Thermo Finnigan/MS Technical Report, A0895-776 Evaluating the Differences between Source CID or Real MS/MS. (1999):719.
- 4.Marquet P., Venisse N., Lacassie É., Lachâtre G. In-source CID mass spectral libraries for the “general unknown” screening of drugs and toxicants. Analusis. (2000);28:925–934. doi: 10.1051/analusis:2000280925. [DOI] [Google Scholar]
- 5.Abdelhameed A.S., Attwa M.W., Abdel-Aziz H.A., Kadi A.A. Induced in-source fragmentation pattern of certain novel (1Z,2E)-N-(aryl)propanehydrazonoyl chlorides by electrospray mass spectrometry (ESl-MS/MS). Chem. Cent. J. (2013);7:16. doi: 10.1186/1752-153X-7-16. [DOI] [PMC free article] [PubMed] [Google Scholar]
- 6.Korfmacher W.A. Principles and applications of LCMS in new drug discovery. Drug Discovery Today. (2005);10:1357–1367. doi: 10.1016/S1359-6446(05)03620-2. [DOI] [PubMed] [Google Scholar]
- 7.Okerman L., Croubels S., De Baere S., Van Hoof J., De Backer P., De Brabander H. Inhibition tests for detection and presumptive identification of tetracyclines, betalactam antibiotics and quinolones in poultry meat. Food Addit. Contam. (2001);18:385–393. doi: 10.1080/02652030120410. [DOI] [PubMed] [Google Scholar]
- 8.Wang J. Confirmatory determination of six penicillins in honey by liquid chromatography/electrospray ionizationtandem mass spectrometry. J. AOAC Int. (2004);87:45–55. [PubMed] [Google Scholar]
- 9.Ghidini S., Zanardi E., Varisco G., Chizzolini R. Prevalence of molecules of β-lactam antibiotics in bovine milk in lombardia and emilia romagna (Italy). Ann. Fac. Medic. Vet. di Parma. (2002);22:245–252. [Google Scholar]
- 10.Gantverg A., Shishani I., Hoffman M. Determination of chloramphenicol in animal tissues and urine: Liquid chromatography-tandem mass spectrometry versus gas chromatography-mass spectrometry. Anal. Chim. Acta. (2003);483:125–135. doi: 10.1016/S0003-2670(02)01566-0. [DOI] [Google Scholar]
- 11.Rupp H.S., Stuart J.S., Hurlbut J.A. Liquid chromatography/tandem mass spectrometry analysis of chloramphenicol in cooked crab meat. J. AOAC Int. (2005);88:1155–1159. [PubMed] [Google Scholar]
- 12.Pfenning A., Turnipseed S., Roybal J., Madson M., Lee R., Storey J. Confirmation of chloramphenicol residue in crab by electrospray LC/MS. U. S. FDA, Lab. Inf. Bull. (2003);19:4294. [Google Scholar]
- 13.U.S. Environmental Protection Agency. Method 1694: Pharmaceuticals and Personal Care Products in Water, Soil, Sediment, and Biosolids by HPLC/MS/MS. EPA; Washington: (2007). pp. 1–72. [Google Scholar]
- 14.Imre S., Dogaru G., Vlase L., Vari C.E., Dogaru M.T., Caldararu C. LC-MS Strategies in monitoring the response to different therapy. Farmacia. (2009);57:681–690. [Google Scholar]
- 15.Cinguina A.L., Roberti P., Giannetti L., Longo F., Draisci R., Fagiolo A., Brizioli N.R. Determination of enrofloxacin and its metabolite ciprofloxacin in goat milk by high-performance liquid chromatography with diode-array detection. Optimization and validation. J. Chromatogr. A. (2003);987:221–226. doi: 10.1016/S0021-9673(02)01800-9. [DOI] [PubMed] [Google Scholar]
- 16.Lykkeberg A.K., Halling-Sørensen B., Cornett C., Tiørnelund J., Honoré Hansen S. Quantitative analysis of oxytetracycline and its impurities by LC-MS-MS. J. Pharm. Biomed. Anal. (2004);34:325–332. doi: 10.1016/S0731-7085(03)00500-4. [DOI] [PubMed] [Google Scholar]
- 17.Schneider M.J., Mastovska K., Lehotay S.J., Lightfield A.R., Kinsella B., Shultz C.E. Comparison of screening methods for antibiotics in beef kidney juice and serum. Anal. Chim. Acta. (2009);637:290–297. doi: 10.1016/j.aca.2008.08.005. [DOI] [PubMed] [Google Scholar]
- 18.Bie M., Li R., Chai T., Dai S., Zhao H., Yang S., Qiu J. Simultaneous determination of tetracycline antibiotics in beehives by liquid chromatography--triple quadrupole mass spectrometry. Adv. Appl. Sci. Res. (2012);3:462–468. [Google Scholar]
- 19.Pikkemaat M.G., Rapallini M.L., Karp M.T., Elferink J.W. Application of a luminescent bacterial biosensor for the detection of tetracyclines in routine analysis of poultry muscle samples. Food Addit. Contam. Part A. (2010);27:1112–1117. doi: 10.1080/19440041003794866. [DOI] [PubMed] [Google Scholar]


