

Abstract
Mitochondrial dysfunction and synaptic damage are important features of Alzheimer's disease (AD) associated with amyloid β (Aβ) and tau. We reported previously that the scaffolding protein RanBP9, which is overall increased in brains of patients with AD and in mutant APP transgenic mice, simultaneously promotes Aβ generation and focal adhesion disruption by accelerating the endocytosis of APP and β1-integrin, respectively. Moreover, RanBP9 induces neurodegeneration in vitro and in vivo and mediates Aβ-induced neurotoxicity. Here we show in primary hippocampal neurons that RanBP9 potentiates Aβ-induced reactive oxygen species (ROS) overproduction, apoptosis, and calcium deregulation. Analyses of calcium-handling measures demonstrate that RanBP9 selectively delays the clearance of cytosolic Ca2+ mediated by the mitochondrial calcium uniporter through a process involving the translocation of cofilin into mitochondria and oxidative mechanisms. Further, RanBP9 retards the anterograde axonal transport of mitochondria in primary neurons and decreases synaptic mitochondrial activity in brain. These data indicate that RanBP9, cofilin, and Aβ mimic and potentiate each other to produce mitochondrial dysfunction, ROS overproduction, and calcium deregulation, which leads to neurodegenerative changes reminiscent of those seen in AD.—Roh. S.-E., Woo, J. A., Lakshmana, M. K., Uhlar, C., Ankala, V., Boggess, T., Liu, T., Hong, Y.-H., Mook-Jung, I., Kim, S. J., Kang, D. E. Mitochondrial dysfunction and calcium deregulation by the RanBP9-cofilin pathway.
Keywords: synapse, axonal transport, amyloid, MTT
the accumulations of amyloid β (Aβ) peptide and hyperphosphorylated tau are the major pathological hallmarks of Alzheimer's disease (AD). Mounting evidence clearly indicates that mitochondrial dysfunction and synaptic damage are important features of AD and related neurodegenerative disorders (1–3). Mitochondria serve as important reservoirs of Ca2+ and apoptotic proteins and produce reactive oxygen species (ROS), all of which have important implications in AD pathogenesis (1–3). Specifically, it has been shown that Aβ decreases mitochondrial membrane potential, increases respiration uncoupling, and enhances mitochondrial ROS (4). Furthermore, Aβ impairs mitochondrial motility and alters mitochondrial distribution in hippocampal neurons, resulting in synaptic degeneration (4). A recent study also demonstrated early deficits in synaptic mitochondria, Aβ accumulation within mitochondria prior to extracellular Aβ deposition, and impaired axonal transport of mitochondria in mutant APP transgenic (TG) mice (5). In neurons, Ca2+ homeostasis is critical to synaptic function and neuronal viability, and impairments in Ca2+ buffering capacity of organelles such as mitochondria and endoplasmic reticulum (ER) are tightly associated with neurodegenerative processes (6, 7).
We recently demonstrated that the scaffolding protein RanBP9 interacts with the cytoplasmic tails of low-density lipoprotein-related protein (LRP), amyloid precursor protein (APP), and β-site APP cleaving enzyme 1 (BACE1) and functions as a scaffold on which APP is brought together with BACE1 and LRP. Such interactions of RanBP9 promote the endocytosis of APP and strongly increase BACE1 cleavage of APP to generate Aβ both in vitro and in vivo (8–10). In addition, a 60-kD proteolytic fragment of RanBP9 is robustly increased in brains of patients with AD, and this fragment strongly potentiates Aβ generation via BACE1 processing of APP (11). Furthermore, we showed that RanBP9 not only accelerates the endocytosis of APP but also β1-integrin and LRP, resulting in strong inhibition of cell adhesion and focal adhesion complex assembly (12). RanBP9 protein levels are increased by 4-fold in mutant APP TG mice, and RanBP9 TG mice demonstrate significantly increased synapse loss, neurodegeneration, gliosis, and spatial memory deficits. RanBP9 overexpression promotes apoptosis and potentiates Aβ-induced neurotoxicity independent of its capacity to promote Aβ generation. Conversely, RanBP9 reduction by siRNA or gene dosage mitigates Aβ-induced neurotoxicity. Notably, RanBP9 activates and dephosphorylates cofilin, a key regulator of actin dynamics and mitochondria-mediated apoptosis, and siRNA knockdown of cofilin abolishes both Aβ- and RanBP9-induced apoptosis (13). In this study, utilizing primary neurons and various detection methods of mitochondrial dysfunction and Ca2+ regulation, we provide novel mechanistic insights to how RanBP9, cofilin, and Aβ cooperate to induce mitochondrial dysfunction and neurotoxicity, where oxidative damage and perturbed Ca2+ homeostasis contribute to neurodegeneration.
MATERIALS AND METHODS
Hippocampal primary neurons and cell culture
Dissociated hippocampal neurons were cultured as described previously with minor modifications (13). Briefly, isolated hippocampus from RanBP9 TG and non-TG littermate P0 pups were trypsinized for 15 min and dissociated with Neurobasal medium (Gibco, Gaithersburg, MD, USA) supplemented with DNase (20 μg/ml) and 10% FBS. Cells were centrifuged and plated in 500 μl of Neurobasal medium supplemented with B27 (Gibco) and Glutamax (Gibco) on poly-d-lysine (Sigma, St. Louis, MO, USA)-coated 12-mm coverslips in 24-well culture plates. Another 500 μl of medium including arabinofuranosyl cytidine (10 μM) was added, and 25% of medium was changed 2–3×/wk until cells were ready for experiments. Mouse hippocampal cell line HT22 was cultured and transfected as described previously (13).
Transfections and RNAi
Primary neurons were transfected with Lipofectamine 2000 (Invitrogen, Carlsbad, CA, USA) according to the manufacturer's description. Desired plasmid DNAs with or without siRNA and Lipofectamine were prepared in Opti-MEM (Gibco) and mixed for 20 min. After the collection of some fraction of preexisting medium, liposome solution was added. After 1 h, medium was removed and replenished with preexisting medium. After 2 d, cells were utilized for further assays. siRNA duplexes (19 nt) targeting cofilin, 5′-GGAGGACCUGGUGUUCAUC-3′ (13, 14), or scrambled control siRNAs were cotransfected at 50 nM final concentrations with 0.5 μg pTagRFP-C1 vector plasmid in 12-mm coverslips. HT22 cells were transfected with pLHCX or pLHCX-Flag-RanBP9 vectors.
Microscopic measurement of mitochondrial ROS, mitochondrial membrane potential (MMP), and cell death
To measure mitochondrial ROS, primary neuronal cells and HT22 cells were stained with 5 μM MitoSOX Red (Invitrogen) for 20 min in HBSS/Ca/Mg (Gibco). After washing with HBSS, cells were then analyzed with a fluorescence microscope. For quantification, cytoplasmic regions of 20–30 cells for each sample for every experiment were selected, and red mean intensities were measured. To determine mitochondrial membrane potential, cells were stained with 5 μg/ml JC-1 reagent (Stratagene, La Jolla, CA, USA) for 15 min and subjected to fluorescence microscopy. Quantitation was performed by selecting the cellular region of 20–30 cells for each sample and measuring the intensity of green and red signals. To further analyze MMP by another measure, cells were stained with tetramethylrhodamine ethylester (TMRM; 500 nM for primary neurons and 200 nM for HT22 cells) for 20 min in the dark; after washing, cells were analyzed by fluorescence microscopy. Quantification was performed in the same manner. For annexin V cell death assay, day in vitro (DIV) 7 neurons were treated with Aβ1–42 oligomers (15) for 24 h and stained with annexin V-FITC followed by DAPI (BD, San Diego, CA, USA). In all analyses, a Nikon Ti fluorescence microscope with a ×20 lens (Nikon, Tokyo, Japan) was used, and quantification was performed with Nikon NIS Element-AR software. Areas of measurements were randomly chosen with NIS Elements-AR autodetect enabled.
Fura-2 Ca2+ imaging
[Ca2+]c was measured by ratiometric analysis using acetoxy-methyl-ester Fura-2 (Fura-2/AM; Molecular Probes, Eugene, OR, USA) according to the manufacturer's instructions. Normal Tyrode (NT) solution (140 mM NaCl, 5 mM KCl, 2 mM CaCl2, 1 mM MgCl2, 10 mM glucose, and 10 mM HEPES, pH 7.35) was applied in the perfusion system during the entire imaging process. Cells on coverslips were incubated with 2 μM Fura-2 in NT supplemented with 0.01% pluronic acid for 30 min. Image processing was performed using an inverted microscope (Nikon Ti) with ×40 UV objective lens (Nikon). For Fura-2 excitation, sequential illuminations at 340 and 380 nm were delivered by the fast-switching dual excitation light source, Lambda DG-4 (Sutter Instrument Co., Novato, CA, USA), under the control of Axon Imaging Workbench (AIW) 6.0 software (Axon Instruments, Union City, CA, USA). Emission of Fura-2 was detected at an emission wavelength of 510 nm. Video images were acquired by an intensified CCD camera (LUCA; Andor, London, UK). Ratios of emission fluorescence following excitation at 340 and 380 nm were recorded and calculated by AIW. Further analysis and plotting were performed using Origen 8.0 software (OriginLab Corp., Northampton, MA, USA). For every recording, 5–10 cells of DIV10-14 were randomly chosen and analyzed, soma (∼70%) and dendrite regions (30%) being selected for analysis. Chemicals and regents used for Ca2+ imaging were the following: 100 mM KCl for 10 s to depolarize cells, 200 μM trolox (Calbiochem, San Diego, CA, USA) to neutralize ROS (2 h preincubation), 10 μM Ru360 (Calbiochem) to inhibit mitochondrial calcium uniporter (MCU; 30 min preincubation), 1 μM thapsigargin (Sigma) to block sarco/endoplasmic reticulum calcium-ATPase (SERCA), 3 mM Na3VO4, sodium orthovanadate (Sigma) to block plasma membrane calcium-ATPase (PMCA; 10 min preincubation), and 2 μM carbonylcyanide-p-(trifluoromethoxy)-phenylhydrazone (FCCP; Calbiochem) to release mitochondrial Ca2+.
Immunocytochemistry
Cells were fixed with 4% paraformaldehyde for 15 min at room temperature, permeabilized with 0.25% Triton X-100 for 30 min, and blocked with 1% BSA in PBST for 1 h. Desired primary antibodies were probed in 1% BSA in PBST for 1 h at room temperature, followed by incubation with secondary antibodies for 1 h at room temperature. After staining with Hoechst to visualize nuclei, cells were fixed again and subjected to laser scanning confocal microscopy (Olympus FV10i).
Western blotting, mitochondrial isolation, and Aβ oligomer treatments
Cultured cells were lysed with lysis buffer (50 mM Tris-Cl, 150 mM NaCl, 2 mM EDTA, and 1% TritonX-100). Protein quantification was performed by a colorimetric detection reagent (BCA Protein Assay; Pierce, Rockford, IL, USA). Equal amounts of protein lysates were subjected to sodium dodecyl sulfate–polyacrylamide gel electrophoresis and transferred to Immobilon-P membranes (Millipore Corp., Bedford, MA, USA). Blots were probed by anti-cofilin (Sigma) and phospho-cofilin antibodies (Cell Signaling, Danvers, MA, USA). The corresponding peroxidase-conjugated secondary antibody was detected by ECL Western blot reagents (Millipore). For isolation of mitochondria, mitochondrial isolation kit (Thermo Scientific, Waltham, MA, USA) was used according to the manufacturer's instructions for cultured cells. Synthetic Aβ1–42 was purchased from American Peptide Co. (Sunnyvale, CA, USA), and Aβ1–42 oligomers were prepared precisely according to a previously characterized protocol (15).
Time-lapse imaging of axonal transport of mitochondria
Axonal transport study was performed as described previously with minor modifications (5). DIV7–8 neurons were transfected with mito-dsRed plasmid, and DIV10–12 cells were used for the study. Protrusions thinner and 2 or 3 times longer than other protrusions were considered to be axons. Particles with strong labeling and clear edges confined in axons were considered to be mitochondria. If mitochondria remained stationary during the entire period of record, the particle was considered as stationary, whereas if the displacement was more than the length of the mitochondrion (∼1–2 μm), movement was counted. Images were taken every 3 s for a total of 2 min under ×1000 view (×100 TIRF lens) using a Nikon Eclipse Ti fluorescence microscope. CO2 and temperature were maintained at 5% and 37°C within the imaging chamber during the whole process. Axonal mitochondrial movement toward the distal end of an axon was considered to be anterograde, whereas that toward the proximal end was considered to be retrograde. Time-lapse images were analyzed with Nikon NIS Elements-AR software. Trolox was treated for 4 h prior to imaging.
FM4-64 staining for measurement of synaptic activity
To determine synaptic activity, DIV21 hippocampal neurons on coverslips were stained with FM4-64 (Invitrogen). Cells were washed with NT solution (2 mM Ca2+); depolarized with KCl (100 mM) for 0, 1, or 3 min; stained with 5 μg/ml FM4-64 for 1 min on ice; and then fixed with 4% paraformaldehyde. The coverslips mounted on slide glasses were analyzed using laser scanning confocal microscope (Olympus FV10i) using excitation/emission range for Texas-red. For quantifications, 20 synaptic puncta with red signal from 5 independent images for every sample were selected, and the intensities were measured and compared between non-TG and RanBP9 TG neurons using Nikon NIS Elements-AR software. To determine the effects of ROS on synaptic activity, 200 μM trolox (Calbiochem) was preincubated for 4 h. The reagents were also included in washing and staining solutions.
Isolation of synaptosomes and MTT assays
To isolate synaptosomes, mice [RanBP9 TG: 1 male, 2 females; wild-type (WT) littermates: 1 male, 2 females] were euthanized under isoflurane anesthesia, and frontal cortices were weighed and dounced in a grinder using Syn-PER synaptic protein extraction reagent (cat no. 87793; Thermo Scientific) as described previously (16). Immediately before use, protease inhibitor mixture for mammalian cells from Sigma (P8340) was added to the Syn-PER reagent. Homogenates were centrifuged at 2000 g for 10 min to remove cell debris. The resulting supernatant was centrifuged at 15,000 g for 20 min. The supernatant formed the cytosolic fraction, and the synaptosome pellet was gently resuspended in Syn-PER synaptic protein extraction reagent. The amounts of total proteins in the homogenate, cytosolic fraction, and synaptosomes were measured by the BCA method and compared. The quality of synaptosome preparation was verified by immunoblotting for 2 cytosolic proteins (TGFβ and stathmin), 2 nuclear proteins (PCNA and HDAC2), and 2 synaptic proteins (synaptophysin and PSD-95). To measure mitochondrial activity as an index of the functional status of the synaptosomes, we used the calorimetric 3-(4,5-dimethylthiazol-2-yl)-2,5-diphenyltetrazolium bromide (MTT) metabolic activity assay using a cell growth determination kit (CGD-1; Sigma), and carried out according to the manufacturer's instructions (16). Briefly, 50 μl of the synaptosome preparation equivalent to 2.0 mg of total protein was added to 500 μl of MTT solution (stock, 5 mg/ml in PBS; working concentration was prepared by 10-fold dilution). Following 3 h incubation at 37°C, the resulting formazan crystals were dissolved in 100 μl of dimethyl sulfoxide (DMSO); the absorbance was read at 570 nm using the Smart Spec Plus spectrophotometer (Bio-Rad, Hercules, CA, USA), and the background absorbance at 690 nm was subtracted. To assess synaptosomal functional integrity, ATP stimulations were carried out by the addition of ATP to a final concentration of 10 μM to synaptosome preparations.
Statistical analysis
All experiments were independently performed ≥3 times, and hypotheses were tested with Student's t test for 2-group comparisons. In case of multiple comparisons where indicated, ANOVA followed by Bonferroni post hoc test was performed. All statistical analyses were carried out by OriginPro 8, GraphPad Prism (GraphPad, San Diego, CA, USA), or GraphPad Instat3.
RESULTS
RanBP9 TG neurons exhibit increased mitochondrial ROS and reduced mitochondrial membrane potential
As mitochondrial oxidative stress and MMP are general indicators of mitochondrial health, we utilized MitoSox Red, an indicator of mitochondrial superoxides, and JC-1 and TMRM, indicators of MMP, to stain hippocampal neurons derived from newborn (P0) pups of RanBP9 TG mice and non-TG littermates. Notably, the fluorescence intensity of MitoSox Red was significantly higher in RanBP9 TG neurons compared to non-TG littermates at both DIV4 and DIV12 (Fig. 1A, B), indicating that such perturbation occurs early in neuronal maturation and persists. A consistent feature of the early stages of apoptosis is the disruption of active mitochondria and drop in MMP. As the JC-1 dye exhibits potential-dependent accumulation in mitochondria and fluorescence shift from green (529 nm) to red (590 nm), mitochondrial depolarization is indicated by a decrease in red/green fluorescence intensity ratio. Under normal primary culture conditions at both DIV4 and DIV12, the JC-1 red/green intensity ratio was significantly lower in RanBP9-TG neurons, indicating a sharp drop in mitochondrial membrane potential (Fig. 1C, D). Likewise, TMRM intensity, another indicator of MMP, was also significantly reduced in RanBP9 TG neurons (Fig. 1E, F).
Figure 1.
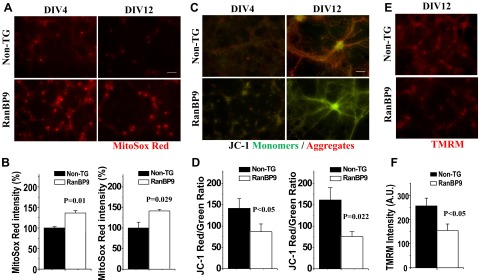
Increased mitochondrial ROS and decreased mitochondrial membrane potential in RanBP9 TG hippocampal neurons. A) Representative images of MitoSox Red staining from DIV4 and DIV12 non-TG and RanBP9 TG littermate neurons. B) Quantification of MitoSox Red images from DIV4 and DIV12 non-TG and RanBP9 TG hippocampal neurons. Values represent mean ± sem relative fluorescence intensity (DIV4: t=4.27, P=0.01, n=3 each; DIV12: t=3.32, P=0.029, n=3 each). C, D) JC-1 staining images (C) and quantification (D) from DIV4 and DIV12 hippocampal neurons. Values represent mean ± sem ratio of red/green fluorescence intensity (DIV4: t=3.11, P<0.05, n=3 each; DIV12: t=6.59, P=0.022, n=3 each). E, F) TMRM staining images (E) and quantification (F) of DIV12 hippocampal neurons. Values represent mean mean ± sem intensity (t=3.40, P<0.05, n=3 each, 257 cells for non-TG and 142 cells for RanBP9 in total were analyzed).
RanBP9 exacerbates Aβ-induced mitochondrial dysfunction and neurodegeneration in hippocampal primary neurons
Previous studies have described the role of Aβ as a strong inducer of apoptosis, mitochondrial dysfunction, and perturbation of calcium homeostasis. In addition, it has been shown that Aβ promotes ROS generation from mitochondria by interacting with Aβ-binding alcohol dehydrogenase (ABAD), causing accumulation of harmful intermediate metabolites (17). Aβ oligomers were prepared precisely according to a previously characterized protocol (15). To determine how RanBP9 affects such abnormalities evoked by Aβ peptide, primary neurons derived from RanBP9 TG and non-TG mice were stained with MitoSOX Red, JC-1, annexin V, and Fura-2 dye with or without treatment of 1 μM Aβ1–42 oligomers for 24 h. As expected, Aβ promoted mitochondrial superoxide production (MitoSOX Red) in both non-TG and RanBP9 TG neurons. However, superoxide levels were already significantly higher in RanBP9 TG vs. non-TG neurons, and were significantly further enhanced by Aβ treatment (Fig. 2A). Under identical conditions, JC-1 staining demonstrated a modest nonsignificant trend for lower MMP after Aβ treatment in both non-TG and RanBP9 TG neurons. However, RanBP9 neurons demonstrated consistently lower MMP even without Aβ treatment (Fig. 2B), indicating that mitochondria in these neurons are already compromised by RanBP9. Consistent with previous observations (18, 19), ratiometric analysis of steady-state cytosolic Ca2+ concentration([Ca2+]c) with Fura-2/AM revealed a significant increase in free cytosolic calcium after Aβ treatment (Fig. 2C). While there was no effect of RanBP9 alone on steady-state [Ca2+]c levels, treatment of Aβ in RanBP9 TG neurons potentiated [Ca2+]c levels significantly beyond that seen in non-TG neurons (Fig. 2C), indicating that RanBP9 TG neurons are hypersensitive to Ca2+ deregulation induced by Aβ. To investigate whether RanBP9 TG neurons under these conditions are more vulnerable to degeneration, annexin V-FITC (green) and DAPI staining (blue) were performed. Indeed, RanBP9 TG neurons demonstrated significantly increased percentage of annexin V-positive apoptotic cells compared to non-TG controls after Aβ treatment (Fig. 2D). Taken together, these results indicate that RanBP9 persistently impairs mitochondrial health and renders neurons more susceptible to Aβ-induced calcium deregulation and neurotoxicity.
Figure 2.

RanBP9 potentiates Aβ-induced mitochondrial dysfunction, apoptosis, and calcium deregulation. A) Representative images and quantifying graphs of DIV10–12 non-TG and RanBP9 TG neurons stained with MitoSOX Red after incubating with DMSO (vehicle) or Aβ1–42 (1 μM) for 24 h (ANOVA, F=15.35, df=15, P=0.00020, Bonferroni post hoc test). Scale bar = 50 μm. Values represent means ± sem. *P < 0.05, **P < 0.01. B) Representative images and quantifying graphs of DIV10–12 non-TG and RanBP9 TG neurons stained with JC-1 after incubating with DMSO (vehicle) or Aβ1–42 (1 μM) for 24 h (ANOVA, F=19.34, df=11, P=0.0005, Bonferroni post hoc test). Scale bar = 50 μm. Values represent means ± sem. **P < 0.01. C) Representative images of DIV10–12 non-TG and RanBP9 TG neurons loaded with Fura-2/AM after treating with vehicle or Aβ1–42 (1 μM) for 24 h. 241(Non-TG, Vehicle-treated), 147 (RanBP9, vehicle-treated), 153 (non-TG, Aβ-treated), and 209 (RanBP9, Aβ-treated) cells were analyzed in total (ANOVA, F=24.08, df=11, P=0.0002, Bonferroni post hoc test). Values represent mean ± sem Fura-2 ratio. *P < 0.05. D) Representative images of annexin V-FITC-stained (top panels) and DAPI-stained (merged with annexin V; bottom panels) DIV7 neurons (non-TG and RanBP9) after treatment with Aβ1–42 (1 μM) for 24 h. Graph shows quantitation of the percentage of annexin V-positive apoptotic neurons among total DAPI positive neurons. Values represent means ± sem (t=4.28, n=5/group). **P < 0.01.
RanBP9 TG hippocampal neurons display delayed clearance of depolarization-evoked Ca2+ transients
To investigate further how RanBP9 might render neurons hypersensitive to Aβ-induced Ca2+ deregulation, we next studied neuronal handling of Ca2+ transients rapidly evoked by potassium chloride (KCl). To this end, we performed live cell Fura-2 Ca2+ imaging with NT solution in a perfusion chamber by reversible addition of 100 mM KCl for 10 s to depolarize hippocampal neurons, followed by a washout period. The baseline, peak, and amplitude of Fura-2 340/380 ratio in response to KCl depolarization were not significantly different between RanGP9 TG and non-TG neurons in 5 independent batches of primary culture experiments (Fig. 3A). However, after initial depolarization with KCl, the decay of intracellular Ca2+ was noticeably delayed in RanBP9 TG neurons, such that [Ca2+]c level of RanBP9 TG neurons dropped to baseline 100 to 200 s later than that of non-TG neurons (Fig. 3B, C). When normalized by the peak ratio of Fura-2 ratio, the Ca2+ decay was significantly slower in RanBP9 TG neurons (Fig. 3D). Similar delay in Ca2+ decay was observed when Ca2+ transients were induced by carbachol, a ligand to acetylcholine receptors, indicating that such a disruption in Ca2+ clearance is simulated under physiologically relevant conditions (Fig. 3E).
Figure 3.
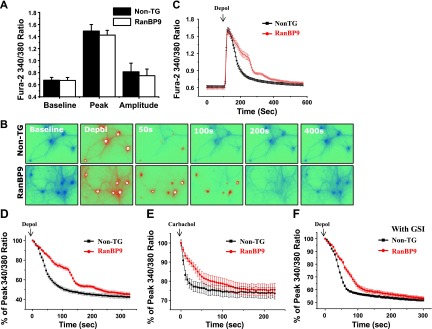
Ca2+ imaging with Fura-2/AM demonstrates delayed calcium clearance kinetics in RanBP9 TG hippocampal neurons. After 100 s of baseline recording, cells were depolarized (depol) with 100 mM potassium chloride (KCl) for 10 s. A) Baseline, peak, and amplitude of calcium transients from non-TG and RanBP9 TG neurons (n=5/group). B) Representative time course images at baseline and 50, 100, 200, and 400 s after depolarization. C) Representative plot of the Fura-2 ratio from non-TG and RanBP9 neurons. Values represent means ± sem. D) Representative Ca2+ decay curve normalized to peak ratio after depolarization. Plot represents means ± sem. E) Representative Ca2+ decay curve obtained from Ca2+ imaging in response to 100 μM carbachol stimulation. Plot represents means ± sem. F) Representative decay curve of Fura-2 Ca2+ imaging in vehicle-treated and γ-secretase inhibitor (GSI; 1 μM, overnight)-treated cells compared between non-TG and RanBP9 TG neurons. Values represent means ± sem. Data are representative from ≥3 independent experiments.
Because RanBP9 increases Aβ generation (8), we next determined whether the increase in endogenous Aβ by RanBP9 might be responsible for RanBP9-induced delay of Ca2+ clearance. Primary neurons were pretreated with the γ-secretase inhibitor (GSI) DAPT for 24 h and performed Fura-2 Ca2+ imaging. We found that RanBP9 neurons still showed sustained Ca2+ increase in the presence of GSI (Fig. 3F). Collectively, these data indicate that RanBP9 induces the delay in Ca2+ clearance after depolarization-evoked Ca2+ transient, independently of its ability to promote Aβ generation. Furthermore, these results also suggest that the hypersensitivity of RanBP9 TG neurons to Aβ-induced increase in steady-state [Ca2+]c is possibly due to defective removal of Ca2+ on induction of excess of [Ca2+]c by Aβ.
Mitochondrial Ca2+ buffering is specifically impaired in RanBP9 TG neurons
Having observed a delay in Ca2+ decay, we next assessed which Ca2+ clearance pathways might be impaired in RanBP9 TG neurons. Several major Ca2+ clearance mechanisms exist. On increases in intracellular Ca2+, PMCA actively transports Ca2+ out of the cell across plasma membrane, SERCA uptakes Ca2+ into the ER, and the MCU transports Ca2+ into the mitochondria (20). Since increased mitochondrial ROS and loss of MMP were detected in RanBP9 TG neurons, we first tested whether the MCU might be involved in the delay in Ca2+ clearance by applying the MCU blocker, Ru360 (10 μM). As expected, Ca2+ clearance was delayed in RanBP9 TG neurons (Fig. 4A1) in the absence of Ru360. In the presence of Ru360, the difference between RanBP9 TG and non-TG neurons in Ca2+ clearance became minimal (Fig. 4A2). Closer examination demonstrated that Ru360 markedly delayed Ca2+ clearance in non-TG neurons but had little to no effect in RanBP9 TG neurons (Supplemental Fig. S1A, B), which indicated that the MCU-mediated Ca2+ clearance was already impaired in RanBP9 TG neurons prior to treatment with Ru360.
Figure 4.
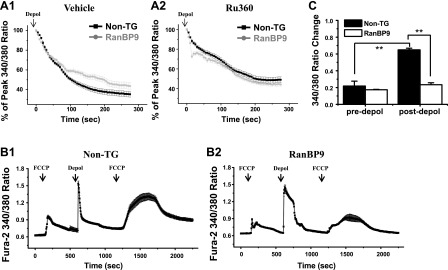
Ca2+ buffering by the MCU is impaired in RanBP9 TG neurons. A1, A2) Representative Ca2+ decay curves of vehicle-treated (A1) and Ru360-treated (A2) neurons compared between non-TG and RanBP9 TG neurons. Depol, depolarized. Plots represent means ± sem. B1, B2) Fura-2 Ca2+ imaging with FCCP in non-TG (B1) and RanBP9 TG (B2) hippocampal primary neurons. Fura-2 ratio from non-TG and RanBP9 TG littermate is presented as means ± sem. At indicated arrows, neurons were treated with 1 μM FCCP for 100 s or 100 mM KCl (depol), for 10 s. C) Quantitation of Fura-2 ratio changes evoked by FCCP before and after depolarization. Values represent means ± sem (ANOVA, F=45.63, df=51, P<0.00001, Bonferroni post hoc test). **P < 0.01.
Next, we asked whether mitochondrial Ca2+ buffering capacity is impaired in RanBP9 TG neurons. To demonstrate this, we used a mitochondrial proton gradient uncoupler, FCCP, which is known to release mitochondrial free Ca2+ ([Ca2+]m) and enables measurement of mitochondrial Ca2+ content (7, 21). The amount of [Ca2+]m was analyzed by measuring the FCCP-evoked increase in Fura-2 ratio in non-TG and RanBP9 TG neurons before and after depolarization. In non-TG neurons, more [Ca2+]m was released after than before depolarization as determined by Fura-2 340/380 ratio changes, indicating a large amount of mitochondrial Ca2+ uptake after depolarization (Fig. 4B1, C). However, the release of [Ca2+]m after depolarization in RanBP9 TG neurons was severely reduced compared to that of non-TG neurons (Fig. 4B2, C), further indicating defects in mitochondrial Ca2+ uptake in RanBP9 TG neurons when excess Ca2+ is present. Further examination of other routes of Ca2+ clearance via the plasma membrane (PMCA) and endoplasmic reticulum (SERCA) pathways were clearly not affected by RanBP9 (Supplemental Fig. S2), indicating that the hypersensitivity of RanBP9 TG neurons to Aβ-induced increase in steady-state [Ca2+]c is largely due to defective removal of Ca2+ by MCU-dependent mitochondrial pathway on induction of excess of [Ca2+]c by Aβ.
Antioxidant trolox reduces mitochondrial ROS, restores MMP, and corrects Ca2+ clearance defects in RanBP9 TG neurons
ROS at low to moderate levels serve as important mediators for cellular signaling events and synaptic function. However, when overproduced beyond the intracellular antioxidant buffering capacity, they cause cellular and mitochondrial damage, as well as Ca2+ dysregulation (22). Given the overproduction of mitochondrial ROS in RanBP9 TG neurons and the impairment of MCU, we hypothesized that ROS may play a central role in this dysregulation. Indeed, it has recently been shown that Ca2+ deregulation induced by Aβ can be corrected by antioxidant treatment (23). To test this possibility, we used a water-soluble vitamin E analog, trolox, which is well known to protect cells from oxidative stress by its intracellular ROS scavenging activity (24–26). First, we asked whether trolox removes ROS and restores MMP effectively in our system. While a 2-h treatment of trolox had little effect on mitochondrial superoxide levels in non-TG neurons, it was significantly reduced in RanBP9 TG neurons to the level seen in non-TG neurons (Fig. 5A). Surprisingly, the same treatment of trolox effectively restored MMP in RanBP9 TG neurons nearly to the level of non-TG neurons (Fig. 5B). When trolox was applied for 2 h prior to and during Fura-2/AM imaging, the Ca2+ clearance rate after depolarization was clearly corrected in RanBP9 TG neurons to a rate similar to that seen in non-TG neurons, while such treatment had little to no effect in non-TG neurons (Fig. 5C1, C2; Supplemental Fig. S1B1, B2). These data clearly indicate that the loss of MMP and delayed Ca2+ clearance kinetics in RanBP9 TG neurons are due to the overproduction of ROS that can be largely reversed by antioxidant mechanisms, similar with that seen with Aβ (23).
Figure 5.
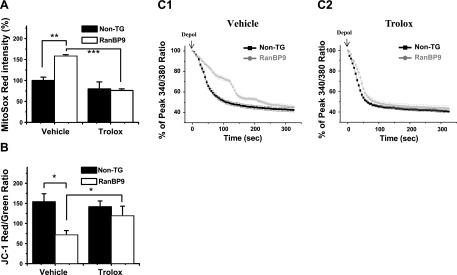
Antioxidant trolox corrects mitochondrial ROS, MMP, and Ca2+ clearance in RanBP9 TG hippocampal neurons. A) Relative MitoSox Red intensity in non-TG and RanBP9 TG neurons between vehicle- and trolox (200 μM for 2 h)-treated cells (ANOVA, F=65.67, df=8, P=0.00019, Bonferroni post hoc test). Values represent means ± sem. **P < 0.01, ***P < 0.001. B) Relative JC-1 ratios of red/green intensity in non-TG and RanBP9 TG neurons between vehicle- and trolox (200 μM for 2 h)-treated cells. Values represent mean ± sem ratio of red/green fluorescence intensity (ANOVA, F=7.358, df=11, P=0.011, Bonferroni post hoc test). *P < 0.05. C1, C2) Representative decay curves of Fura-2 Ca2+ imaging in vehicle-treated (C1) and trolox (200 μM for 2 h)-treated (C2) cells compared between non-TG and RanBP9 TG neurons from ≥3 independent experiments.
Cofilin and its translocation into mitochondria mediate Ca2+ deregulation and mitochondrial dysfunction induced by Aβ and RanBP9
Actin-depolymerizing factor (ADF)/cofilin is known to regulate actin filament assembly and disassembly (27). Recent reports have also demonstrated that cofilin, when dephosphorylated and oxidized in response to apoptotic insults, translocates into mitochondria, inducing mitochondrial swelling, cytochrome c release, and increased susceptibility to apoptosis (28–30). Recent studies also demonstrated that cofilin overexpression induces cofilin/actin rod formation and decline of MMP due to its translocation into mitochondria (31, 32) and that Aβ promotes cofilin/actin rod formation via a mechanism involving the dephosphorylation of cofilin (33). Since we reported that RanBP9 induces overexpression and dephosphorylation of cofilin and that the RanBP9-cofilin pathway mediates Aβ- and RanBP9-induced apoptosis (13), we hypothesized that increased activation and translocation of cofilin into mitochondria may play a central role in RanBP9-induced impairment in mitochondrial Ca2+ buffering. To test this hypothesis, we first asked whether RanBP9 alters the translocation of cofilin into mitochondria in HT22 cells, a mouse hippocampal cell line. Indeed, higher levels of cofilin were detected in biochemically isolated mitochondria from RanBP9-transfected HT22 cells compared to controls (Fig. 6A). Surprisingly, RanBP9 was also detected in the isolated mitochondrial fraction together with the mitochondrial marker cytochrome oxidase V (COX V; Fig. 6A). Trolox treatment potently reduced the levels of both cofilin and RanBP9 in mitochondria (Fig. 6A). As expected, phosphorylated cofilin was completely absent in mitochondria (Fig. 6A). To further investigate the role of cofilin in Aβ-induced mitochondrial dysfunction, mitochondrial superoxide levels were measured in HT22 cells transfected with control siRNA or cofilin si-RNA. Aβ1–42 oligomer treatment in HT22 cells dramatically increased MitoSox-Red staining of mitochondrial superoxides, and cofilin siRNA fully reversed mitochondrial superoxide production induced by Aβ1–42 (Fig. 6B). These results indicate RanBP9 induces the translocation of cofilin into mitochondria and that Aβ-induced mitochondrial superoxide overproduction is dependent on cofilin.
Figure 6.

Requirement for mitochondrial cofilin for RanBP9-induced calcium deregulation and Aβ-induced mitochondrial superoxide overproduction. A) HT22 cells were transiently transfected with Flag-RanBP9 for 24 h and further treated with vehicle or trolox (200 μM); mitochondrial and cytosol fractions were isolated; and both fractions were subjected to immunoblotting for RanBP9, cofilin, phospho-cofilin (p-cofilin), cytochrome c oxidase V (COX V; in mitochondria fraction), and β-actin (in cytosol fraction). Note that RanBP9 overexpression potently increases both RanBP9 and cofilin in mitochondria, whereas trolox inhibits mitochondrial translocation of both proteins. p-Cofilin is undetectable in mitochondria. B) HT22 cells were transfected with control siRNA (si-Con) or cofilin siRNA (si-Cof) for 48 h, treated with vehicle (V) or Aβ1–42 (Aβ) for 4 h, and subjected to live cell staining with MitoSox-Red (mitochondrial superoxide) dye for 20 min, followed by imaging and quantitation. Representative images are shown. Note that Aβ dramatically increases MitoSox-Red staining, and cofilin siRNA nearly completely reverses the effects of Aβ (ANOVA, F=118.9, df=14, P<0.0001, Bonferroni post hoc test). ***P < 0.001. C, D) Representative images (C) and quantitation (D) of relative cofilin intensity in DIV8–10 hippocampal primary neurons cotransfected with pTag-RFP and scrambled (si-scr) or cofilin si-RNA (si-cof). Note that RanBP9 TG neurons show significantly increased cofilin levels, and cofilin siRNA reduces endogenous cofilin levels to similar levels in both non-TG and RanBP9-TG neurons. At least 16 cells of each genotype per experiment were quantified from each experiment (ANOVA, F=74.41, df=7, P=0.00057, Bonferroni post hoc test: P=0.044, non-TG si-scr vs. non-TG si-cof; P=0.006, non-TG si-scr vs. RanBP9 si-scr; P=0.001, RanBP9 si-scr vs. RanBP9 si-cof). Graph represents means ± sem. **P < 0.01. E1, E2) Decay curve of Fura-2 Ca2+ imaging with si-scr–transfected (E1) and si-cof-transfected (E2) cells compared between non-TG and RanBP9 TG neurons. Data are representative from ≥3 independent experiments and 5–6 cells/experiment.
Next, we stained for cofilin in non-TG and RanBP9 TG neurons. As expected, the cofilin signal was overall stronger in RanBP9 TG neurons (Fig. 6C, D) as we reported previously (13). To knock down cofilin in primary neurons, cofilin or scrambled siRNA duplexes were cotransfected with pTagRFP vector. Cofilin siRNA-transfected neurons displaying RFP signal showed reduced levels of endogenous cofilin compared with scrambled siRNA-transfected neurons displaying RFP signal after 48 h (Fig. 6C). Therefore, the RFP-transfected neurons were chosen for Fura-2 Ca2+ imaging, which serves as a marker of siRNA-transfected cells and simultaneously avoids spectral overlap with Fura-2 (34). When cofilin was knocked down, non-TG and RanBP9 TG neurons displayed similar rates of Ca2+ clearance (Fig. 6E1, E2). Although cofilin siRNA accelerated Ca2+ clearance in both non-TG and RanBP9 TG neurons, the effect on RanBP9 TG neurons was clearly more pronounced (Supplemental Fig. S1C1, C2). These results taken together indicate that activation and translocation of cofilin into mitochondria, at least in part, underlie RanBP9-induced mitochondrial dysfunction and Ca2+ buffering defect.
Reduced axonal transport of mitochondria and synaptic impairment in RanBP9 TG primary neurons and brain
We next investigated the functional consequences of RanBP9-related mitochondrial dysfunction in primary neurons and brain. We first measured the length of mitochondria in axons after transfecting hippocampal primary neurons with the Mito-dsRed construct. Indeed, the length of mitochondria along axons was significantly decreased in RanBP9 TG neurons compared to non-TG littermate neurons (Fig. 7A), consistent with our findings in the HT22 hippocampal cell line (35). We next performed live imaging of mitochondrial motility in Mito-dsRed-transfected hippocampal primary neurons. Previous studies have reported that mitochondria in axons exhibit both anterograde and retrograde transport but <50% of mitochondria are mobile (36). Therefore, we analyzed the percentages of stationary/movable and anterograde/retrograde mitochondrial transport over a 2-min period. As shown in kymographs of mitochondrial movement and quantifications, RanBP9 TG neurons exhibited significantly increased numbers of stationary mitochondria and significantly decreased number of total movable and anterotradely transported mitochondria (Fig. 7B, C). These results are consistent with previous observations that mitochondria with high membrane potential generally are anterogradely transported, while those with low membrane potential are not efficiently transported (36). Thus, we hypothesized that trolox treatment may restore the rate of movable and anterograde transport of mitochondria by recovering MMP. Prior trolox treatment for 4 h significantly corrected the rate of movable and anterograde mitochondrial transport in RanBP9 TG neurons to levels seen in non-TG neurons (Fig. 7B, C).
Figure 7.

Reduced axonal transport of mitochondria and synaptic/mitochondrial activity in RanBP9 TG neurons and brain. A) Representative images and length measurements of axonal mitochondria from DIV10–12 non-TG and RanBP9 TG hippocampal primary neurons. *P < 005. B) Representative kymographs of mitochondrial axonal transport for 2 min in non-TG (NTG) and RanBP9 TG (Ran) neurons treated with vehicle or trolox. Movements toward left and right indicate anterograde and retrograde transport, respectively. C) Quantification of percentages of stationary, movable, anterograde, and retrograde transport in non-TG vs. RanBP9 neurons with vehicle or trolox treatment (stationary: ANOVA, F=26.23, df=7, P=0.004; movable: ANOVA, F=17.76, df=7, P=0.008; anterograde: ANOVA, F=16.21, df=7, P=0.01; Bonferroni post hoc test). *P < 0.05, **P < 0.01). D) Representative images of DIV21 hippocampal primary neurons incubated with 5 μg/ml FM4-64 for 3 min KCl stimulation with or without trolox treatment (200 μM, 4 h pretreatment). Right panels show enlarged images of boxed areas in left panels. E) Quantification of FM4-64 puncta intensity in non-TG and RanBP9 TG neurons between vehicle- and trolox-treated cells. Graph represents relative means ± sem. ANOVA test shows significant differences between non-TG vs. RanBP9 groups in the absence of trolox treatment (F=59.79, df=27, P<0.000001; Bonferroni post hoc test). *P < 0.05, ***P < 0.001. F) Intact synaptosomes were isolated from the frontal cortices of 10- to 12-mo-old RanBP9 TG mice or their WT littermates. In the presence or absence of ATP (10 μM), equal protein amounts of synaptosomes were subjected to MTT reduction assay. Note that RanBP9 TG synaptosomes exhibit significantly reduced MTT reduction activity in both basal and ATP-stimulated conditions compared to those from WT littermates (ANOVA, F=35.3, df=11, P<0.0001; Bonferroni post hoc test: P<0.01, WT basal vs. RanBP9 basa); P<0.01, WT ATP vs. RanBP9 ATP). **P < 0.01.
It has been shown that absence of mitochondria in synapses results in failure to maintain neurotransmission in mouse models of AD (37). Given the reduction of movable and anterograde mitochondrial axonal transport in RanBP9 TG neurons, we hypothesized that synaptic function is negatively altered in RanBP9 TG neurons due to decreased mitochondrial content in synapses. To test this possibility, we used FM4-64 dye, which stains active synapses by incorporating into recycling synaptic vesicles in an activity-dependent manner. Cells were grown until DIV21 since synaptic connections are fully mature at this stage (38). Neurons were treated with or without 100 mM KCl for 3 min and incubated with 5 μg/ml FM4-64 in NT solution (2 mM Ca2+). Under basal unstimulated conditions, RanBP9 TG neurons show a small but significant reduction in FM4-64 incorporation (Fig. 7D, E). Depolarization caused increased FM4-64 incorporation in both non-TG and RanBP9 TG neurons. However, the increase in synaptic activity was dramatically lower in RanBP9 TG neurons (Fig. 7D, E). Prior treatment with trolox for 4 h completely restored the synaptic activity defect in RanBP9 TG neurons (Fig. 7D, E), consistent with the observed restoration of anterograde axonal transport of mitochondria after treatment with trolox. To ascertain whether RanBP9 promotes synaptic mitochondrial dysfunction in vivo, as predicted by our data from primary neurons, intact synaptosomes were isolated from frontal cortices of 10- to 12-mo-old RanBP9 TG mice and their respective WT littermates. Equal protein amounts of synaptosome fractions were then subjected to MTT reduction assay with or without addition of ATP, a sensitive indicator of mitochondrial activity. Under basal conditions without ATP stimulation, synaptosomes derived from RanBP9 TG brains showed significantly reduced MTT reduction activity compared to those from WT littermates (Fig. 7F). Addition of ATP significantly stimulated MTT reduction in both WT and RanBP9 TG synaptosomes. However, those from RanBP9 brain remained significantly reduced compared to WT synaptosomes (Fig. 7F). To determine evidence of mitochondrial dysfunction in vivo by a different approach, we performed immunohistochemical analysis of the functional mitochondrial marker COX IV in hippocampus of 33-wk-old RanBP9 TG mice, hemizygous-knockout (RanBP9+/−) mice, and their respective WT littermates. COX IV serves as an essential enzyme in the electron transport chain and catalyzes the final step of oxidative phosphorylation in mitochondria. Loss of COX IV is known to be involved in reduction of mitochondrial respiration, compromised MMP, and even apoptosis induction (39). Consistent with our results in primary neurons, we observed a significant decrease in COX IV immunoreactivity in the dentate gyrus of RanBP9 TG compared to non-TG littermate hippocampus (Supplemental Fig. S3A). Conversely, COX IV immunoreactivity was significantly increased in the dentate gyrus of RanBP9+/− hippocampus compared to that of WT littermates (Supplemental Fig. S3B). These results, taken together, indicate the crucial role of mitochondrial ROS, MMP, and impaired axonal transport of mitochondria in synaptic impairment secondary to increased RanBP9 levels in primary neurons and in brain.
DISCUSSION
Mitochondrial dysfunction is widely hypothesized to be an important component of neurodegenerative diseases, including AD. Indeed, accumulations of Aβ and tau are both associated with mitochondrial dysfunction at multiple levels (1–3). In this study, we made a series of novel observations implicating the cooperative involvement of Aβ, RanBP9, and cofilin in a pathway of mitochondrial dysfunction that induces calcium deregulation and renders neurons more vulnerable to degeneration and synaptic impairment. Increased ROS production, mitochondrial dysfunction, Ca2+ dysregulation, axonal transport deficits, and synaptic impairment are key elements of AD pathogenesis. Indeed, it has been shown that oxidative stress and mitochondrial dysfunction precede plaque pathology and neurodegeneration (40, 41). This study clearly demonstrated that RanBP9 induces all of the above changes, and reducing mitochondrial superoxide levels by trolox reversed most major changes in mitochondrial dysfunction, axonal transport, and synaptic impairment. Therefore, ROS overproduction appears to be a key culprit in inducing these changes. However, the major source of ROS production is leakage of superoxides from damaged or dysfunctional mitochondria, which are then converted to peroxides to induce oxidative stress (42). Such oxidative stress has harmful effects on various cellular and molecular targets and can potentiate damage to mitochondria, further propagating ROS production. RanBP9 and Aβ appear to exert largely overlapping and additive effects on several measures of mitochondrial dysfunction (mito-ROS) and calcium deregulation. Indeed, we recently showed that RanBP9 knockdown partially abrogates Aβ-induced cytotoxicity in HT22 cells (13) and a recent report showed that Aβ selectively targets the mitochondrial route of Ca2+ clearance (23).
To determine the cause of RanBP9-dependent potentiation after Aβ treatment, we investigated how RanBP9 TG neurons handle evoked Ca2+ transients. The baseline before depolarization as well as peak and amplitude of Ca2+ after depolarization were unchanged in RanBP9 TG neurons, indicating that the basic machinery for inducing Ca2+ transients and removing low Ca2+ content are intact. However, the delay in removing Ca2+ transients when reaching high levels after KCl or carbachol treatment was clearly evident in RanBP9 TG neurons, conditions approximating high synaptic activity or Aβ accumulation. The cause of such Ca2+ clearance defect was likely due to the MCU and not SERCA or PMCA, clearly indicating selective mitochondrial dysfunction. Although the potential role of sodium Ca2+ exchangers in Ca2+ removal was not addressed in this study, the contribution of MCU, as detected by inhibition with Ru360, was sufficient to clearly identify MCU as the sole or major defect. However, additional work will be needed to clearly rule out a contribution of the sodium Ca2+ exchanger in this Ca2+ deregulation. In addition, the defect of mitochondrial Ca2+ uptake was restored by the antioxidant trolox. These findings are in line with a recently proposed model describing impairment of short-term plasticity in mossy fiber synapses by mitochondrial dysfunction and related calcium dysregulation in the TG2576 APP TG mouse model (23).
Another critical component downstream of RanBP9 is cofilin, a key regulator of actin dynamics and oxidant-induced apoptosis via mitochondria. We found that RanBP9 increased the activation and translocation of cofilin into mitochondria. On activation/dephosphorylation of cofilin and increased ROS levels, cofilin becomes oxidized on several cysteine residues (29). This causes cofilin to lose its affinity for actin and to translocate into the mitochondria, where it induces swelling, drop in MMP, and cytochrome c release by promoting the opening of the permeability transition pore (29). When oxidation of cofilin is prevented, oxidant-induced apoptosis is also inhibited. Indeed, we found that trolox treatment dramatically reduced translocation of cofilin into mitochondria, in line with its proposed role in mitochondrial apoptosis. Whether the role of RanBP9 in translocating into mitochondria follows a similar oxidative mechanism remains to be determined. Consistent with our current observations, we previously demonstrated that cofilin is required for both Aβ- and RanBP9-induced apoptosis (13). Interestingly, inhibition of actin dynamics is associated with increased ROS production and reduced MMP (43), both of which can further contribute to cofilin-mediated mitochondrial dysfunction. Therefore, increased ROS production by RanBP9 or other factors is likely to further contribute to cofilin activation, oxidation, and translocation into mitochondria, perpetuating a pathogenic positive feedback cycle of mitochondrial dysfunction. Furthermore, cofilin activation/dephosphorylation, oxidative stress, and mitochondrial damage also induce the formation of cofilin-actin rods, structures that impede axonal transport of mitochondria and are found in brains of patients with AD and AD animal models (27, 31, 44). Indeed, it has also been shown that Aβ promotes cofilin/actin rods via a mechanism involving the dephosphorylation and activation of cofilin (33). Therefore, RanBP9 and Aβ most likely converge on cofilin activation via overlapping ROS and Ca2+ pathways to potentiate mitochondrial dysfunction. Given the potentiating effects of the tumor suppressor protein p73 with RanBP9 in apoptosis (35, 45), it remains to be determined how RanBP9, cofilin, and p73 synergize in mitochondria-mediated apoptotic cascade.
In this study, we observed that axonal transport of mitochondria, especially anterograde transport, was significantly decreased in RanBP9 TG neurons, a finding that is reminiscent of that seen by treatment with Aβ (5) and consistent with the tendency for mitochondria with higher and lower MMP to be transported anterogradely and retrogradely, respectively (36). Trolox, which corrected MMP and reduced superoxides in RanBP9 TG neurons, also restored anterograde transport of mitochondria toward synapses and the corresponding synaptic activity. Indeed, intact synaptosomes derived from RanBP9 TG mice demonstrated significantly reduced mitochondrial activity. Furthermore, a key mitochondrial enzyme, COX IV, was inversely regulated by RanBP9 levels in WT, RanBP9 TG, and RanBP9+/− brains. Taken together with observations in primary neurons and brain, the present findings indicate that Aβ, RanBP9, and cofilin cooperate together to induce mitochondrial dysfunction, Ca2+ deregulation, and ROS overproduction, leading to synaptic alterations and neurodegenerative changes reminiscent of those seen in AD. Although antioxidant therapies per se have not been successful in treating AD, our findings indicate that combinatorial targeting of the Aβ-RanBP9-cofilin-related oxidative mitochondrial stress pathways could elucidate promising therapeutic targets for AD.
Supplementary Material
Acknowledgments
The authors thank Dr. Elisabetta Bianchi (Pasteur Institute, Paris, France) for the RanBP9 monoclonal antibody and Dr. Won Kyung Ho (Seoul National University, Seoul, Korea) for helpful discussions.
This work was supported in part by U.S. National Institutes of Health/National Institute on Aging grants (1R01AG033055 and 1K02AG031920, D.E.K.), a World Class University–Neurocytomics Project grant from the National Research Foundation of Korea (NRF-K; D.E.K., I.M.-J.), and an NRF-K grant (S.J.K., 2011-0030737).
The authors declare no conflicts of interest.
This article includes supplemental data. Please visit http://www.fasebj.org to obtain this information.
- Aβ
- amyloid β
- AD
- Alzheimer's disease
- APP
- amyloid precursor protein
- BACE1
- β-site APP cleaving enzyme 1
- COX
- cytochrome c oxidase
- DIV
- day in vitro
- DMSO
- dimethyl sulfoxide
- ER
- endoplasmic reticulum
- FCCP
- carbonylcyanide-p-(trifluoromethoxy)-phenylhydrazone
- LRP
- low-density lipoprotein-related protein
- MCU
- mitochondrial calcium uniporter
- MMP
- mitochondrial membrane potential
- MTT
- 3-(4,5-dimethylthiazol-2-yl)-2,5-diphenyltetrazolium bromide
- NT
- normal Tyrode
- PMCA
- plasma membrane calcium-ATPase
- ROS
- reactive oxygen species
- SERCA
- sarco/endoplasmic reticulum calcium-ATPase
- TG
- transgenic
- TMRM
- tetramethylrhodamine ethylester
REFERENCES
- 1. Eckert A., Hauptmann S., Scherping I., Rhein V., Muller-Spahn F., Gotz J., Muller W. E. (2008) Soluble beta-amyloid leads to mitochondrial defects in amyloid precursor protein and tau transgenic mice. Neurodegener. Dis. 5, 157–159 [DOI] [PubMed] [Google Scholar]
- 2. Manczak M., Anekonda T. S., Henson E., Park B. S., Quinn J., Reddy P. H. (2006) Mitochondria are a direct site of A beta accumulation in Alzheimer's disease neurons: implications for free radical generation and oxidative damage in disease progression. Hum. Mol. Genet. 15, 1437–1449 [DOI] [PubMed] [Google Scholar]
- 3. Yao J., Irwin R. W., Zhao L., Nilsen J., Hamilton R. T., Brinton R. D. (2009) Mitochondrial bioenergetic deficit precedes Alzheimer's pathology in female mouse model of Alzheimer's disease. Proc. Natl. Acad. Sci. U. S. A. 106, 14670–14675 [DOI] [PMC free article] [PubMed] [Google Scholar]
- 4. Moreira P. I., Santos M. S., Moreno A., Oliveira C. (2001) Amyloid beta-peptide promotes permeability transition pore in brain mitochondria. Biosci. Rep. 21, 789–800 [DOI] [PubMed] [Google Scholar]
- 5. Du H., Guo L., Yan S., Sosunov A. A., McKhann G. M., Yan S. S. (2010) Early deficits in synaptic mitochondria in an Alzheimer's disease mouse model. Proc. Natl. Acad. Sci. U. S. A. 107, 18670–18675 [DOI] [PMC free article] [PubMed] [Google Scholar]
- 6. Brown M. R., Geddes J. W., Sullivan P. G. (2004) Brain region-specific, age-related, alterations in mitochondrial responses to elevated calcium. J. Bioenerg. Biomembr. 36, 401–406 [DOI] [PubMed] [Google Scholar]
- 7. Jaiswal M. K., Zech W. D., Goos M., Leutbecher C., Ferri A., Zippelius A., Carri M. T., Nau R., Keller B. U. (2009) Impairment of mitochondrial calcium handling in a mtSOD1 cell culture model of motoneuron disease. BMC Neurosci. 10, 64. [DOI] [PMC free article] [PubMed] [Google Scholar]
- 8. Lakshmana M. K., Yoon I. S., Chen E., Bianchi E., Koo E. H., Kang D. E. (2009) Novel role of RanBP9 in BACE1 processing of amyloid precursor protein and amyloid beta peptide generation. J. Biol. Chem. 284, 11863–11872 [DOI] [PMC free article] [PubMed] [Google Scholar]
- 9. Lakshmana M. K., Hayes C. D., Bennett S. P., Bianchi E., Reddy K. M., Koo E. H., Kang D. E. (2012) Role of RanBP9 on amyloidogenic processing of APP and synaptic protein levels in the mouse brain. FASEB J. 26, 2072–2083 [DOI] [PMC free article] [PubMed] [Google Scholar]
- 10. Kang D. E., Roh S. E., Woo J. A., Liu T., Bu J. H., Jung A. R., Lim Y. (2011) The interface between cytoskeletal aberrations and mitochondrial dysfunction in Alzheimer's disease and related disorders. Exp. Neurobiol. 20, 67–80 [DOI] [PMC free article] [PubMed] [Google Scholar]
- 11. Lakshmana M. K., Chung J. Y., Wickramarachchi S., Tak E., Bianchi E., Koo E. H., Kang D. E. (2010) A fragment of the scaffolding protein RanBP9 is increased in Alzheimer's disease brains and strongly potentiates amyloid-beta peptide generation. FASEB J. 24, 119–127 [DOI] [PMC free article] [PubMed] [Google Scholar]
- 12. Woo J. A., Roh S. E., Lakshmana M. K., Kang D. E. (2012) Pivotal role of RanBP9 in integrin-dependent focal adhesion signaling and assembly. FASEB J. 26, 1672–1681 [DOI] [PMC free article] [PubMed] [Google Scholar]
- 13. Woo J. A., Jung A. R., Lakshmana M. K., Bedrossian A., Lim Y., Bu J. H., Park S. A., Koo E. H., Mook-Jung I., Kang D. E. (2012) Pivotal role of the RanBP9-cofilin pathway in Abeta-induced apoptosis and neurodegeneration. Cell Death Differ. 19, 1413–1423 [DOI] [PMC free article] [PubMed] [Google Scholar]
- 14. Hotulainen P., Paunola E., Vartiainen M. K., Lappalainen P. (2005) Actin-depolymerizing factor and cofilin-1 play overlapping roles in promoting rapid F-actin depolymerization in mammalian nonmuscle cells. Mol. Biol. Cell. 16, 649–664 [DOI] [PMC free article] [PubMed] [Google Scholar]
- 15. Dahlgren K. N., Manelli A. M., Stine W. B., Jr., Baker L. K., Krafft G. A., LaDu M. J. (2002) Oligomeric and fibrillar species of amyloid-beta peptides differentially affect neuronal viability. J. Biol. Chem. 277, 32046–32053 [DOI] [PubMed] [Google Scholar]
- 16. Palavicini J. P., Wang H., Bianchi E., Xu S., Rao J. S., Kang D. E., Lakshmana M. K. (2013) RanBP9 aggravates synaptic damage in the mouse brain and is inversely correlated to spinophilin levels in Alzheimer's brain synaptosomes. Cell Death Dis. 4, e667. [DOI] [PMC free article] [PubMed] [Google Scholar]
- 17. Yan S. D., Stern D. M. (2005) Mitochondrial dysfunction and Alzheimer's disease: role of amyloid-beta peptide alcohol dehydrogenase (ABAD). Int. J. Exp. Pathol. 86, 161–171 [DOI] [PMC free article] [PubMed] [Google Scholar]
- 18. Nilsen J., Chen S., Irwin R. W., Iwamoto S., Brinton R. D. (2006) Estrogen protects neuronal cells from amyloid beta-induced apoptosis via regulation of mitochondrial proteins and function. BMC. Neurosci. 7, 74. [DOI] [PMC free article] [PubMed] [Google Scholar]
- 19. Goodman Y., Steiner M. R., Steiner S. M., Mattson M. P. (1994) Nordihydroguaiaretic acid protects hippocampal neurons against amyloid beta-peptide toxicity, and attenuates free radical and calcium accumulation. Brain Res. 654, 171–176 [DOI] [PubMed] [Google Scholar]
- 20. Bezprozvanny I. (2009) Calcium signaling and neurodegenerative diseases. Trends Mol. Med. 15, 89–100 [DOI] [PMC free article] [PubMed] [Google Scholar]
- 21. Brocard J. B., Tassetto M., Reynolds I. J. (2001) Quantitative evaluation of mitochondrial calcium content in rat cortical neurones following a glutamate stimulus. J. Physiol. 531, 793–805 [DOI] [PMC free article] [PubMed] [Google Scholar]
- 22. Toescu E. C., Verkhratsky A. (2007) Role of calcium in normal aging and neurodegeneration. Aging Cell 6, 265. [DOI] [PubMed] [Google Scholar]
- 23. Lee S. H., Kim K. R., Ryu S. Y., Son S., Hong H. S., Mook-Jung I., Lee S. H., Ho W. K. (2012) Impaired short-term plasticity in mossy fiber synapses caused by mitochondrial dysfunction of dentate granule cells is the earliest synaptic deficit in a mouse model of Alzheimer's disease. J. Neurosci. 32, 5953–5963 [DOI] [PMC free article] [PubMed] [Google Scholar]
- 24. Distelmaier F., Visch H. J., Smeitink J. A., Mayatepek E., Koopman W. J., Willems P. H. (2009) The antioxidant trolox restores mitochondrial membrane potential and Ca2+-stimulated ATP production in human complex I deficiency. J. Mol. Med. (Berl.) 87, 515–522 [DOI] [PMC free article] [PubMed] [Google Scholar]
- 25. Numakawa Y., Numakawa T., Matsumoto T., Yagasaki Y., Kumamaru E., Kunugi H., Taguchi T., Niki E. (2006) Vitamin E protected cultured cortical neurons from oxidative stress-induced cell death through the activation of mitogen-activated protein kinase and phosphatidylinositol 3-kinase. J. Neurochem. 97, 1191–1202 [DOI] [PubMed] [Google Scholar]
- 26. Salgo M. G., Pryor W. A. (1996) Trolox inhibits peroxynitrite-mediated oxidative stress and apoptosis in rat thymocytes. Arch. Biochem. Biophys. 333, 482–488 [DOI] [PubMed] [Google Scholar]
- 27. Bernstein B. W., Bamburg J. R. (2010) ADF/cofilin: a functional node in cell biology. Trends Cell Biol. 20, 187–195 [DOI] [PMC free article] [PubMed] [Google Scholar]
- 28. Chua B. T., Volbracht C., Tan K. O., Li R., Yu V. C., Li P. (2003) Mitochondrial translocation of cofilin is an early step in apoptosis induction. Nat. Cell Biol. 5, 1083–1089 [DOI] [PubMed] [Google Scholar]
- 29. Klamt F., Zdanov S., Levine R. L., Pariser A., Zhang Y., Zhang B., Yu L. R., Veenstra T. D., Shacter E. (2009) Oxidant-induced apoptosis is mediated by oxidation of the actin-regulatory protein cofilin. Nat. Cell Biol. 11, 1241–1246 [DOI] [PMC free article] [PubMed] [Google Scholar]
- 30. Wabnitz G. H., Goursot C., Jahraus B., Kirchgessner H., Hellwig A., Klemke M., Konstandin M. H., Samstag Y. (2010) Mitochondrial translocation of oxidized cofilin induces caspase-independent necrotic-like programmed cell death of T cells. Cell Death Dis. 1, e58. [DOI] [PMC free article] [PubMed] [Google Scholar]
- 31. Bernstein B. W., Chen H., Boyle J. A., Bamburg J. R. (2006) Formation of actin-ADF/cofilin rods transiently retards decline of mitochondrial potential and ATP in stressed neurons. Am. J. Physiol. Cell Physiol. 291, C828–C839 [DOI] [PubMed] [Google Scholar]
- 32. Gourlay C. W., Ayscough K. R. (2005) The actin cytoskeleton: a key regulator of apoptosis and ageing? Nat. Rev. Mol. Cell Biol. 6, 583–589 [DOI] [PubMed] [Google Scholar]
- 33. Davis R. C., Marsden I. T., Maloney M. T., Minamide L. S., Podlisny M., Selkoe D. J., Bamburg J. R. (2011) Amyloid beta dimers/trimers potently induce cofilin-actin rods that are inhibited by maintaining cofilin-phosphorylation. Mol. Neurodegener. 6, 10. [DOI] [PMC free article] [PubMed] [Google Scholar]
- 34. Berkova Z., Morris A. P., Estes M. K. (2003) Cytoplasmic calcium measurement in rotavirus enterotoxin-enhanced green fluorescent protein (NSP4-EGFP) expressing cells loaded with Fura-2. Cell Calcium 34, 55–68 [DOI] [PubMed] [Google Scholar]
- 35. Liu T., Roh S. E., Woo J. A., Ryu H., Kang D. E. (2013) Cooperative role of RanBP9 and P73 in mitochondria-mediated apoptosis. Cell Death Dis. 4, e476. [DOI] [PMC free article] [PubMed] [Google Scholar]
- 36. Miller K. E., Sheetz M. P. (2004) Axonal mitochondrial transport and potential are correlated. J. Cell Sci. 117, 2791–2804 [DOI] [PubMed] [Google Scholar]
- 37. Calkins M. J., Reddy P. H. (2011) Amyloid beta impairs mitochondrial anterograde transport and degenerates synapses in Alzheimer's disease neurons. Biochim. Biophys. Acta 1812, 507–513 [DOI] [PMC free article] [PubMed] [Google Scholar]
- 38. Bertrand S. J., Aksenova M. V., Aksenov M. Y., Mactutus C. F., Booze R. M. (2011) Endogenous amyloidogenesis in long-term rat hippocampal cell cultures. BMC Neurosci. 12, 38. [DOI] [PMC free article] [PubMed] [Google Scholar]
- 39. Li Y., Park J. S., Deng J. H., Bai Y. (2006) Cytochrome c oxidase subunit IV is essential for assembly and respiratory function of the enzyme complex. J. Bioenerg. Biomembr. 38, 283–291 [DOI] [PMC free article] [PubMed] [Google Scholar]
- 40. Nunomura A., Perry G., Aliev G., Hirai K., Takeda A., Balraj E. K., Jones P. K., Ghanbari H., Wataya T., Shimohama S., Chiba S., Atwood C. S., Petersen R. B., Smith M. A. (2001) Oxidative damage is the earliest event in Alzheimer disease. J. Neuropathol. Exp. Neurol. 60, 759–767 [DOI] [PubMed] [Google Scholar]
- 41. Pratico D. (2001) In vivo measurement of the redox state. Lipids 36(Suppl.), S45–S47 [DOI] [PubMed] [Google Scholar]
- 42. Lambert A. J., Brand M. D. (2009) Reactive oxygen species production by mitochondria. Methods Mol. Biol. 554, 165–181 [DOI] [PubMed] [Google Scholar]
- 43. Gourlay C. W., Ayscough K. R. (2005) A role for actin in aging and apoptosis. Biochem. Soc. Trans. 33, 1260–1264 [DOI] [PubMed] [Google Scholar]
- 44. Cichon J., Sun C., Chen B., Jiang M., Chen X. A., Sun Y., Wang Y., Chen G. (2012) Cofilin aggregation blocks intracellular trafficking and induces synaptic loss in hippocampal neurons. J. Biol. Chem. 287, 3919–3929 [DOI] [PMC free article] [PubMed] [Google Scholar]
- 45. Kramer S., Ozaki T., Miyazaki K., Kato C., Hanamoto T., Nakagawara A. (2005) Protein stability and function of p73 are modulated by a physical interaction with RanBPM in mammalian cultured cells. Oncogene 24, 938–944 [DOI] [PubMed] [Google Scholar]
Associated Data
This section collects any data citations, data availability statements, or supplementary materials included in this article.