

Abstract
Motivation: The translational landscape of diverse cellular systems remains largely uncharacterized. A detailed understanding of the control of gene expression at the level of messenger RNA translation is vital to elucidating a systems-level view of complex molecular programs in the cell. Establishing the degree to which such post-transcriptional regulation can mediate specific phenotypes is similarly critical to elucidating the molecular pathogenesis of diseases such as cancer. Recently, methods for massively parallel sequencing of ribosome-bound fragments of messenger RNA have begun to uncover genome-wide translational control at codon resolution. Despite its promise for deeply characterizing mammalian proteomes, few analytical methods exist for the comprehensive analysis of this paired RNA and ribosome data.
Results: We describe the Babel framework, an analytical methodology for assessing the significance of changes in translational regulation within cells and between conditions. This approach facilitates the analysis of translation genome-wide while allowing statistically principled gene-level inference. Babel is based on an errors-in-variables regression model that uses the negative binomial distribution and draws inference using a parametric bootstrap approach. We demonstrate the operating characteristics of Babel on simulated data and use its gene-level inference to extend prior analyses significantly, discovering new translationally regulated modules under mammalian target of rapamycin (mTOR) pathway signaling control.
Availability: The Babel framework is freely available as source code at http://taylorlab.ucsf.edu/software_data.html.
Contact: barry.taylor@ucsf.edu
Supplementary information: Supplementary data are available at Bioinformatics online.
1 INTRODUCTION
The translation of cellular messenger RNAs (mRNAs) is the all-important final product of gene expression. Nevertheless, a complete understanding of gene expression at the level of mRNA translation is generally lacking. As mRNA levels explain only a modest fraction of protein abundance, we must establish the landscape of mRNA translation and determine the mechanisms by which it is regulated to fully elucidate diverse cellular systems. Nevertheless, genome-scale characterization of translational changes has lagged behind the development of similar methods for exploring mammalian transcriptomes. Recent advances in profiling ribosome occupancy with deep sequencing (Ingolia et al., 2009), however, now allows a near codon resolution view of ribosome-bound mRNAs. Briefly, ribosome profiling entails isolating fragments of such mRNAs, which results in ∼30 bp ribosome-protected fragments (RPFs) that are purified and processed for massively parallel sequencing. Simultaneously, and from the same cells, poly(A)+ mRNA is purified, and concurrent sequencing of both ribosome and RNA libraries generates short sequence reads that identify either the position of a bound ribosome or the expression of the cognate transcript. These methods have been used to explore translation in diverse genomes including those from yeast, zebrafish, murine models and human cancers (Bazzini et al., 2012; Guo et al., 2010; Hsieh et al., 2012; Ingolia et al., 2011; Thoreen et al., 2012).
These studies have revealed a complex and multifaceted translational landscape in mammalian transcriptomes. Although open reading frames (ORFs) that initiate with an AUG codon are canonical and are perhaps best characterized, a variety of non-canonical structures also contribute to the diversity and complexity of translation. These include upstream ORFs, non-AUG initiation of translation, internal ribosome entry sites, translational re-initiation and frameshift, leaky scanning and the ever expanding world of small RNAs: expressed short and long non-coding sequences that lack an ORF.
So, although ribosome profiling promises a new window into the nature and dynamics of normal and anomalous mRNA translation, progress is predicated on the development of robust methodologies to facilitate statistically principled analysis. Prior analyses have described the global features of translational efficiency in different systems, species and upon multiple perturbations by comparing the log of scaled ribosome counts to the log of scaled mRNA counts for groups of genes (Bazzini et al., 2012; Guo et al., 2010; Hsieh et al., 2012; Ingolia et al., 2009, 2011; Thoreen et al., 2012). However, it is unclear how such a measure would lead naturally to inference about the biological significance of individual changes in genes, especially in the presence of few replicates. There is, therefore, a great need for robust methods for drawing gene-level inference on the basis of changes in translational regulation or even subtle shifts in patterns of ribosome occupancy. The importance of such quantitative methods will only grow as ribosome profiling is adopted more widely to characterize translational abnormalities that drive diverse pathologies including human cancers. Such efforts would serve as a vital companion to extensive genetic characterization efforts already underway, such as The Cancer Genome Atlas (http://cancergenome.nih.gov/).
Here, to facilitate such efforts, we describe a statistical framework, Babel, for determining genes with unexpected ribosome occupancy: those insufficiently explained by their intrinsic transcript abundance within a condition, and those whose ribosome association changes in magnitude or direction between conditions (Fig. 1A). We demonstrate its statistical properties through simulations, and its applicability through the re-analysis of ribosome profiling data interrogating translational control downstream of the mTOR signaling pathway.
Fig. 1.

The Babel framework and analysis. (A) A schematic of the Babel framework in which ribosome profiling data are processed and aligned, and an NB-regression-NB model is developed in each sample to identify genes whose ribosome association is higher or lower (red and blue arrows, respectively) than expected (gray) from its mRNA expression level. Significant translationally regulated genes across all the samples of a given condition are determined (left) as are those that change significantly between conditions (right). (B) Although multiple candidate parametric and non-parametric regression forms were evaluated for estimating ribosome association based on mRNA abundance (plotted here as read counts in log-scale), the trimmed least squares approach was chosen (see text). (C) Errors-in-variables regression is justified by the intrinsic uncertainty of mRNA levels under the NB distribution where variability increases with increasing level of expression, demonstrated here for three genes with NB means of 100, 500 and 1000. The NB model of ribosome-given-mRNA counts is further necessitated by significantly greater variance than mean RPF counts across the distribution of mRNA abundance (inset)
2 METHODS
2.1 Outline of methods
The relationship between the level of ribosome occupancy and mRNA expression transcriptome-wide can be described quantitatively from sequencing data. We sought to exploit the monotonic relationship between ribosome association and mRNA levels as the basis for the gene-level inference described here (Fig. 1B). For a transcript with a given abundance, the expected level of ribosome occupancy can be inferred so that translationally regulated genes are those for which the level of bound ribosome deviates significantly from that expected value. To estimate this expected level, we developed an errors-in-variables regression model. Unlike typical regression, our model treats the mRNA level (predictor) as measured with error rather than as fixed. As a first step, mRNA levels are modeled by the negative binomial (NB) distribution, as is convention (Robinson and Smyth, 2008), because the variance of the counts is greater than the mean. As a second step, because ribosome occupancy involves counts for which there is again extra Poisson variation (Fig. 1C), we also model the level of bound ribosome given mRNA abundance as NB. To estimate the mean in the second part of the model, we tested multiple regression forms (Fig. 1B). A trimmed least-squares approach (for which a fraction of genes with outlying mRNA levels were excluded before model fitting) was most stable over all experiments (data not shown). This second over-dispersion parameter is modeled using an iterative algorithm to prevent overestimation. Subsequent inference under Babel is based on a parametric bootstrap. Specifically, in every sample with mRNA and ribosome data, we estimate a P-value for every gene under the null hypothesis that the level of bound ribosome is as expected from mRNA abundance. These P-values are estimated for a one-sided test in which both low and high P-values are of interest; low P-values correspond to higher than expected ribosome-given-mRNA counts and high P-values correspond to the opposite.
Because Babel quantifies gene-level mRNA translation (ribosome occupancy given mRNA levels) as a P-value in each sample of a given condition, a particularly important challenge is to combine these into a single assessment of the significance of translational regulation based on at best a few biological replicates. A long-standing approach for combining multiple independent P-values is Fisher’s method (see Equation 4). One aspect of Fisher’s method is that when the number of P-values is small, a single low P-value can lead to a significant combined P-value (Fig. 2A). We exploited an alternative method that instead emphasizes consistency among replicates, reasoning that consistently strong signals are most likely to represent true events of biological significance. This approach results in a combined P-value that is a function of the arithmetic mean of the individual P-values. This method maintains symmetry between each of two or more tests of hypotheses and their P-values as well as convexity (of the acceptance and rejection regions) (Fig. 2B and C). It produces a small combined P-value from consistently small one-sided P-values of ribosome-given-mRNA levels (and the reverse for two or more large one-sided P-values). Once combined, two-sided P-values can be estimated and genes are considered regulated at the translational level if their corresponding P-values are low after adjusting for multiple comparisons (Fig. 2D).
Fig. 2.
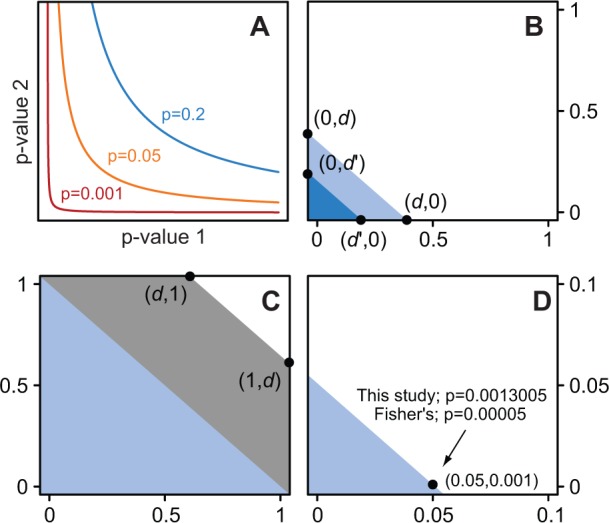
Combining multiple tests. (A) Fisher’s method for combining two independent tests. (B) Our alternative approach based on the arithmetic mean of P-values. All equally significant pairs define a line passing through (d, 0) and (0, d), whereas more significant pairs correspond to a line with d’ < d (dark blue). Thus, the combined P-value corresponds to the area of the triangle. (C) One-sided P-values are used; therefore, the opposite triangle is used for pairs of consistently large P-values. (D) A practical example of the difference between approaches
An equally important problem is identifying genes whose ribosome occupancy relative to its mRNA abundance changes between conditions. We developed a statistical test for this purpose based on the differences in the within-condition P-values. After transforming the P-values using the Gaussian quantile function, a Z-test is used and two-sided P-values are obtained.
All analyses conducted here, unless otherwise specified, were performed using the R statistical language, version 2.11.
2.2 Sequencing and alignment
The ribosome profiling strategy, described elsewhere (Ingolia et al., 2009), produces short single-end sequencing reads of between 36 and 50 bp. Data analyzed here were generated from libraries prepared and sequenced as previously described (Hsieh et al., 2012) and downloaded from the NCBI Gene Expression Omnibus under the accession number GSE35469. Because the ribosome-bound mRNA fragment may be a variable-length component of each sequencing read followed by a known adapter sequence (CTGTAGGCACCATCAAT), raw sequencing reads in FASTQ format were first clipped of the adaptor and remaining 3′ sequence with the FASTX-Toolkit, retaining only reads of 24 bp post-clipping length or longer. Reads were mapped to the human assembly (NCBI build 36) with Burrows–Wheeler Alignment (ver. 0.5.9-r16, default parameters) (Li and Durbin, 2009). Unaligned reads were then mapped to known splice junctions with Tophat (ver. 1.4.1) (Trapnell et al., 2009) using a transcriptome index created from version 11 of the Gencode gene set (Harrow et al., 2006). Provisional merged BAM files (Li et al., 2009) were created from aligned and unaligned reads from either the genome or spliced alignment, and read groups were enforced across lanes and experiments. BAM files were then indexed, coordinate sorted and had alignment metrics determined, all with the Picard suite (http://picard.sourceforge.net/).
2.3 Gene-level assessment
For all gene-level inference, only those protein-coding transcripts of levels 1 or 2 of Gencode support (verified or manually curated loci, respectively) were used. We initially assessed two candidate gene models. The first retained only the longest transcript of multi-isoform genes. The second was a unified gene model in which the union of coding sequence across all isoforms of a given gene was collapsed into a single model per gene. As no significant difference in read mapping or expression (as reads per kilobase of exon model per million mapped reads; rpkM) was observed between these two models, all subsequent analyses used the unified model. The gene-level inference of ribosome-given-mRNA levels described here evaluated only those genes that we estimated to be expressed in the studied transcriptome. To determine expressed genes, we first mapped aligned reads to their coding sequences, treated spliced reads between exons as a single fragment and excluded ambiguous reads (those aligning to overlapping coding sequence of two distinct genes: 1.52–2.79% of coding sequence reads across the aligned libraries). We then calculated a normalized RPKM expression estimate based on scaled library sizes using Trimmed Mean of M-values (TMM) normalization (Robinson and Oshlack, 2010). We also generated a null distribution of similar expression (normalized rpkM) in randomly selected regions of the genome with a size distribution sampled from the empirical size distribution. These regions were selected from a genome masked of all coding and non-coding RNAs (Gencode; levels 1–2) as well as any known or putative human expressed sequence tags. A P-value was estimated for each gene by comparison with the distribution of random genomic intervals. Genes with a nominal P-value < 0.05 were considered expressed (Supplementary Fig. S3).
2.4 Errors-in-variables regression of ribosome association on mRNA abundance
The NB distribution is used throughout the Babel statistical model (see Fig. 1). One parameterization of the NB distribution is with mean λ and variance λ(1 + λ ), where
  represents the parameter for over-dispersion (variance above what would be expected from the Poisson distribution). When
  is zero, the variance is equal to the mean, and the NB distribution is the same as the Poisson distribution.
Let xg,g = 1, … , n represent the mRNA level for the gth gene and yg,g = 1, … , n represent the level of bound ribosome for the same (levels are read counts in both cases). As is typical in modeling RNA-seq data, the mRNA levels for the gth gene are modeled as coming from a NB distribution. Because there are typically few replicates, we estimate a single over-dispersion parameter  x across genes using the method of Robinson and Smyth (Robinson and Smyth, 2008) as implemented in edgeR (Robinson et al., 2010). Then, we also model yg|xg as NB with mean xg
 , where
  is estimated from regression, and over-dispersion
  y. We tested multiple regression methods to identify the optimal approach for estimating
  · Candidate models included SuperSmoother, locally weighted regression (lowess), least squares, and robust least squares (Fig. 1B). Whereas the smoothing-based approaches tended to overestimate ribosome level in genes with low mRNA levels, robust least squares underestimated the expected ribosome level because of skew in the models for count data (in which median < mean) and least squares was susceptible to high leverage from genes with high expression (those in the right tail of the mRNA distribution). In all experimental conditions, a trimmed least-squares approach, where the g-percent of the genes (by default, g = 10) with lowest and highest mRNA levels are trimmed before model fit, was most stable, and thus is used. Although univariable in its current form, exploiting regression here will allow additional covariates to be incorporated that measure different facets of translational control, thereby increasing the accuracy of the model.
To estimate  y, after removing the ε-percent of the genes with the lowest and highest abundances, we partition the data based on mRNA abundance into B bins containing an equal number of genes (by default, B = 20 and ε = 10). For each bin, we compute the empirical variance of ribosome levels, Vb,b=1, … , B. Then,
  y is estimated by minimizing the squared error across bins:
| (1) |
Because there exists a set of genes for which ribosome levels are different than expected from their intrinsic mRNA levels, which are in fact the very genes we are trying to identify, we developed an iterative process to avoid overestimating  y. Here, we define an initial value
  and eliminate genes in the variance calculations with P-values <0.01 under the NB model with mean equal to the product of
  and the median mRNA abundance in the bin. To calculate the final
  , this process is repeated, seeded with
  (again, excluding outlier genes from the calculation of variance).
We use the parametric bootstrap and the modeling described previously to estimate P-values under the null hypothesis that the ribosome level is as expected from the mRNA level. Here, we begin by simulating mRNA values x*g1, … , x*gN for every gene from the NB distribution with mean xg and over-dispersion  , where N is typically 107 to obtain sufficient granularity of the P-values. Then each y*g1, … , y*gN is simulated once from a NB distribution with mean x*gj
 and over-dispersion
  , where
  and
and  are as described earlier. A one-sided P-value is calculated from these simulations as:
| (2) |
where I is the indicator function. This corresponds to the proportion of simulated read counts for bound ribosome greater than the observed count. Low P-values imply ribosome levels are greater than expected from a gene’s mRNA level, whereas high P-values imply the reverse. If there is only a single experiment, two-sided P-values are obtained as:
| (3) |
These P-values are corrected for multiple comparisons using the q-value method of Storey (Storey, 2002). Although the focus so far has been on the estimate of significance in a single sample, the next section details how to estimate both one- and two-sided P-values when there is more than one experiment in a condition.
2.5 Combining P-values within a condition
For every condition with two or more replicates, we would like a single consensus P-value to quantify how unexpected the ribosome levels are given the mRNA abundance of the gene in that condition. A common approach for combining independent P-values is Fisher’s method, which uses a test statistic S:
| (4) |
where S is distributed as χ2 with 2 n degrees of freedom. Here, S is a function of the product of the independent P-values, and thus it is proportional to the geometric mean of the P-values. Fisher’s method is sensitive to single small P-values. We have used and developed an application of alternative methodology proposed by Edgington (Edgington, 1972). The method, which is based on the arithmetic mean of P-values, estimates a combined P-value that is more appropriate than Fisher’s method in this context because it is less sensitive to single outlier P-values. In the case of two replicates i and j in a given condition, we let d = pi + pj for pi + pj ≤ 1. This defines a line that passes through (d, 0) and (0, d) (as in Fig. 2). Here, all pairs of P-values satisfying this condition are considered equally significant, whereas pairs satisfying d’ < d are considered more significant. Therefore, all more significant pairs of P-values trace out a triangle to the left of d. For pi + pj ≤ 1, the combined P-value is thus:
| (5) |
whereas for pi + pj > 1,
| (6) |
The first term corresponds to the triangle for d = 1 and the second corresponds to the trapezoid to the right of this line. Critically, input for this method is the one-sided P-values of ribosome level on mRNA, such that pairs of small one-sided P-values give small combined P-values and pairs of large one-sided P-values give large combined P-values.
Additionally, this methodology can be generalized to any number of dimensions using the same principles. The assumption, however, underlying the appropriate sampling distribution used to estimate P-values is difficult to compute. It is the distribution of the sum of independent, identically distributed random numbers, each uniformly distributed on the unit interval [0, 1]. This is known as the Irwin–Hall distribution (Hall, 1927; Irwin, 1927), where the density of d is:
| (7) |
Integration gives the cumulative distribution function of d:
| (8) |
The one-sided P-value is then P = Fn(d). A two-sided combined P-value can be obtained as before (3) and corrected for multiple comparisons as described previously.
2.6 Assessing changes in translational regulation between conditions
To compare the translational regulation for every gene between pairs of conditions, we test for equality of the within-condition P-values, which allows mRNA levels to change while maintaining a valid test. P-values are converted to standardized Z-statistics using the Gaussian quantile function G−1:
| (9) |
Let pij represent the one-sided P-value for ribosome relative to mRNA level for the ith condition and jth replicate for one gene. Assuming two replicates, the corresponding Z-statistics are zij, I = 1, 2, j = 1, 2. The test statistic for every gene g is therefore:
| (10) |
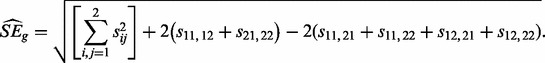
where  is the estimated standard error of the numerator. Accurately estimating SEg from a small number of values for every gene is challenging. Although previous methods developed for the analysis of small microarray studies have used moderated approaches (Smyth, 2004), we believe insufficient information exists within genes to derive an accurate estimate in this way. Therefore, we derive a single
  across genes. We calculate the variance–covariance matrix for the Zs, which leads to the estimate:
 |
(11) |
where the first term is for the variances and the second and third terms are for the covariances. Generally, if there exists other than two replicates, all within condition covariance terms are added, whereas all between condition covariance terms are subtracted. Now  would be estimated ideally from only the genes where there has been no change between conditions, but these genes are unknown. Therefore, if there are m total samples in the test, we screen out genes with numerators corresponding to Equation (10) greater than
  before estimating
  . Test statistics (10) can then be converted into two-sided P-values by comparison with the standard Gaussian distribution and corrected for multiple comparisons as described previously.
We note that although genes are correlated across conditions, this test uses only the P-values within conditions. Nevertheless, the denominator of the test includes the covariance of the statistics in the numerator, so this correlation is incorporated. Additionally, a more natural test may use ribosome occupancy counts directly instead of the Gaussian quantile transformation of the P-values that we use here. Nevertheless, because of our use of the errors-in-variables model and the skewness of the NB distribution, there was no clear formulation to us of such a test. We did examine test statistics based on differences and log ratios and none were as powerful as the one described here. This method is suitable for any number of replicates (including as few as one) after making the requisite adjustments to (10) and (11).
2.7 Simulations to assess size and power
We performed simulations to evaluate the size and power of the Babel framework that assumed the NB-regression-NB model was correct. The parameters used for all simulations were those inferred from the second replicate of the control (DMSO) experiment in Hsieh et al. (Hsieh et al., 2012). Specifically, for each set of parameters, we generated 100 datasets with two replicates in each of three conditions. Using 10 582 expressed genes, for every replicate and condition we simulated mRNA levels from a NB distribution with mean according to the observed mRNA abundances and over-dispersion estimated from the Hsieh et al. data. From these simulated mRNA levels, we further simulated expected ribosome levels from a NB distribution with mean and over-dispersion again estimated from the Hsieh et al. data, where the former was the product of the regression value and the simulated mRNA levels. To evaluate power in these simulations, we increased or decreased the ribosome levels (as RPF counts) 2-, 3- and 4-fold for the same 50 genes in each simulation. We increased or decreased genes either in the bottom 5%, the middle 90% or the top 5% of mRNA abundance to examine whether the procedure behaved differently at varying mRNA levels. These genes were altered for only one of the three conditions. Once the data were generated, our standard procedure for fitting and P-value estimation was used (as described previously) and altered genes were identified based on two-sided tests.
2.8 Comparisons with published gene sets
A strict comparison was made between published results and the mRNAs identified as translationally regulated by Babel. In total, 144 mRNAs were previously reported as being reduced translationally in PC3 cells upon PP242 inhibition, as determined by a threshold of translational efficiency (Hsieh et al., 2012). Translational efficiency was defined previously as the difference in the log ratio of ribosome occupancy to mRNA level between treated and untreated cells. Owing to differences in the gene sets used (UCSC Known Gene versus Gencode version 11), 30 genes could not be mapped to a Gencode record of level 1–2 of support and, therefore, a comparison based on 114 genes was made. For all presumptive false negatives in the present analysis, manual inspection of read alignments across the UCSC canonical form and Gencode gene models (including a General Transfer Format (GTF) file of all unified models used here) was undertaken with the Integrative Genomics Viewer (http://www.broadinstitute.org/igv/) to confirm coding sequence differences.
3 RESULTS
3.1 Operating characteristics of Babel
To determine the operating characteristics of Babel, we performed simulations from our errors-in-variables doubly NB regression model. We assessed the type I error rate and the power both within and between conditions by varying the number of replicates; significance and mRNA expression levels; and in the case of power, fold change. Both within and between conditions, Babel produced accurate nominal P-values in the tails for null data, that is, data for which there is no true difference for any gene. As an example, for α = 0.05 for both within and between conditions, 5.21 and 4.94% of genes were significant for two replicates, respectively (Supplementary Table S1; Fig. 3A).
Fig. 3.
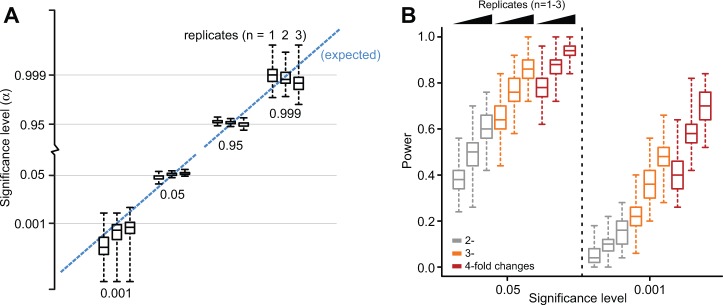
Characterizing Babel performance. (A) The proportion of P-values below the given cutoffs as a function of the number of replicates for simulated data in which there are no translationally regulated genes. Results across simulated datasets indicate the type I error rates in Babel are as expected. (B) The power of the Babel framework for detecting translationally regulated genes (2–4-fold increase in ribosome association) as a function of the number of replicates at significance levels of 0.05 and 0.001 among genes in the middle 90% of the distribution of mRNA abundance
We also evaluated the power of Babel by altering 50 genes at multiple levels of mRNA expression, increasing or decreasing the ribosome association between 2- and 4-fold. Within a given condition, Babel had similar power for increases and decreases across different levels of the mRNA distribution, except for the expected reduction in power for identifying decreases of any magnitude in ribosome association at low levels of mRNA expression. At α = 0.05, mRNAs with a 4-fold increase or decrease in ribosome association in two replicates were identified 87.4 and 92% of the time, respectively, in the middle 90% of the mRNA abundance distribution (Fig. 3B, see Supplementary Table S2). As expected, increasing either the fold change of ribosome-given-mRNA levels or the number of replicates increased the power in all cases. For testing between conditions, additional replicates are needed to achieve similar power to the within test. For the aforementioned parameters (4-fold increases among middle 90% mRNA levels at α = 0.05), 73% of increased genes were identified (as compared with the 87.4% described previously). Nevertheless, the power increases to 88% with the addition of a third replicate, emphasizing the need for proper study design when considering a multifaceted analysis of changes both within and between conditions. Finally, we confirmed that increasing the fold change or the mRNA level always increased the power in Babel and that for fixed levels of both, there was more power to detect genes with increased translation than those with decreased translation.
3.2 Reassessing mRNA translation downstream of mTOR signaling
To assess the performance of Babel, we analyzed translational control downstream of mTOR signaling (Supplementary Fig. S1). Ribosome profiling was previously performed on the PC3 prostate cancer cell line upon perturbation with one of two pharmacological inhibitors of mTOR: either the allosteric inhibitor rapamycin or the stringent adenosine triphosphate (ATP) site inhibitor PP242 (Hsieh et al., 2012). Each experiment was performed in duplicate as a biological replicate, and control experiments were performed with DMSO.
The original analysis identified 144 mRNAs that were decreased selectively in ribosome association upon PP242 inhibitor treatment. Of these, 114 were analyzed here (because of differences among gene definitions; see Methods). Notably, at α = 0.05, Babel analysis identified 90 of these 114 genes from the original analysis (79%; P-value ∼ 0, McNemar’s test), indicating strong concordance (Fig. 4A). These included a large number of the components of the translation machinery and a functionally validated pro-invasion gene signature, both consistent with upstream inhibition of mTOR signaling (Hsieh et al., 2012). Among 24 presumptive false negatives, those identified by the previous study but not significant in Babel, some had high variability between replicates (Supplementary Fig. S2), whereas others varied because of differences in the gene models used by the two analyses (see Methods).
Fig. 4.

Analysis of mTOR inhibition. (A) The relationship between Babel-produced q-values for genes after mTOR inhibition with the adenosine triphosphate site inhibitor PP242 compared with the absolute value of translational efficiency as previously calculated (Hsieh et al., 2012). The rank of genes identified by Babel or by the original study is shown (inset), ranked by Babel significance. (B) Babel analysis of mTORC1 inhibition with PP242 identified several genes encoding distinct subunits of the eIF3 complex as selectively inhibited at the translational level, a signature that was absent upon rapamycin treatment or among the other eIF complexes. The eIF3 complex bound to the 40S ribosome is represented schematically [inset; inferred from references Masutani et al. (2007); Siridechadilok et al. (2005); Zhou et al. (2008)] with subunits colored as a function of the significance of their translational repression upon mTOR inhibition (as indicated)
Notably, at a q-value cutoff of 0.25, Babel analysis identified 163 genes with a significant increase or decrease in ribosome association upon robust mTOR inhibition with PP242. Of those, 100 were not previously observed (Supplementary Table S3). Although many of these new findings were attributable to the broader range of mRNA expression Babel uses to credential genes for analysis, others revealed specific facets of mTOR regulation of translational control. Babel appeared particularly effective at identifying networks of functionally related genes. One such inter-connected module was comprised of multiple Rab family Ras-related GTPases involved in endocytosis. Although both the original study and Babel identified PP242-inhibitor related translational regulation of RABGGTC, a Rab geranylgeranyl-transferase, Babel also identified RAB3A and RAB13, indicating mTOR signaling may play a role in the translational regulation of multiple molecular components of endocytic trafficking.
Among core functional modules, Babel analysis identified five subunits of the eukaryotic initiation factor 3 (eIF3) that were significantly reduced in ribosome association upon mTOR-kinase inhibition (Supplementary Table S4). Although two non-conserved subunits eIF3l and eIF3h were identified previously (Hsieh et al., 2012; Thoreen et al., 2012), we found three additional components that had lower than expected ribosome-given-mRNA levels upon mTOR inhibition with PP242 that were absent upon rapamycin treatment, an effect that was eIF3-specific (Fig. 4B). Although the precise biochemical functions of eIF3 remains to be determined, it is known that eIF3 interacts with eIF4G to mediate the assembly of the 43 S ribosome on individual mRNAs and its depletion reduces translation. Notably, all of the translationally repressed subunits, both conserved and non-conserved, have a direct physical interaction (Fig. 4B, inset), four of which (eIF3a, f, h and e) are also constituents of the functional core essential for eIF3 complex formation (Masutani et al., 2007; Siridechadilok et al., 2005; Zhou et al., 2008). These findings support a direct contribution of eIF3 loss to PP242, but not rapamycin-mediated inhibition of translation. Additionally, subunits dispensable for active eIF3 complex formation(Masutani et al., 2007) (eIF3l) were also translationally repressed, indicating a regulatory function may exist beyond complex formation that is controlled at the translational level rather than at the transcriptional level in response to upstream mTOR signals. Together, these results demonstrate eIF3 may be a key downstream effector of mTOR–kinase-mediated inhibition of translation.
4 DISCUSSION
The ability to draw statistically principled inferences about translationally regulated genes from ribosome profiling is necessary for the discovery of specific mechanisms of, and abnormalities in, translational control in diverse cellular systems. Here, we introduce the Babel framework for performing just such an analysis. Babel produces a natural and readily interpretable summary (P-value) of the level of ribosome-given-mRNA for individual genes within samples and between conditions. On simulated data, we demonstrated that Babel has proper type I error both within and between conditions and possesses good power that increases with sample and effect size, emphasizing the need for careful design of ribosome profiling experiments. A reanalysis of ribosome profiling in response to multifaceted mTOR inhibition both confirmed prior findings, and importantly, extended them to identify novel functional modules subject to translational control in prostate cancer cells.
Among the greatest strengths of Babel is model flexibility. As more is learned about the layers of overt post-transcriptional regulation that impact ribosome occupancy and may uncouple the abundance of a transcript from its level of active translation, quantitative measures of these underlying processes can be incorporated as covariates to improve the accuracy of the model. Babel also introduces a new approach for combining P-values across independent tests in this context that has applicability far beyond the analysis of ribosome profiling. Nevertheless, challenges remain. Our simulations and experience indicate that modeling RPFs for genes with low mRNA abundance (and, therefore, low RPFs) can produce inaccurate P-values based on what may be small stochastic fluctuations in read counts between samples (see Supplementary Note). Although beyond the scope of this work, improving this will require a joint estimate of RPF and mRNA counts sufficient to produce accurate P-values from the bootstrap in the left tail of the mRNA distribution. Furthermore, additional improvements to the ribosome profiling protocol are necessary to extend these analyses to isoform-specific translational patterns.
Despite these challenges, Babel establishes a statistical framework for inferring changes in translational regulation of cellular mRNAs. In conjunction with ribosome profiling, the Babel framework will help bridge the gap in our understanding of the translational control of normal and pathogenic phenotypes.
Funding: Prostate Cancer Foundation (PCF) Young Investigator Awards (to A.C.H. and B.S.T.); Burroughs Wellcome Fund Career Award for Medical Scientists (to A.C.H.); David H. Koch Foundation (to B.S.T.); National Institutes of Health [4R37EB002784-35 to R.A.O.; F32CA162634 to C.R.S.; 1K08CA175154-01 to A.C.H.; P30 CA82103 to A.B.O.; R01CA154916 and R01CA140456 to D.R.]; A.C.H. is a postdoctoral fellow of the American Cancer Society. D.R. is a Leukemia and Lymphoma Society Scholar.
Conflict of Interest: none declared.
Supplementary Material
REFERENCES
- Bazzini AA, et al. Ribosome profiling shows that miR-430 reduces translation before causing mRNA decay in zebrafish. Science. 2012;336:233–237. doi: 10.1126/science.1215704. [DOI] [PMC free article] [PubMed] [Google Scholar]
- Edgington ES. An additive method for combining probability values from independent experiments. J. Psychol. 1972;80:351–363. [Google Scholar]
- Guo H, et al. Mammalian microRNAs predominantly act to decrease target mRNA levels. Nature. 2010;466:835–840. doi: 10.1038/nature09267. [DOI] [PMC free article] [PubMed] [Google Scholar]
- Hall P. The distribution of means for samples of size n drawn from a population in which the variate takes values between 0 and 1, all such values being equally probable. Biometrika. 1927;19:240–245. [Google Scholar]
- Harrow J, et al. GENCODE: producing a reference annotation for ENCODE. Genome Biol. 2006;7(Suppl. 1) doi: 10.1186/gb-2006-7-s1-s4. S4.1–S4.9. [DOI] [PMC free article] [PubMed] [Google Scholar]
- Hsieh AC, et al. The translational landscape of mTOR signalling steers cancer initiation and metastasis. Nature. 2012;485:55–61. doi: 10.1038/nature10912. [DOI] [PMC free article] [PubMed] [Google Scholar]
- Ingolia NT, et al. Genome-wide analysis in vivo of translation with nucleotide resolution using ribosome profiling. Science. 2009;324:218–223. doi: 10.1126/science.1168978. [DOI] [PMC free article] [PubMed] [Google Scholar]
- Ingolia NT, et al. Ribosome profiling of mouse embryonic stem cells reveals the complexity and dynamics of mammalian proteomes. Cell. 2011;147:789–802. doi: 10.1016/j.cell.2011.10.002. [DOI] [PMC free article] [PubMed] [Google Scholar]
- Irwin JO. On the frequency distribution of the means of samples from a population having any law of frequency with finite moments, with special reference to Pearson's Type II. Biometrika. 1927;19:225–239. [Google Scholar]
- Li H, Durbin R. Fast and accurate short read alignment with Burrows-wheeler transform. Bioinformatics. 2009;25:1754–1760. doi: 10.1093/bioinformatics/btp324. [DOI] [PMC free article] [PubMed] [Google Scholar]
- Li H, et al. The sequence Alignment/Map format and SAMtools. Bioinformatics. 2009;25:2078–2079. doi: 10.1093/bioinformatics/btp352. [DOI] [PMC free article] [PubMed] [Google Scholar]
- Masutani M, et al. Reconstitution reveals the functional core of mammalian eIF3. EMBO J. 2007;26:3373–3383. doi: 10.1038/sj.emboj.7601765. [DOI] [PMC free article] [PubMed] [Google Scholar]
- Robinson MD, Oshlack A. A scaling normalization method for differential expression analysis of RNA-seq data. Genome Biol. 2010;11:R25. doi: 10.1186/gb-2010-11-3-r25. [DOI] [PMC free article] [PubMed] [Google Scholar]
- Robinson MD, Smyth GK. Small-sample estimation of negative binomial dispersion, with applications to SAGE data. Biostatistics. 2008;9:321–332. doi: 10.1093/biostatistics/kxm030. [DOI] [PubMed] [Google Scholar]
- Robinson MD, et al. edgeR: a Bioconductor package for differential expression analysis of digital gene expression data. Bioinformatics. 2010;26:139–140. doi: 10.1093/bioinformatics/btp616. [DOI] [PMC free article] [PubMed] [Google Scholar]
- Siridechadilok B, et al. Structural roles for human translation factor eIF3 in initiation of protein synthesis. Science. 2005;310:1513–1515. doi: 10.1126/science.1118977. [DOI] [PubMed] [Google Scholar]
- Smyth GK. Linear models and empirical bayes methods for assessing differential expression in microarray experiments. Stat. Appl. Genet. Mol. Biol. 2004;3 doi: 10.2202/1544-6115.1027. Article3. [DOI] [PubMed] [Google Scholar]
- Storey JD. A direct approach to false discovery rates. J. R. Statist. Soc. B. 2002;64:479–498. [Google Scholar]
- Thoreen CC, et al. A unifying model for mTORC1-mediated regulation of mRNA translation. Nature. 2012;485:109–113. doi: 10.1038/nature11083. [DOI] [PMC free article] [PubMed] [Google Scholar]
- Trapnell C, et al. TopHat: discovering splice junctions with RNA-Seq. Bioinformatics. 2009;25:1105–1111. doi: 10.1093/bioinformatics/btp120. [DOI] [PMC free article] [PubMed] [Google Scholar]
- Zhou M, et al. Mass spectrometry reveals modularity and a complete subunit interaction map of the eukaryotic translation factor eIF3. Proc. Natl Acad. Sci. USA. 2008;105:18139–18144. doi: 10.1073/pnas.0801313105. [DOI] [PMC free article] [PubMed] [Google Scholar]
Associated Data
This section collects any data citations, data availability statements, or supplementary materials included in this article.