

Abstract
The microsecond folder λ6-85 is a small (9.2 kDa = 9200 amu) five helix bundle protein. We investigated the stability of λ6-85 in two different low-fluorescence crowding matrices: the large 70 kDa carbohydrate Ficoll 70, and the small 14 kDa thermophilic protein SubL. The same thermal stability of secondary structure was measured by circular dichroism in aqueous buffer, and at a crowding fraction ϕ=15±1% of Ficoll 70. Tryptophan fluorescence detection (probing a tertiary contact) yielded the same thermal stability in Ficoll, but 4 °C lower in aqueous buffer. Temperature-jump kinetics revealed that the relaxation rate, corrected for bulk viscosity, was very similar in Ficoll and in aqueous buffer. Thus viscosity, hydrodynamics and crowding seem to compensate one another. However, a new fast phase was observed in Ficoll, attributed to a lower activation barrier and downhill folding. We also measured the stability of λ6-85 in ϕ=14±1% SubL, which acts as a smaller more rigid crowder. Significantly greater stabilization (7 to 13 °C depending on probe) was observed than in the Ficoll matrix. The results highlight the importance of crowding agent choice for studies of small, fast-folding proteins amenable to comparison with molecular dynamics simulations.
1. Introduction
Unimolecular reactions of small molecules in the aqueous phase usually have a fairly straightforward dependence on solvent condition, given by Kramers’ model.1 What about large unimolecular reactants, such as a protein folding to its native state? When large proteins are crowded in aqueous solution by other large molecules (e.g. high molecular weight carbohydrates), interesting things can happen. For example, the reaction can speed up upon crowding, even though the viscosity increases2 (and the reaction is not in the Kramers anomalous regime). But when is a protein really a ‘large’ molecule? In recent years, the fast folding kinetics of many ‘small’ (20–100 amino acid) proteins has been studied, and the results now can be compared directly with full atom molecular dynamics simulations.3 Until now, the folding kinetics of such ‘small’ proteins has not been examined in crowding environments.
When proteins fold, they traverse an energy landscape that can be characterized overall by two parameters: its energetic bias towards the native state, and its energy roughness.4 If we perform the Legendre transform from energy to free energy (relevant in the laboratory where temperature, not entropy, is the adjustable parameter) a continuous range of scenarios emerges. At one extreme, if the bias is weak and the roughness is large, folding intermediates accumulate. This is the likely scenario for large proteins with many opportunities for non-native contacts. Work on smaller proteins has demonstrated that folding intermediates are not obligatory for folding: small proteins usually fold over a single barrier,5 analogous to most chemical reactions.6 Going even further to the other extreme, the native bias can become so large, and the roughness so small that some small proteins fold without any significant barrier at all, analogous to many ion-molecule, excited electronic state, or radical reactions.7 Extensive experimental and computational evidence for downhill folding in solution has been accumulated in recent years.8–24
Downhill folding can be detected thermodynamically:9 When there is a substantial barrier to heat-induced unfolding, a single melting (unfolding) temperature Tm is obtained by all spectroscopic probes. Without such a barrier, tuning the temperature yields different Tm for different probes.9, 15, 19 Downhill folding can also be detected dynamically (Figure 1A): When there is a substantial barrier, a single activated rate coefficient ka for folding is measured. Upon lowering the barrier, ka at first simply increases; but when the population diffusing through the transition state reaches a detectable size, the rate coefficient becomes time-dependent at short times.11 In this limit, reaction kinetics becomes reaction dynamics. The time it takes for the rate coefficient to settle into a constant plateau value ka is termed ‘molecular rate’ or .6 It can be measured to extract absolute folding barriers ΔG† directly from experiment:11
Figure 1.
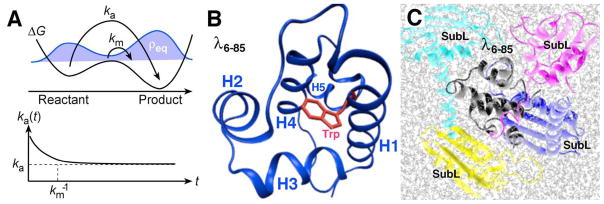
(A) Connection between kinetics and dynamics. If the unimolecular activation barrier is very low (middle of ΔG curve), a measurable activated population exists (middle of the shaded equilibrium population ρeq). This population reacts by direct diffusion with a rate km≫ka. Thus the rate coefficient ka(t) does not immediately settle into a constant value ka: the usual unimolecular concentration change ~exp[-kat] is preceded by a short ‘burst’ of very fast reaction, allowing a direct independent measurement of the prefactor km in the equation ka=kmexp[−ΔG†/RT] for the activated rate coefficient ka. The size of the short burst is proportional to the activated population, and becomes unobservable when the activation barrier is very high. (B) Monomer of lambda repressor fragment 6–85 showing the tryptophan fluorescence probe as a stick structure, and helices 1 through 5 as ribbon structures. (C) Model of λ6-85 in 200 mg/ml SubL, to indicate the nature of the crowding effect. Water molecules are shown as small gray sticks. Plots were created using the free visualization software VMD.61
| [1] |
Because of large protein size and solvent viscosity, km is much greater for proteins (typically > 100 ns) than for small molecule reactions (typically < 1 ps).
Very recently, single trajectory molecular dynamics simulations on the Anton supercomputer have confirmed downhill folding of small proteins in solution computationally via observation of repeated folding and unfolding events.3 Sampling was sufficient to compute one dimensional potentials of mean force (PMFs, coordinate-dependent free energies) using Hummer’s coordinate reduction method.25 For example, Anton simulations and thermodynamic experiments agree that a certain protein BBL mutant has a negligible activation barrier even at Tm.3, 13 For the largest protein folded by a single trajectory to date (Figure 1B), a mutant of the 5 helix bundle λ6-85, experiment yielded an absolute barrier of ≈4kJ/mole at 65 °C,11 and a melting point range of Tm = 68 °C (fluorescence detection) to 73.5 °C (circular dichroism detection). The Anton simulation yielded an identical barrier height of ≈4kJ/mole at 77 °C. There is good reason to believe that globular protein domains (usually < 200 amino acids) will be foldable in solution routinely by single trajectory,26 multi-trajectory27 or replica21 molecular dynamics techniques to Ångstrom accuracy within a decade, as calibration against experiments further improves the accuracy of empirical force fields, yielding better stabilities, kinetic mechanisms, and structures.28
As a result, experimental work to study protein folding in more realistic environments has accelerated during the past several years. Proteins are now studied on the ribosome,29, 30 in densely packed crowding agents,31–37 and even in living cells directly.38, 39 Significant changes of protein stability and folding kinetics are expected in such complex environments, based on the aqueous solution results outlined above: free energy barriers and stabilities of proteins are small (10s of kJ/mole), and thus easily modulated by interactions of the protein with its solvation environment. For technical reasons, crowding studies have focused on large proteins so far; no experimental results are available for small sub-millisecond folders suitable for all atom simulation, the closest being the small heme protein cytochrome c that folds in under a second.40
Here we study λ6-85, already discussed above, in two very different crowding environments: Ficoll 70, a 70 kDa semi-rigid cross-linked carbohydrate that acts as a roughly spherical crowder in aqueous solution; and SubL, a 14 kDa thermophilic protein that serves as a smaller and more rigid crowder than the commonly used large molecular weight carbohydrates (Figure 1C). We find that the stability of λ6-85 in Ficoll deviates only little from aqueous solution. A small probe dependence of the melting temperature in aqueous buffer (circular dichroism vs. fluorescence) disappears in Ficoll. T-jump kinetics of λ6-85 in Ficoll likewise reveals similar rates in Ficoll as in aqueous buffer, although a molecular phase ‘burst’ precedes the activated unimolecular kinetics in Ficoll 70. To enhance crowding effects, we propose the new protein crowder SubL.41 It is smaller and more rigid than Ficoll, thermophilic (Tm > 90 °C), and has very low fluorescence, making it an ideal match for crowding small, fast-folding proteins such as λ6-85 by fluorescence techniques. We find that SubL has a larger effect on λ6-85 stability at volume fractions comparable to those for Ficoll. We conclude that SubL matrices provide a better size match and more rigid crowding environment for small, fast folding proteins such as lambda repressor fragments.
2. Methods
2.1 Sample preparation
The fluorescent lambda repressor fragment and its Glu33Tyr/Ala37,49Gly mutant were expressed and purified as described previously.42 A tyrosine 22 to tryptophan mutation makes both proteins strongly fluorescent when excited at 290 nm.43 YG tryptophan fluorescence monitors a specific Trp22-Tyr33 tertiary interaction23 whose thermodynamics and kinetics we studied in Ficoll, while has a strongly decreasing fluorescence upon unfolding, ideally suited for studies in the slightly fluorescent SubL crowder.
A pET-19b plasmid containing the gene for protein SubL from the thermophile Methanococcus jannashii (obtained from Prof. Gary Olsen) was transformed and expressed in BL21(DE3) Rosetta cells. Protein was harvested by French Press and purified by heating to 62 °C to precipitate non-thermophilic cell lysate, followed by column chromatography. The chromatography protocol consisted of Ni-NTA affinity purification followed by size exclusion purification and a second Ni-NTA affinity purification. The His purification tag was not removed and the resulting protein had a mass of 14028 Da. Purified protein was dialyzed against double deionized water and checked for purity by MALDI and ESI mass spectrometry prior to lyophilization.
YG crowded by Ficoll 70 was prepared by mixing concentrated protein buffers with carbohydrate buffers (50 mM NaH2PO4, pH 7.0). Volume fractions in the range 15±1% Ficoll (240 mg/ml44) were used. samples crowded by SubL were prepared by adding lyophilized protein to 2 mL of buffer (300 mM NaCl, 50 mM NaH2PO4, pH 7.0), and then concentrating 4 times in <200 mTorr vacuum overnight. The buffer had no effect on SubL stability below 90 °C. A crowding fraction of ϕ=14±1% SubL (220 mg/ml) was used for SubL. These crowding fractions avoided precipitation of the protein in the matrices.
Final concentration of lambda repressor in the matrices were determined using UV/Visible absorption at 280 nm and an extinction coefficient of 1750 M−1cm−1 for SubL, 6970 M−1cm−1 for λ6–85 mutants and ≈0 for Ficoll. The lambda repressor concentrations in the matrix were kept at least 10 times lower than the matrix concentration to avoid strong interaction of lambda repressor with itself.
2.2 Circular dichroism and fluorescence measurements
Samples were overlaid with mineral oil to prevent evaporation. Larger temperature steps and minimal collection time for acceptable signal-to-noise ratio were used to reduce sample denaturation at higher temperatures.
Fluorescence spectra of lambda repressor, in aqueous buffer, crowded by Ficoll, or crowded by SubL, were measured as a function of temperature using a Varian (Palo Alto, CA) Cary Eclipse spectrofluorimeter with a 4-position Peltier multicell changer and a PCB-150 circulating water bath. Emission spectra were obtained from 300 to 400 nm upon 290 nm excitation of the tryptophan 22 residue, using slit widths of 5 nm for both emission and excitation monochromators to maximize signal. Temperature titrations were performed using a nitrogen purge of the sample chamber and the temperature probe placed directly in the buffer blank cuvette.
For Ficoll crowding only, it was also possible to measure circular dichroism spectra and melts of lambda repressor on a JASCO J-715 spectropolarimeter equipped with a Peltuer temperature controller. We simultaneously collected total fluorescence intensity (320–450 nm) during hose scans. No CD melts could be obtained for lambda repressor in the SubL matrix because SubL itself has a large CD spectrum and is at much higher concentration than the probe protein.
CD thermal melts dilute SubL solutions, to measure its stability, were obtained on a JASCO J-715 spectropolarimeter. The samples were 5 μM SubL in 2 M GuHCl denaturant at pH 4.5, and 264 mg/ml SubL in 2 M NaCl, 200 mM NaH2PO4 buffer at pH 7.
Integrated fluorescence and CD data were normalized and plotted as a function of temperature. We used a simple cooperative thermodynamic model to obtain Tm by fitting fluorescence and CD intensities. Table 1 summarizes the results of the model fits. The cooperative model is
| [2] |
In this expression, [N] and [D] are the native and denatured concentrations as detected by either intensity or wavelength shift, Keq is the folding equilibrium constant, ΔG(T) is the folding free energy as a function of temperature. We approximate it here by a just the linear Taylor series expansion, which was sufficient to fit all the data: C(1) measures how quickly the population switches from native to denatured state at Tm. (A heat capacity-based model from ref. 45 provides equally satisfactory fits.)
2.3 Temperature-jump kinetics in Ficoll
We measured T-jump kinetics of YG crowded by Ficoll 70 under the same buffer conditions used to measure stability. The experiment has been described in detail before.46 Briefly, a train of 280 nm UV pulses from a frequency-tripled, mode-locked Ti:S laser is used to excite the sample tryptophan fluorescence in a 0.025 diameter by 0.4 mm long sample region every 12.5 ns. A 10 °C T-jump is then induced in the sample by a Raman-shifted (1.9 μm) Nd:YAG laser collimated at the sample to a ~ 1 mm diameter spot. The change in tryptophan fluorescence lifetime is recorded as folding kinetics progress, and plotted as “χ” normalized from 1 (just after the jump) to 0 (500 μs after the jump). YG relaxes in ca. 50 μs, significantly slower than the <5 μs relaxation rates observed for the fastest downhill-folding mutants of lambda repressor.15, 23 Thus we use the two-state approximation ka ≈ kobsKeq/(1+Keq) to determine the activated folding rate coefficient from the observed rate coefficient kobs and folding equilibrium constant Keq (determined from fluorescence measurements in 2.2). The molecular phase km (downhill folding) and activated phase ka have been discussed extensively elsewhere,11, 15, 23, 47 and here we plot only ka to see if the crowder has an effect on the small folding barrier.
To correct folding rates for bulk solvent viscosity, we measured the viscosity of Ficoll solutions with a Bohlin Instruments High Resolution C-VOR Torque Rebalance in viscometry mode, using a double gap couette cell, steel solvent trap and a Polyscience recirculating water bath. Measurements were performed at 20, 45, 48, 50, 53, 55, 58, 60 and 63°C, scaled to the known viscosities at 20 °C, and globally fitted with water (X=0)48 viscosities to yield the following model equations:
| [3a] |
| [3b] |
where T is in °C, X is in mg/ml (mass of crowder/total solution volume), and η is the viscosity in centiPoise units.
3. Results
3.1 Crowding effect of Ficoll 70 on λ6-85 stability
The 70 kDa carbohydrate polymer Ficoll 70 acts as a ≈5.1 nm Stokes radius semi-rigid crowding agent in aqueous solution. We studied the stability of YG (9.2 kDa, hydrated radius of gyration ca. 1.2 nm 49) in a Ficoll crowding matrix of volume fraction ϕ≈15–16% in phosphate buffer at pH 7. A Trp22-Tyr33 interaction acts as a probe of non-local tertiary contact formation in YG.23
The melting point obtained by circular dichroism (CD) is Tm=54±1 °C in Ficoll, identical within measurement uncertainty with Tm=55±1 °C in buffer, which agrees with the previous literature value of 54.5 °C.42 Furthermore, the cooperativity parameter C(1) from eq. [2] was 502±28 J mol−1 K−1 in Ficoll and 521±39 J mol−1 K−1 in buffer. Thus concentrations of over 200 mg/ml of Ficoll 70 have no appreciable effect on thermal stability of lambda repressor secondary structure compared to buffer. Ficoll does affect the shape of the CD spectrum, with more random coil signal (deeper peak at 208 nm relative to 222 nm 50) than in aqueous buffer (Figure 2A inset).
Figure 2.

Stability of Q33Y in aqueous buffer and Ficoll. Protein concentration was 7.1–7.2 μM for the protein in Ficoll, and 7.2 μM for protein in buffer (50 mM phosphate buffer at pH 7). Markers are measured, solid and dotted curves are fits to equation [2] (A) Circular dichroism-detected thermal melts with 240 mg/ml Ficoll and without Ficoll. The insets show the CD spectra at 4 temperatures, indicating more random coil structure in Ficoll (scale 0 top to −30,000 bottom MRE in ° cm2 dmol−1 residue−1). (B) Fluorescence intensity-detected thermal melt of Q33Y with 225 mg/ml Ficoll and in buffer (50 mM phosphate buffer at pH 7). The dashed lines are two of the four fitted baselines. Melting temperatures given in the text were extracted by fitting to eq. [2].
The fluorescence intensity probe reveals a larger difference between Ficoll crowding and aqueous buffer (Figure 2B): Tm remains 54±1 °C in ϕ=15% Ficoll, but it decreases to 49 °C in aqueous buffer. This difference between CD and fluorescence probes has been observed before for other lambda repressor fragment mutants,15, 51 and is a signature for deviations from two-state folding over a single barrier. Thus thermal stabilization of YG by 225–240 mg/ml Ficoll is in the range of −1 to 5 °C, depending on the probe.
We also carried out measurements in sucrose for reference, and obtained melting points of 54 and 51 °C by CD and fluorescence. Sucrose occupies an intermediate ground between aqueous buffer and Ficoll, also not strongly stabilizing YG relative to aqueous buffer.
3.2 Folding relaxation kinetics of λ6-85 in Ficoll 70
We investigated the folding kinetics of YG to see if a larger kinetic effect could be obtained. Temperature jump relaxation rates kobs were measured around Tm, between 47 and 60 °C final temperatures. Representative jumps to a final temperature of 54 °C are shown in Figure 3A in aqueous buffer, ϕ=15% sucrose and ϕ=15% Ficoll. An Arrhenius plot of the observed relaxation rate is shown in Figure 3B. The buffer, Ficoll, and sucrose reference data differ by less than 0.2 natural log units, or 20% of the rate.
Figure 3.

Temperature jump relaxation kinetics of Q33Y in aqueous buffer, sucrose and Ficoll. (A) 6±1 °C T-jumps of 83 μM protein to a final temperature of 54 °C. Data are shown as dots, fits to a double exponential (rate coefficients km and kobs = ka+ka/Keq) as black lines. The molecular phase km (rapid ‘burst’ of diffusing transition state population) tends to be larger in sucrose and Ficoll jumps. (B) Arrhenius plots of the fitted rate coefficients kobs, and of the viscosity-scaled activated folding rate ka as described in the text. No significant deviations between Ficoll and aqueous buffer (50 mM phosphate buffer at pH 7) are seen.
To compare folding rates further, we made the two-state approximation kobs≈ ka + ka/Keq = ka(Keq+1)/Keq and scaled the folding rate coefficient ka by η(T)−1. (We used the equilibrium constant Keq from the fluorescence data in 3.2 because fluorescence was used to detect the kinetics.) The result is shown in Figure 3B for an average over several data sets taken with ϕ=10–15% Ficoll vs. 0% (buffer). The estimated activated folding rates in buffer and Ficoll are virtually identical over the temperature range we covered. Ficoll neither greatly stabilizes YG, nor does it increase the folding rate significantly.
As seen in Figure 3A, sucrose and Ficoll have a very fast phase with rate coefficient km ≈ (2 μs)−1. A small fast phase is observed in sucrose, and a significantly larger one in Ficoll, even though the main folding rate coefficient ka does not speed up appreciably in sucrose and Ficoll. Such phases have been observed for downhill-folding lambda repressor mutants with experimental and calculated barriers < 7 kJ/mole.11, 15 The ‘burst’ with rate coefficient km is not observed for YG in aqueous buffer, in agreement with previous studies.47
3.3 High stability and low background fluorescence of SubL for crowding studies
With Ficoll having a relatively modest effect, we wanted to see if the crowding matrix/λ6-85 combination could be optimized to produce large signals and large Tm changes in a small, fast folder like lambda repressor fragment. A small protein could act as a more compact crowding agent, predicted to have a larger effect by excluded volume models.52 We chose as our matrix candidate the 14 kDa thermophilic protein SubL, the L subunit of an archaeal DNA repair protein.41 As the probe protein, we investigated , which has a fluorescence-detected thermal stability similar to YG, but a strongly decreasing fluorescence signal as it unfolds, easy to detect in a slightly fluorescent matrix.
To be suitable as a crowding agent for fluorescence-detected thermal melts, a protein must be easy to purify in large quantities, must be highly thermostable even at high concentration, and must fluoresce as little as possible (Figure 4). A thermal scan of SubL circular dichroism shows no evidence of unfolding at temperatures below 70 °C. The magnitude of the CD222 spectrum increases with temperature (Figure 4B), indicating more secondary structure at high temperature. Thus SubL has a much higher melting point than . Only a combination of 2 molar guanidine and pH 4.5 shows evidence of unfolding beginning below 70 °C. Heating above 70 °C is required before SubL or SubL-λ6-85 mixtures show strong scattering (milky solution) due to precipitation.
Figure 4.

Fluorescence and stability of SubL. (A) Peak SubL fluorescence is ca. 60 times smaller than peak fluorescence at the same concentration (normalized to 100 μM). (B) Thermophilic SubL at pH 7 shows no evidence of melting below 70 °C, as determined by circular dichroism Mean Residue Ellipticity (MRE in ° cm2 dmol−1residue−1). Only in acidic guanidinium solution was there any evidence of unfolding below 70 °C (at ca. 55 °C).
SubL fluorescence excited at 290 nm is approximately 60 times lower than tryptophan fluorescence from (Figure 4A). The small amount of residual fluorescence comes from two tyrosines, and decreases slowly with increasing temperature. Thus SubL contributes less than 14% background fluorescence in experiments with a 1:10 ratio of to crowder. SubL expresses in large quantities, and is easily purified by heating, whereupon only the thermophilic SubL remains in solution (see Methods).
3.4 Stabilization of λ6-85 by the SubL matrix
In buffer at pH 7, had a melting temperature of 50±1 °C detected by total fluorescence intensity (Figure 5). Fluorescence wavelength shift (Figure 5A) yielded a slightly lower temperature, 48.5±1.5 °C. Both of these are lower than the previously measured Tm detected by circular dichroism,42 indicating a deviation from a simple two-state equilibrium.
Figure 5.

(A) 12 mg/ml in 220 mg/ml SubL (left), and 12 mg/ml in buffer only (right) fluorescence spectra. Temperatures are (in order of decreasing intensity, ±1 °C absolute calibration): 10 to 80 °C, in 5 °C steps. The decrease of total fluorescence intensity, as well as the red-shift of the peak wavelength from the folded reference wavelength (vertical dashed line) can be seen clearly. (B) Integrated fluorescence intensity as a function of temperature, showing the melting transitions with and without the SubL crowding matrix.
We investigated the effect of crowding on the thermal stability of at matrix concentrations ϕ = 14% (≈220 mg/ml SubL), similar to the Ficoll concentrations in sections 3.1–3.2 (Figure 5B). Fluorescence spectra were obtained at 1 nm wavelength intervals and at 5 °C temperature intervals to minimize heating time and aggregation during thermal denaturation. The thermodynamic fit yielded Tm = 63±2 °C, which is 13 °C higher than the Tm = 50 °C measured in buffer. The cooperativity in SubL was not appreciably different from buffer, and was globally fitted to C(1) = 124±30 J mol−1 K−1. A similar analysis by wavelength shift (Figure 5A) yielded the same C(1) and a smaller change of Tm between buffer and matrix (7 °C), but still larger than obtained in Ficoll. We could not compare fluorescence and CD probes in SubL because of the large CD signal from the SubL crowding matrix.
4. Discussion
The stability of several proteins has been investigated in Ficoll or similar synthetic crowding matrices, notably apoflavodoxin,33, 37 VlSE,33 PGK44 and on the small size end, cytochrome c.40 The consensus is that synthetic crowders enhance the stability of relatively large proteins. Some proteinaceous crowding matrices, such as lysozyme, have been shown to destabilize probe proteins.36 Thus there is room for both excluded volume effects (stabilizing), and other effects (e.g. destabilizing electrostatics) of the crowding matrix.
Here we find that SubL acts as a strongly stabilizing matrix for the small protein , whereas the 5 times larger (by mass) Ficoll 70 acts only as a modest stabilizing agent at the same crowding fraction (ϕ=14–16%). It is thus possible for protein crowding matrices to stabilize probe proteins even more so than a synthetic crowding matrix. Indeed, experiments in live cells, where proteins are expected to be important crowding agents, have also shown that probe proteins are stabilized.39, 53
Simple models that emphasize excluded volume have been developed. 52, 54, 55 In these models, rigid globular crowders act by restricting the configurational entropy of the probe protein’s denatured ensemble. Thereby they destabilize the denatured state and speed up refolding except at the very highest crowder concentrations. Cheung and Thirumalai predict how Tm increases with crowder volume fraction ϕc, assuming a random coil denatured state:
| [4] |
The general trend is consistent with lysozyme in dextran matrices56 and PGK in Ficoll matrix,44 for example.
Of the two cases studied here, eq. [4] adequately describes the temperature shift observed for in the SubL matrix: we measure an average of 10 °C by two different fluorescence methods (intensity, wavelength), compared to eq. [4] predicting 8 °C for in 14% crowder. Of course, this agreement indicates only that excluded volume effects can account for the observed order of magnitude of the T change: in SubL has probe-dependent melting temperatures with a 6 °C range (indicating breakdown of the two-state assumption).
The predictions of simple crowding models generally break down for YG in Ficoll 70: Protein stability is enhanced by at most half the prediction of eq. [4], and the folding rate does not speed up at all. The most likely reason for the breakdown is the size difference between protein and crowding agent. Minton’s excluded volume models predict that crowding effects increase for smaller matrix constituents, as observed here for Ficoll vs. SubL.52 (Of course, this can hold only up to a point: if the carbohydrate crowder is made very small compared to the probe protein, e.g. sucrose compared to YG, it must act like a cosmotrope rather than a crowding agent.) Ficoll 70 may simply be too large to efficiently crowd YG. In addition, the highly hydrated, low density Ficoll molecule is likely to be softer and more penetrable than the dense (ca. 1.5 g/ml) SubL, further reducing its ability to conformationally restrict the dynamics of the small lambda repressor fragment unfolded state.
A model for Ficoll 70 crowding of YG must explain the following four observations: 1) secondary structure is not stabilized by crowding (CD data); 2) non-local tertiary contacts are stabilized slightly by crowding (Y33-W22 probe23); 3) the activated folding rate is not altered by crowding; 4) a new fast phase appears, so crowding favors downhill folding. The following hypothesis accounts for all of these: Ficoll 70 interstitial spaces have higher local viscosity than bulk water, and they are smaller than the length scale of tertiary interactions, but larger than the length scale of local secondary structure of lambda repressor fragemnt. If so, Ficoll 70 would stabilize tertiary structure more than secondary structure, and the unchanged activated rate results from a cancellation of higher local viscosity and a lower activation barrier; the lower barrier in turn causes the appearance of the fast molecular phase km and downhill folding. There is experimental and computational precedent showing that increased local viscosity reduces folding rates. Mukherjee et al. previously showed that crowding of small model peptides by Ficoll 70 can cause a slow-down of secondary structure formation.57 In live cells, the local viscosity for folding has been shown to increase by a factor of 2 from aqueous solution,58 so compensation of a lower barrier by higher viscosity is plausible. Ando and Skolnick calculated that local viscosity variations can result from hydrodynamics, as the drag of aqueous layers flowing past multiple macromolecules changes the local viscosity from the bulk value.59
In view of our results, it will be very interesting to develop improved theoretical and computational models for crowders of small fast-folding proteins. Such models should include crowder flexibility, local viscosity, hydrodynamic and electrostatic effects on the probe protein, in addition to the excluded volume effect. Small proteins like are ideal probes for crowding studies because they can be modeled at atomistic detail with currently available molecular dynamics technology. Computational efforts for small model proteins with rigid crowers are already underway.40, 60 On the experimental side, it will be useful to provide systematic folding kinetics data for fast-folding small probe proteins in different crowding environments. For example, a series of mutants in Ficoll or SubL could pin down how protein stability, denatured state compactness, and other properties that can be varied by mutation, affect the ability of the matrix to crowd the probe protein.
Acknowledgments
This work was supported by US National Science Foundation grant MCB 1019958. S. D. wishes to thank the NSF for support by a GK-12 Fellowship while this research was carried out.
References
- 1.Kramers HA. Physica. 1940;7:284. [Google Scholar]
- 2.Homouz D, Perham M, Samiotakis A, Cheung MS, Wittung-Stafshede P. Proc Nat Acad Sci USA. 2008;105:11754–11759. doi: 10.1073/pnas.0803672105. [DOI] [PMC free article] [PubMed] [Google Scholar]
- 3.Lindorff-Larsen K, Piana S, Dror RO, Shaw DE. Science. 2011;334:517–520. doi: 10.1126/science.1208351. [DOI] [PubMed] [Google Scholar]
- 4.Onuchic JN, Wolynes PG, Luthey-Schulten Z, Socci ND. Proc Natl Acad Sci USA. 1995;92:3626–3630. doi: 10.1073/pnas.92.8.3626. [DOI] [PMC free article] [PubMed] [Google Scholar]
- 5.Jackson SE, Fersht AR. Biochemistry. 1991;30:10428–10435. doi: 10.1021/bi00107a010. [DOI] [PubMed] [Google Scholar]
- 6.Chandler D. J Chem Phys. 1978;68:2959–2970. [Google Scholar]
- 7.Sims IR, Smith IWM. Ann Rev Phys Chem. 1995;46:109–137. doi: 10.1146/annurev.pc.46.100195.000545. [DOI] [PubMed] [Google Scholar]
- 8.Sabelko J, Ervin J, Gruebele M. Proc Nat Acad Sci USA. 1999;96:6031–6036. doi: 10.1073/pnas.96.11.6031. [DOI] [PMC free article] [PubMed] [Google Scholar]
- 9.Garcia-Mira M, Sadqi M, Fischer N, Sanchez-Ruiz JM, Muñoz V. Science. 2002;298:2191–2195. doi: 10.1126/science.1077809. [DOI] [PubMed] [Google Scholar]
- 10.Cavalli A, Haberthur U, Paci E, Caflisch A. Protein Science. 2003;12:1801–1803. doi: 10.1110/ps.0366103. [DOI] [PMC free article] [PubMed] [Google Scholar]
- 11.Yang WY, Gruebele M. Nature. 2003;423:193–197. doi: 10.1038/nature01609. [DOI] [PubMed] [Google Scholar]
- 12.Ma H, Gruebele M. Proc Nat Acad Sci USA. 2005;102:2283–2287. doi: 10.1073/pnas.0409270102. [DOI] [PMC free article] [PubMed] [Google Scholar]
- 13.Sadqi M, Fushman D, Munoz V. Nature. 2006;442:317–321. doi: 10.1038/nature04859. [DOI] [PubMed] [Google Scholar]
- 14.Dyer RB. Current Opinion in Structural Biology. 2007;17:38–47. doi: 10.1016/j.sbi.2007.01.001. [DOI] [PubMed] [Google Scholar]
- 15.Liu F, Gruebele M. J Mol Biol. 2007;370:574–584. doi: 10.1016/j.jmb.2007.04.036. [DOI] [PubMed] [Google Scholar]
- 16.Fung A, Li P, Godoy-Ruiz R, Sanchez-Ruiz JM, Munoz V. J Am Chem Soc. 2008;130:7489–7495. doi: 10.1021/ja801401a. [DOI] [PubMed] [Google Scholar]
- 17.Naganathan AN, Munoz V. Biochemistry. 2008;47:6752–6761. doi: 10.1021/bi800336x. [DOI] [PubMed] [Google Scholar]
- 18.Cho SS, Weinkam P, Wolynes PG. Proc Nat Acad Sci USA. 2008;105:118–123. doi: 10.1073/pnas.0709376104. [DOI] [PMC free article] [PubMed] [Google Scholar]
- 19.Godoy-Ruiz R, Henry ER, Kubelka J, Hofrichter J, Munoz V, Sanchez-Ruiz JM, Eaton WA. J Phys Chem B. 2008;112:5938–5949. doi: 10.1021/jp0757715. [DOI] [PubMed] [Google Scholar]
- 20.Liu F, Du D, Fuller AA, Davoren J, Wipf P, Kelly J, Gruebele M. Proc Nat Acad Sci USA. 2008;105:2369–2374. doi: 10.1073/pnas.0711908105. [DOI] [PMC free article] [PubMed] [Google Scholar]
- 21.Pitera JW, Swope WC, Abraham FF. Biophys J. 2008;94:4837–4846. doi: 10.1529/biophysj.107.123265. [DOI] [PMC free article] [PubMed] [Google Scholar]
- 22.DeCamp SJ, Naganathan AN, Waldauer SA, Bakajin O, Lapidus LJ. Biophysical Journal. 2009;97:1772–1777. doi: 10.1016/j.bpj.2009.07.003. [DOI] [PMC free article] [PubMed] [Google Scholar]
- 23.Liu F, Gao YG, Gruebele M. J Mol Biol. 2009;397:789–798. doi: 10.1016/j.jmb.2010.01.071. [DOI] [PMC free article] [PubMed] [Google Scholar]
- 24.Dumont C, Emilsson T, Gruebele M. Nature Methods. 2009;6:515–519. doi: 10.1038/nmeth.1336. [DOI] [PubMed] [Google Scholar]
- 25.Best RB, Hummer G. Proc Nat Acad Sci USA. 2005;102:6732–6737. doi: 10.1073/pnas.0408098102. [DOI] [PMC free article] [PubMed] [Google Scholar]
- 26.Shaw DE, Maragakis P, Lindorff-Larsen K, Piana S, Dror RO, Eastwood MP, Bank JA, Jumper JM, Salmon JK, Shan YB, Wriggers W. Science. 2010;330:341–346. doi: 10.1126/science.1187409. [DOI] [PubMed] [Google Scholar]
- 27.Ensign DL, Kasson PM, Pande VS. J of Mol Biol. 2007;374:806–816. doi: 10.1016/j.jmb.2007.09.069. [DOI] [PMC free article] [PubMed] [Google Scholar]
- 28.Freddolino PL, Harrison CB, Liu YX, Schulten K. Nature Physics. 2010;6:751–758. doi: 10.1038/nphys1713. [DOI] [PMC free article] [PubMed] [Google Scholar]
- 29.Ellis JP, Culviner PH, Cavagnero S. Protein Science. 2009;18:2003–2015. doi: 10.1002/pro.196. [DOI] [PMC free article] [PubMed] [Google Scholar]
- 30.Ugrinov KG, Clark PL. Biophys J. 2010;98:1312–1320. doi: 10.1016/j.bpj.2009.12.4291. [DOI] [PMC free article] [PubMed] [Google Scholar]
- 31.Minton AP, Wilf J. Biochemistry. 1981;20:4821–4826. doi: 10.1021/bi00520a003. [DOI] [PubMed] [Google Scholar]
- 32.van den Berg B, Wain R, Dobson CM, Ellis RJ. The EMBO Journal. 2000;19:3870–3875. doi: 10.1093/emboj/19.15.3870. [DOI] [PMC free article] [PubMed] [Google Scholar]
- 33.Perham M, Stagg L, Wittung-Stafshede P. FEBS Letters. 2007;581:5065–5069. doi: 10.1016/j.febslet.2007.09.049. [DOI] [PubMed] [Google Scholar]
- 34.Samiotakis A, Wittung-Stafshede P, Cheung MS. International Journal of Molecular Sciences. 2009;10:572–588. doi: 10.3390/ijms10020572. [DOI] [PMC free article] [PubMed] [Google Scholar]
- 35.Wang Y, Li C, Pielak GJ. J Am Chem Soc. 2010;132:9392–9397. doi: 10.1021/ja102296k. [DOI] [PMC free article] [PubMed] [Google Scholar]
- 36.Miklos AC, Sarkar M, Wang Y, Pielak GJ. J Am Chem Soc. 2011;133:7116–7120. doi: 10.1021/ja200067p. [DOI] [PubMed] [Google Scholar]
- 37.Stagg L, Christiansen A, Wittung-Stafshede P. Journal of the American Chemical Society. 2011;133:646–648. doi: 10.1021/ja107638e. [DOI] [PubMed] [Google Scholar]
- 38.Ignatova Z, Gierasch LM. Proceedings of the National Academy of Sciences of the United States of America. 2004;101:523–528. doi: 10.1073/pnas.0304533101. [DOI] [PMC free article] [PubMed] [Google Scholar]
- 39.Ebbinghaus S, Dhar A, McDonald JD, Gruebele M. Nat Methods. 2010;7:319–323. doi: 10.1038/nmeth.1435. [DOI] [PubMed] [Google Scholar]
- 40.Christiansen A, Wang Q, Samiotakis A, Cheung MS, Wittung-Stafshede P. Biochemistry. 2010;49:6519–6530. doi: 10.1021/bi100578x. [DOI] [PubMed] [Google Scholar]
- 41.Reich CI, McNeil LK, Brace JL, Brucker JK, Olsen GJ. Extremophiles. 2001;5:265–275. doi: 10.1007/s007920100197. [DOI] [PubMed] [Google Scholar]
- 42.Yang WY, Gruebele M. Biochemistry. 2004;43:13018–13025. doi: 10.1021/bi049113b. [DOI] [PubMed] [Google Scholar]
- 43.Ghaemmaghami S, Word JM, Burton RE, Richardson JS, Oas TG. Biochemistry. 1998;37:9179–9185. doi: 10.1021/bi980356b. [DOI] [PubMed] [Google Scholar]
- 44.Dhar A, Samiotakis A, Ebbinghaus S, Nienhaus L, Homouz D, Gruebele M, Cheung MS. Proc Natl Acad Sci. 2010;107:17586–17591. doi: 10.1073/pnas.1006760107. [DOI] [PMC free article] [PubMed] [Google Scholar]
- 45.Nishii I, Kataoka M, Tokunaga F, Goto Y. Biochemistry. 1994;33:4903–4909. doi: 10.1021/bi00182a019. [DOI] [PubMed] [Google Scholar]
- 46.Ballew RM, Sabelko J, Reiner C, Gruebele M. Rev Sci Instrum. 1996;67:3694–3699. [Google Scholar]
- 47.Yang W, Gruebele M. Biophys J. 2004;87:596–608. doi: 10.1529/biophysj.103.039040. [DOI] [PMC free article] [PubMed] [Google Scholar]
- 48.Perry RH, Chilton CH. Perry’s Chemical Engineer’s Handbook. Mc Graw-Hill; New York: 1973. [Google Scholar]
- 49.Kim SJ, Dumont C, Gruebele M. Biophys J. 2008;94:4924–4931. doi: 10.1529/biophysj.107.123240. [DOI] [PMC free article] [PubMed] [Google Scholar]
- 50.Berova N, Nakanishi K, Woody RW. Circular dichroism: principles and applications. Wiley; New York: 2000. [Google Scholar]
- 51.Prigozhin MB, Gruebele M. Journal of the American Chemical Society. 2011;133:19338–19341. doi: 10.1021/ja209073z. [DOI] [PMC free article] [PubMed] [Google Scholar]
- 52.Minton AP. Biophys J. 2005;88:971–985. doi: 10.1529/biophysj.104.050351. [DOI] [PMC free article] [PubMed] [Google Scholar]
- 53.Dhar A, Girdhar K, Singh D, Gelman H, Ebbinghaus S, Gruebele M. Biophys J. 2011;101:421–430. doi: 10.1016/j.bpj.2011.05.071. [DOI] [PMC free article] [PubMed] [Google Scholar]
- 54.Minton AP. Biophys J. 2000;78:101–109. doi: 10.1016/S0006-3495(00)76576-3. [DOI] [PMC free article] [PubMed] [Google Scholar]
- 55.Cheung MS, Klimov Dmitri, Thirumalai D. Proc Nat Acad Sci USA. 2005;102:4753–4758. doi: 10.1073/pnas.0409630102. [DOI] [PMC free article] [PubMed] [Google Scholar]
- 56.Sasahara K, McPhie P, Minton AP. J Mol Bio. 2003;326:1227–1237. doi: 10.1016/s0022-2836(02)01443-2. [DOI] [PubMed] [Google Scholar]
- 57.Mukherjee S, Waegele MM, Chowdhury P, Guo L, Gai F. Journal of Molecular Biology. 2009;393:227–236. doi: 10.1016/j.jmb.2009.08.016. [DOI] [PMC free article] [PubMed] [Google Scholar]
- 58.Dhar A, Ebbinghaus S, Shen Z, Mishra T, Gruebele M. Biophys J. 2010;99:L69–L71. doi: 10.1016/j.bpj.2010.08.066. [DOI] [PMC free article] [PubMed] [Google Scholar]
- 59.Ando T, Skolnick J. Proc Nat Acad Sci USA. 2010;107:18457–18462. doi: 10.1073/pnas.1011354107. [DOI] [PMC free article] [PubMed] [Google Scholar]
- 60.Samiotakis A, Cheung MS. J Chem Phys. 2011:135. doi: 10.1063/1.3656691. [DOI] [PubMed] [Google Scholar]
- 61.Humphrey WF, Dalke A, Schulten K. J Mol Graphics. 1996;14:33–38. doi: 10.1016/0263-7855(96)00018-5. [DOI] [PubMed] [Google Scholar]